Glass, written by a team of renowned researchers and experienced book authors in the field, presents an overview on general features of glasses and the glass transition. Different classes of glassforming systems, such as silicate glasses, metallic glasses, and polymers, are exemplified. In addition, the wide field of phase formation processes and its effects on glasses and their properties is studied both from theoretical and experimental points of view.
Jürn W. P. Schmelzer, After completing his studies of physics at the University of Odessa, Ukraine, he holds research positions at the University of Rostock, Germany, and at the Joint Institute for Nuclear Research in Dubna, Russia. His research focuses on the properties of nanoparticles, the theory of phase formation processes, of glass formation and glass properties.
www.degruyter.com
ISBN 978-3-11-029838-3
Jürn W. P. Schmelzer (Ed.)
Edgar Dutra Zanotto (Center for Research, Technology and Education in Vitreous Materials, Brazil)
GLASS
“This book contains overviews on technologically important classes of glasses, their treatment to achieve desired properties, theoretical approaches for the description of structure-property relationships, and new concepts in the theoretical treatment of crystallization in glass-forming systems. It contains overviews about the state of the art and about specific features for the analysis and application of important classes of glass-forming systems, and describes new developments in theoretical interpretation by well-known glass scientists. Thus, the book offers comprehensive and abundant information that is difficult to come by or has not yet been made public.”
Jürn W. P. Schmelzer (Ed.)
GLASS
SELECTED PROPERTIES AND CRYSTALLIZATION
Christoph Schick, Evgeny Zhuravlev, René Androsch, Andreas Wurm, and Jürn W.P. Schmelzer
1 Influence of Thermal Prehistory on Crystal Nucleation and Growth in Polymers Observations regarding the effect of thermal history of crystallizing polymer melts onto the outcome of crystal nucleation and growth processes are investigated experimentally. Some results can be at least on a qualitative basis explained by classical nucleation theory (CNT) while others are not easy to understand in the framework of CNT. The origin of the respective problems and possible extensions of CNT to overcome them are briefly discussed. We chose polymers as model systems because they allow one a separate investigation of nucleation and growth processes in a wide temperature and time range. Furthermore they are well suited to be analyzed experimentally by the recently developed fast scanning calorimetry. In particular, by applying fast scanning calorimetry we are able to investigate processes in bulk samples and do not need to use droplets to study homogeneous nucleation kinetics. Fast scanning calorimetry enables us to observe homogeneous nucleation in materials crystallizing relatively fast like most of the industrial relevant semicrystalline polymers. Quantitative analysis allowed us to judge the nucleation efficiency of additives in the whole range of temperatures, where polymers crystallize. Besides the observed nucleation and growth below the glass transition information about the nucleation activity of small crystals grown at different temperatures relative to the cold-crystallization temperature range were obtained. Finally we show how relaxation of the under-cooled melt (glass) influences homogeneous nucleation. These data may serve as input for a more general description of the interplay of nucleation-growth and relaxation processes within the framework of a structural order-parameter model.
1.1 Introduction The basic theoretical concepts underlying the description of crystal nucleation and growth processes were developed 80–90 years ago. In a variety of cases, the classical methods of describing nucleation that result from these ideas, namely classical nucleation theory (CNT) and the classical theory of crystal growth, supply us with a satisfactory description of the respective processes. However, in a not much less, or possibly even larger number of cases severe deviations between the theoretical predictions and experiment are observed. In this contribution we focus on some observations regarding the effect of thermal history of crystallizing polymer melts onto the outcome of crystal nucleation and growth processes. Some of them can be at least on a qualitative basis explained by CNT
Bereitgestellt von | Universitätsbibliothek Rostock Angemeldet |
[email protected] Heruntergeladen am | 26.05.14 13:00
2 | 1 Influence of Thermal Prehistory on Crystal Nucleation and Growth in Polymers while others are not easy to understand in the framework of CNT. We chose polymers as model systems because they allow one a separate investigation of nucleation and growth processes in a wide temperature and time range. Furthermore they are well suited to be studied experimentally by the recently developed fast scanning calorimetry. In particular, by applying fast scanning calorimetry we are able to investigate processes in bulk samples and do not need to use droplets to study homogeneous nucleation kinetics. The chapter is structured as follows: First we briefly discuss the state of art regarding theory in the framework of structural order-parameter descriptions. It is followed by the description of an experimental technique, differential fast scanning calorimetry, both providing a deeper insight into nucleation of crystals in dependence on melt history. In the main part of the contribution we then focus on experimental aspects applying the differential fast scanning calorimeter. We describe a way to generate samples with essentially no homogeneously formed nuclei at temperatures above and below the glass transition temperature. Since heterogeneities are never completely absent a strategy to minimize their impact on the observed crystallization is discussed. Making use of differential fast scanning calorimeters and combining both approaches finally allows us studying homogeneous nucleation kinetics under isothermal conditions. For experiments below the glass transition we show that nucleation starts only after significant volume and enthalpy relaxation towards the super-cooled liquid state. Here the influence of the state of the quenched melt regarding sub-Tg relaxation is important for nucleation even if the relaxation is not considered to generate order in the sample. Finally, we discuss the question how structures formed at annealing influence crystallization on heating. We show that crystals formed at temperatures above the cold-crystallization range do not act as nuclei there. But nuclei or crystals formed at so low temperatures that they melt on heating before the cold-crystallization range is reached are able to accelerate crystal growth.
1.2 State of the Art 1.2.1 Dependence of the Properties of Glass-forming Melts on Melt History The proper account of the circle of problems sketched out above is a hard task. Fig. 1.1 shows the typical relationship between the glass transition temperature Tg (for conventional cooling rates) and the temperature Tmax where the maximum of the steadystate nucleation rate is reached. It is evident that the maximum of the steady-state nucleation rate is found near to Tg . For this reason, one has to look carefully at the properties of the ambient glass-forming melt in order to determine correctly the thermodynamic driving force of the process of crystallization and the surface energy term. The typical behavior of the density of glass-forming systems during vitrification is shown in Fig. 1.2. The density increases with decreasing temperature but its val-
Bereitgestellt von | Universitätsbibliothek Rostock Angemeldet |
[email protected] Heruntergeladen am | 26.05.14 13:00
1.2 State of the Art
| 3
Fig. 1.1: (a) Dependence of the steady-state nucleation rates for α -Li2 O2 SiO2 on temperature as obtained by different authors [1]. Tg is the glass transition temperature and Tm the melting temperature. (b) Relation between the temperature of the maximum nucleation rate and the glass transition temperature for a large class of glass-forming melts. Different systems are specified by the different numbers (for the details see [2]).
Fig. 1.2: (a) Typical dependence of the density of glass-forming melts on temperature during cooling (shown here for a borosilicate glass) for different cooling rates. With an increase of the cooling rate (from 1 → 2 → 3), the glass-transition temperature is shifted to higher values. (b) Qualitative interpretation of this behavior employing one structural order-parameter connected with the free volume of the system under consideration. Curve 3 refers to the equilibrium state of the melt, curve 2 describes cooling at some given rate and curve 3 describes the method of determination of the glass-transition temperature as employed in Fig. 1.2a [1, 3, 4, 5].
ues depend not only on the thermodynamic state parameters but also on cooling rate or, more generally on the melt history, i.e. the way how the glass-forming melt was brought into its current state. In order to describe the behavior in thermodynamic terms, one has to introduce, at least one additional structural order-parameter denoted here as ξ which we may associate, for example, with the free volume of the melt under consideration. The rate of change with time of this additional order-parameter can be described for isothermal and isobaric conditions by dξ 1 =− (ξ − ξe ) . dt τ (p, T, ξ )
(1.1)
Bereitgestellt von | Universitätsbibliothek Rostock Angemeldet |
[email protected] Heruntergeladen am | 26.05.14 13:00
4 | 1 Influence of Thermal Prehistory on Crystal Nucleation and Growth in Polymers Here τ (p, T, ξ ) is the characteristic relaxation time which depends on pressure, temperature and the structural order-parameter. It can be shown [5, 6] that such a relaxation equation can easily reproduce the often observed relaxation behavior of the form ξ ∼ t1/2 and can give a key to the theoretical understanding of the stretched exponential relaxation kinetics. In Eq. (1.1), ξ e is the equilibrium value of the structural order-parameter. For given cooling and heating rates, q = (dT/dt), Eq. (1.1) can be transformed into a relation describing the change of the structural order-parameter with temperature. The solution of this equation for constant cooling and heating rates results in the dependencies shown in Figs. 1.2 and 1.3.
Fig. 1.3: (a) Dependence of the structural order-parameter on temperature for cooling and heating processes performed with the same absolute value of the rates of change of temperature. (b) Dependence of the characteristic relaxation time, τ (T , ξ ), on temperature for cooling and heating processes [1, 5]. By a dashed curve (1), the equilibrium value of the relaxation time is shown. The values of the relaxation time in cooling (2) and heating (3) differ due to differences in the respective values of the structural order parameter as shown in Fig. 1.3a.
Since the structural order-parameter is a function of pressure and temperature and of the melt history (cooling and heating rates), the thermodynamic properties of the melt also depend on the same set of parameters. It follows as a consequence that the thermodynamic state parameters of the crystal cluster in the ambient phase are, as a rule, dependent on the melt history as well. Once the bulk properties depend on melt history, the surface properties also have to depend on it. Consequently, the kinetics of crystal nucleation and growth is affected, in general, by melt history and may proceed, in particular, in a different manner for cooling and heating processes. The degree to which such effects are of importance is determined by the ratio of the characteristic time scales for relaxation and critical crystal nucleus formation (cf. the discussion in Section 1.4.2). Further, since the thermodynamic state parameters are dependent on the structural order-parameter(s), the kinetic parameters have to depend, in general, on the structural order-parameter(s) as well. For the case discussed here,such possible dependence is demonstrated in Fig. 1.3b obtained by similar computations as the ones shown in Fig. 1.3a.
Bereitgestellt von | Universitätsbibliothek Rostock Angemeldet |
[email protected] Heruntergeladen am | 26.05.14 13:00
1.2 State of the Art
| 5
In the above considerations, the structural order-parameter is assumed to have the same value for the whole system i.e. it is assumed that the processes do not depend on the spatial coordinates. However, the intensity of fluctuations in the glass transition range is as a rule higher as compared to systems in thermodynamic equilibrium. In the glass transition range, local fluctuations are not damped out since the system is in a non-equilibrium state. A particular experimental realization of such peculiarity consists in the “fluctuation flashes” in heating observed and discussed in detail by Porai-Koshits et al. (see [7] for an overview). Consequently, in glasses also some spatial heterogeneity can evolve affecting the nucleation-growth kinetics. Employing the structural order-parameter concept in this way for the description of glass-forming melts, the discussion of the dependence of the crystal nucleation and growth processes on the structure of glass-forming melts (see e.g. [8]) can be given a quantitative basis. In this treatment, structural properties are considered as additional parameters not determined uniquely by the conventional thermodynamic state variables such as number of moles, pressure and temperature but by additional parameters which can also be changed independently. Such approach is possible only if the system is out of equilibrium and is treated by introducing additional structural order-parameters. As a consequence, in such cases, in order to derive the nucleation and growth rates, one has to determine the bulk and surface properties as well as the dependence of kinetic parameters not only on numbers of moles, pressure and temperature but also on the (set of) structural order-parameters that depend, in general, on melt history (e.g. cooling and heating rates). A more extended analysis of the circle of problems sketched here is given in [6]. Consequently, in order to treat nucleation processes in glass-forming melts, as a rule, the melt history of the system under consideration has to be properly taken into account, in addition to the range of factors governing the crystallization process if the melt history can be neglected. An account of the melt history or the structure of the system can be made in the framework of the structural order-parameter approach as developed by De Donder. The application of this approach to the description of glass-forming systems is discussed in detail in [5] and the references cited therein. Further on, the dynamics of phase formation at some given temperature depends also on the amount of the crystal phase already present in the system. This is another aspect of thermal history effects which has to be incorporated into the description appropriately as well. Both mentioned thermal history effects are considered highly important in the analysis in the whole range of slow to ultrafast nano-calorimetry at cooling and heating rates which can be varied by described here methods in between 10−4 Ks−1 up to 106 Ks−1 [9, 10]. An experimental study of the possible effect of melt history on the kinetics of crystal nucleation and growth in polymers based on these methods is outlined in the present contribution (for additional supplementary information in this respect see also Chapters 2 and 10 in the present monograph).
Bereitgestellt von | Universitätsbibliothek Rostock Angemeldet |
[email protected] Heruntergeladen am | 26.05.14 13:00
6 | 1 Influence of Thermal Prehistory on Crystal Nucleation and Growth in Polymers 1.2.2 Polymer Crystallization The particular features of polymer crystallization have been of interest for decades since a large number of engineering polymers are semicrystalline [11]. Nevertheless, a general understanding of polymer crystallization has not yet been achieved [12–16]. In recent years new concepts describing polymer crystallization were developed. In particular, ideas put forward by Strobl [17, 18], Muthukumar [19], Olmsted, Ryan [20], Wunderlich et al. [21–23] and others have challenged the Hoffman-Lauritzen theory [24] (for a detailed discussion see The European Physical Journal E, Vol. 3, No. 2 (October 2000) pp. 165–200). Polymer crystallization usually takes place far from equilibrium with kinetically controlled mechanisms [18]. Typical crystallization temperatures include the vitreous state going over into the glass transition region by further heating (cold crystallization) to temperatures rarely higher than 5 K below the melting transition (hightemperature crystallization). Molecular processes in such non-equilibrium conditions may only be rigorously followed by direct molecular level simulations, such as molecular dynamics (MD) or Monte Carlo (MC) methods ([25, 26] and Chapter 9 of the present monograph). However, due to its extremely slow dynamics and complexity, polymer crystallization has been so far out of reach of the conventional molecular simulations [19, 26]. In a recent attempt Luo and Sommer performed MD-simulations for crystallization and melting of a polymer on cooling and heating at rates of about 2 ⋅ 107 Ks−1 [15, 27–29]. These scanning rates, now available in computer simulations, are getting close to the 106 Ks−1 rates, which are possible in fast scanning calorimetry on heating [30] as well as on cooling [10]. For a direct comparison of experimental and computer simulation data, another point has to be considered. In most computer simulations, homogeneous nucleation is assumed to be the starting point of crystallization, while in experiments crystallization originates in most cases from heterogeneous nuclei. Fast scanning calorimetry, on the other hand, is one of the few techniques allowing one fast enough cooling in bulk samples to avoid heterogeneous nucleation on cooling [31] in contrast to the earlier observed homogeneous nucleation in droplets [32–35]. While in droplets the occurrence of one homogeneously formed nucleus is commonly observed only after complete crystallization of the whole droplet, in bulk samples differential fast scanning calorimetry (DFSC) is able to follow the growth until impingement. It is therefore an attractive task to study crystallization and homogeneous nucleation processes at short time and consequently length scales, approaching that of MD simulations. Even though the time scales do not overlap at the moment, there is a good chance to reach this goal in the near future due to progress in computation as well as in calorimetry. Making use of an easy-to-operate DFSC [9, 36] we have studied isothermal nucleation and crystallization of fast crystallizing polymers, particularly poly(ε -caprolactone) (PCL), covering times from 10−4 s to 105 s and temperatures from about 25 K below the glass transition (Tg = 209 K at 10 K/min [37]) up to 330 K, which is close to the
Bereitgestellt von | Universitätsbibliothek Rostock Angemeldet |
[email protected] Heruntergeladen am | 26.05.14 13:00
1.2 State of the Art
| 7
Fig. 1.4: Nucleation and crystallization half-times for PCL at temperatures from below the glass transition up to the melting temperature covering 20 orders of magnitude in time. The two processes are compared to dielectric relaxation data (dashed curves) [39] and isothermal experiments applying a single sensor device (green (in the color version) or filled (in the black-and-white version) spheres) [40].
equilibrium melting temperature (Tm = 342 K [37]). With the fast scanning calorimeter we were able to follow the development of crystals at one temperature over 9 orders of magnitude in time [38]. The final result of such an experiment is illustrated in Fig. 1.4, describing crystallization in the classical mode [1], assuming nuclei formation and subsequent growth. Half-times, τ , of crystallization (blue in the colored version) and of homogeneous nucleation (red in the colored version) are shown for PCL. Crystallization means the combined effect of nucleation and growth as measured e.g. by calorimetry (heat of crystallization) or X-ray scattering. The half-time is determined from an Avrami fit to the overall latent heat as described in Section 1.3.4.1. The half-time of nucleation corresponds to the increasing number of nuclei (clusters) able to grow at temperatures above the glass transition on heating (cold-crystallization). This half-time is the time when half of the maximum of cold-crystallization enthalpy is reached (see Section 1.3.4.1 for details).
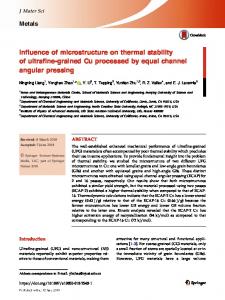
Fig. 1.5: (a) POMimages of PA 11 crystallized on heating an initially quenched sample and (b on slow cooling at 1 K min−1 [43].
Bereitgestellt von | Universitätsbibliothek Rostock Angemeldet |
[email protected] Heruntergeladen am | 26.05.14 13:00
8 | 1 Influence of Thermal Prehistory on Crystal Nucleation and Growth in Polymers
Fig. 1.6: (a) AFM phase-mode images of PA 11 crystallized on heating and annealing an initially quenched sample at 433 K and (b) on slow cooling at 10 K min−1 [43].
The rate of crystallization (both nucleation and growth) is zero at the equilibrium melting temperature, Tm , because the thermodynamic driving force for crystallization disappears at this point. Increasing the degree of under-cooling (decreasing temperature to lower values below Tm ), the crystallization half-time τ decreases due to an increase of under-cooling. It reaches a minimum at the temperature (TC min ) and increases again at even lower temperatures due to slowing down of molecular diffusion. Nucleation is, compared to crystallization, a more local process and therefore remains faster at lower temperatures than crystallization and its half-time minimum occurs at a lower temperature. Such kind of behavior can be explained alternatively by the consideration of the dependencies of both nucleation and growth rate on temperature (see e.g. Fig. 6.8 in [1]). Both curves exhibit a maximum but the maximum of the growth rates is located as a rule at higher temperatures as compared to the maximum of the nucleation rate. Figs. 1.5 and 1.6 show, as an example, optical and AFM microphotographs, respectively, for polyamide 11. The nodular, non-spherulitic and lamellar, spherulitic morphologies are seen in the photographs and are directly linked to crystallization starting with homogeneous (left side photographs) and heterogeneous (right side photographs) nucleation. The importance of the nucleation mechanism for the properties of the material is highlighted by the two microphotographs taken with crossed polarizers (POM). The right photo shows a bright image due to the birefringence of the spherulites formed at a few heterogeneous nuclei at low under-cooling of 25–50 K and grown to micro-meter size. In contrary, the left photo has been taken on a sample of polyamide, PA 11, which has been quenched to below the glass transition temperature and then crystallized on slow heating. Nuclei formation occurred in this case at an under-cooling of 160–180 K. The image is dark under crossed polarizers and the sample is transparent for visible light. This is due to crystallization starting from a large number of homogeneously formed nuclei and very limited crystal growth because of immediate space filling. The crystalline objects are of the order of 10 nm
Bereitgestellt von | Universitätsbibliothek Rostock Angemeldet |
[email protected] Heruntergeladen am | 26.05.14 13:00
1.2 State of the Art
| 9
and therefore much smaller than the wave length of visible light (for a more detailed discussion of these observations and the relation to mechanical properties see e.g. [41–44]). The direct measurement of nucleation is as a rule not possible by existing techniques due to the small size of the critical nuclei. Therefore indirect methods are usually employed [45]. In polarized optical microscopy the number of stabilized nuclei can be linked to the number of observed crystals or crystal aggregates such as spherulites, hedrites, or nodules ([23] (vol. 2) and [46]). In calorimetry, the coldcrystallization enthalpy on heating or at isothermal conditions was found to be dependent on the number of previously formed nuclei [47–53]. We follow these ideas but apply differential fast scanning calorimetry to extend the available scanning rate range of conventional DSC’s ( 20 K), although the area of the peak does not significantly change with increasing annealing time.
Fig. 1.34: Overall enthalpy change during isothermal crystallization at high temperatures (Tc = 270 K) and in the vicinity of the glass transition (Tg = 210 K).
and the latent heats were obtained. Two sets of results are shown in Fig. 1.34, where crystallization at two temperatures is compared for all samples. The crystallization behavior at Ta = 210 K is, within the uncertainty of mass determination, the same for all samples, while at Ta = 270 K the MWCNT nanocomposites crystallize significantly faster than neat PCL. For parametrization of the crystallization results, the Kolmogorov-Johnson-Mehl-Avrami formalism [132] was used to fit the data as detailed above in Section 1.3.4.1. The resulting fit curve and its temperature deriva-
Bereitgestellt von | Universitätsbibliothek Rostock Angemeldet |
[email protected] Heruntergeladen am | 26.05.14 13:00
1.3 Experimental |
47
Fig. 1.35: Crystallization half-times of neat and heterogeneously nucleated PCL. Data from [38] and [141] are shown in addition. The star is another independent measurement [98] of the 0.2 wt% MWCNT sample at 328 K showing the error-bar in addition.
tive are shown in Fig. 1.34b. The results of fitting can be seen as black thin lines in Fig. 1.34a. The obtained half-times of crystallization were plotted in Fig. 1.35 together with the data from Fig. 1.30. The results cover the full temperature range of crystallization from 180 K (Tg (10 K/min) = 209 K [37]) to 340 K (Tm = 342 K [37]). The estimated time constants cover the range from 10−2 s (crystallization of PCL with 5 wt% MWCNT at 280 K) to 3 ⋅ 109 s (crystallization at 185 K). In [38] it was shown that DFSC allows one to extend the temperature range for isothermal experiments for PCL from below the glass transition up to the melting temperature (185–340 K). The indirect measurement, evaluating heating scans at constant heating rate after the thermal treatment, allows one not only to investigate very slow crystallization processes, both at high and low temperatures, but the time resolution of the device makes it possible to follow also very fast (millisecond) ordering processes. Fig. 1.35 shows the obtained half-times for homogeneous nucleation for neat PCL [38] and the half-time of crystallization for neat PCL and the MWCNT composites. For temperatures down to about 220 K the nucleating effect of the MWCNTs is seen. At 270 K, the temperature of maximum crystallization rate for all composites, crystallization half-time is reduced by more than one order of magnitude. Here the MWCNTs are most efficient as nucleating agent. For temperatures below 220 K homogeneous nucleation becomes the dominant nucleation mechanism and the added heterogeneities (MWCNTs) do not speed up crystallization. The very good agreement for the temperature range of the minimum of the half-time of homogeneous nucleation (red (marked by open stars) curve in Fig. 1.35) and the coincidence of the crystallization kinetics
Bereitgestellt von | Universitätsbibliothek Rostock Angemeldet |
[email protected] Heruntergeladen am | 26.05.14 13:00
48 | 1 Influence of Thermal Prehistory on Crystal Nucleation and Growth in Polymers data for the neat and the nucleated PCL very much support the dominance of the homogeneously formed nuclei over the heterogeneities below 220 K.
1.3.5 Identification of Different Nuclei Populations Cold crystallization is seen in the measured heating curves as an exotherm that changes in size and location depending on the nucleation density and the activity of the nuclei present (Fig. 1.33). At a fixed heating rate the cold-crystallization enthalpy can be used as a relative measure of nucleation density. Additionally, a lower cold-crystallization temperature indicates more efficient nucleation and allows one to distinguish between different nuclei populations, but again only on a qualitative level. Fig. 1.36a shows selected heating scans from Fig. 1.33 of PCL with 2 wt% MWCNT after annealing at 195 K for times ranging from zero to 4 ⋅ 103 s. Heating was per-
Fig. 1.36: Selected heating curves from Fig. 1.33 after annealing at 195 K for different times of PCL with 2 wt% CNT (a) and neat PCL (b and c). The curves shown in a) and b) were measured at 5000 Ks−1 and c) at 1000 Ks−1 . The annealing time changes nearly equidistantly on a logarithmic scale: 0 s (red); 1 ms; 2 ms; 4 ms; . . . ; 2000 s; 4000 s (black).
Bereitgestellt von | Universitätsbibliothek Rostock Angemeldet |
[email protected] Heruntergeladen am | 26.05.14 13:00
1.3 Experimental
| 49
formed at 5000 Ks−1 . This rate is high enough to avoid crystallization in the neat PCL (Fig. 1.36b), but it is not too fast to prevent growth of crystals originating from the MWCNTs. Therefore even without annealing (red curve, 0 s) we see a coldcrystallization peak at about 275 K in Fig. 1.36a. With increasing annealing time, cold crystallization shifts to lower temperatures for about 30 K indicating the appearance of more active nuclei with longer annealing. Two distinct cold-crystallization peaks are seen in the nucleated PCL (Fig. 1.36a). The high-temperature peak around 275 K, present from the very beginning, is caused by the added heterogeneities. The low-temperature peak develops due to nuclei homogeneously formed during annealing at 195 K. With increasing annealing time the high temperature peak decreases and eventually disappears after 4 ⋅ 103 s annealing. Then all cold-crystallization is initiated by the homogeneously formed nuclei at low temperature around 245 K. The cold-crystallization peak maximum for the neat PCL (b) is located close to this temperature (250 K). At a heating rate of 5000 Ks−1 , the few heterogeneities which are always present in a sample, cannot initiate measurable crystallization because the time interval for crystal growth is too short at this relatively high heating rate. At a slightly lower heating rate of 1000 Ks−1 this is changing. In Fig. 1.36c, without annealing, cold crystallization is already seen at heating the neat PCL at 1000 Ks−1 . With increasing annealing time homogeneously formed nuclei increasingly initiate crystallization and take over cold-crystallization enthalpy from the heterogeneously nucleated cold crystallization. The general picture (Fig. 1.36c) is very similar to the nucleated PCL (Fig. 1.36a). These curves and all other curves in Fig. 1.33 clearly show that crystallization initiated by homogeneous nucleation is more efficient than by the added MWCNTs even at 5 wt% MWCNT. By this reason, the addition of MWCNT does not influence the crystallization kinetics or the final value of crystallinity when homogeneous nucleation is dominating the crystallization process as shown in Fig. 1.34a (Ta = 210 K). In other polymer nanocomposites, e.g. the polyamide layered silicate nanocomposites studied in [142], a significant reduction of the crystallization kinetics and the final degree of crystallinity was observed. This effect was explained by an immobilized polymer layer in the vicinity of the layered silicates (Rigid Amorphous Fraction, RAF). For the PCL+MWCNT composite the interaction between the polymer and the MWCNTs seems not to result in the formation of a significant RAF. It is worth mentioning that all this information is not available from non-isothermal crystallization experiments but only from isothermal annealing carried out in a wide range of temperatures. Having at hand the possibility to perform annealing experiments in the whole temperature range of interest allows us to study the influence of annealing temperature on cold crystallization. Particularly we wanted to know how nuclei or small crystals influence cold crystallization at a given heating rate [125]. Therefore we compared heating experiments with the critical heating rate of 1.8 ⋅ 104 Ks−1 for PCL1.4k after cooling with 105 Ks−1 (see Section 1.3.2.4) at three selected temperatures. The first temperature, 202 K, is just above the glass transition, as shown in Fig. 1.37a. For
Bereitgestellt von | Universitätsbibliothek Rostock Angemeldet |
[email protected] Heruntergeladen am | 26.05.14 13:00
50 | 1 Influence of Thermal Prehistory on Crystal Nucleation and Growth in Polymers short annealing times (0.0001 s up to 0.01 s) the sample remains non-crystalline on heating. After 0.1 s annealing, cold-crystallization on heating is seen and followed by its corresponding melting at higher temperature. The state of the sample at the beginning of the heating experiment can be evaluated (i) by comparing glass transition with the glass transition of the amorphous sample, (ii) by calculating the overall enthalpy change above glass transition, and (iii) by comparing the cold-crystallization enthalpies. Identical glass transitions and an overall enthalpy change of zero demonstrate the non-crystalline state even after 0.1 s annealing at 202 K. For longer annealing times both criteria indicate initial crystallinity – the heat capacity step at glass transition becomes smaller and is shifted to higher temperatures and the overall enthalpy change is endothermic. The heating curves after annealing at 272 K in Fig. 1.37c show a much different behavior. Whereas for the short times, e.g. 0.01 s, the sample also remains amorphous, no cold crystallization can be detected after longer annealing times either. Only the melting endotherms just above the annealing temperature are present, related to the melting of isothermally formed crystals increasingly annealed at longer annealing
Fig. 1.37: Apparent heat capacity of PCL1.4k from DFSC on heating with 1.8 ⋅ 104 Ks−1 after annealing for different times at 202 K (a), 252 K (b), and 272 K (c).
Bereitgestellt von | Universitätsbibliothek Rostock Angemeldet |
[email protected] Heruntergeladen am | 26.05.14 13:00
1.3 Experimental
| 51
times (commonly called “annealing peaks”). An intermediate annealing temperature of 252 K was chosen in the temperature range where the exothermic effect of cold crystallization or recrystallization on heating after low-temperature annealing is maximal. The heating curves are shown in Fig. 1.37b. Here the situation is similar as for hightemperature annealing. No cold crystallization and only melting can be observed. The shape of the melting curve supplies us now with an indication of two processes of crystallization, the initially grown crystals melt at the low-temperature side of the melting peak and the more prominent high-temperature portion of the melting peak is due to melting followed by reorganization processes. A similar behavior was found for several polymers and was also attributed to a melting and recrystallization processes on heating [47, 69, 71, 143]. In Fig. 1.37c, the melting peaks of the sample annealed at 272 K shift about 15 K towards higher temperatures with increasing annealing time. The higher melting temperature indicates higher stability of the crystals and can be associated with an internal stabilization of the crystals, observed for most polymers on isothermal crystallization from the melt [144] and was studied for PCL with X-ray diffraction by Strobl [145]. The existence of such a stabilization process during isothermal crystallization was confirmed by DMA [146] and X-ray scattering experiments [147]. A gradual, less complete shift of melting to higher temperatures due to stabilization with increasing annealing time is also observed after crystallization at 252 K in Fig. 1.37b. In contrast, low-temperature annealing at 202 K causes a constant final termination of melting at 313 K, independent on annealing time (see Fig. 1.37a). At 202 K the initially formed crystals melt already during a low-temperature endotherm at temperatures below 273 K. The shift of the melting peak from 223 K after annealing for 1 s to 255 K after annealing for 3⋅104 s is again the consequence of the internal stabilization process of the isothermally formed crystals. But on further heating, after total low-temperature melting, recrystallization followed by melting of the recrystallized species is observed. Heating at the same rate provides the same recrystallization conditions, resulting in an identical final melting temperature as it was also observed for PET [69], iPS [71], and iPP [74, 148]. Fig. 1.37 and above discussion show how nucleation and crystallization influence the glass transition. On the other hand Fig. 1.36 provides further interesting details about nucleation in PCL annealed below the glass transition temperature of the amorphous sample. Meanwhile it was shown for several polymers that ordering (nucleation and crystallization) in polymers can take place already in the glassy state [38, 43, 125, 127, 149, 150]. In the next section, we discuss the interplay between enthalpy relaxation in the glassy state and crystal nucleation in more detail.
Bereitgestellt von | Universitätsbibliothek Rostock Angemeldet |
[email protected] Heruntergeladen am | 26.05.14 13:00
52 | 1 Influence of Thermal Prehistory on Crystal Nucleation and Growth in Polymers 1.3.6 Enthalpy Relaxation and Crystal Nucleation in the Glassy State 1.3.6.1 Neat and Nucleated PCL The enthalpy relaxation, disordering and cold-crystallization peaks after annealing at temperatures below and slightly above the glass transition temperature, were analyzed separately in order to investigate the disordering (melting of crystals and nuclei) and its influence on crystallization on further heating in more detail. The sample containing 5 % MWCTN was used as an example because it also will demonstrate the high efficiency of homogeneous nucleation in this highly heterogeneously nucleated sample [99]. A series of heating scans after annealing for different times at 205 K is shown in Fig. 1.38. After 10 s annealing (blue curve in color version) the typical enthalpy recovery peak appears. It is located at the high temperature end of the glass transition region, with the glass transition temperature only marginally shifted. For longer annealing times, a sharp peak at an up to 20 K higher temperature develops. Annealing at 205 K causes an approach to the enthalpy of the supercooled liquid within a second (Fig. 1.39b), and at longer times saturation of all annealing effects is expected. The large shift of the peak and the long times where changes are observed do not allow one to assign this peak to enthalpy relaxation alone [151, 152]. That the two processes are overlapping in the temperature range just above the glass transition is seen for the neat PCL in Fig. 1.33. Two distinct peaks appear and the second was already assigned to the melting of a large number of crystals which immobilize the remaining amorphous matrix [38]. Careful integration was performed in order to confirm ordering/nucleation of polymers below the glass transition and its relation to enthalpy relaxation in analogy to studies discussed below [38, 43, 125, 127, 149, 150]. Fig. 1.39a shows integration ex-
Fig. 1.38: PCL+5 wt% MWCNT, annealed at 205 K for different times and heated at 5000 Ks−1 .
Bereitgestellt von | Universitätsbibliothek Rostock Angemeldet |
[email protected] Heruntergeladen am | 26.05.14 13:00
1.3 Experimental |
53
Fig. 1.39: (a) Analysis of the enthalpy of relaxation and melting peak development at different temperatures. (b) Comparison with the cold crystallization peak area (for details see text).
amples for curves from Fig. 1.38. The peaks originating from superimposed enthalpy relaxation and disordering are further superimposed by the apparent shift of the glass transition due to the occurrence of a large rigid amorphous fraction (RAF) [126]. In order not to falsify the peak areas by this effect, we used for all integrations the liquid heat capacity as baseline (dotted lines in Fig. 1.39a, top insertions) and count only the areas above this line. Fig. 1.39b shows the evolution of the peak areas (enthalpy change) as a function of annealing time for different annealing temperatures. The upper panel presents the enthalpy change related to the first endothermic peak. In a first step, within less than 10 s, the enthalpy approaches the enthalpy of the supercooled liquid (enthalpy relaxation). The horizontal dashed lines are the limiting values estimated from the step of the heat capacity at Tg and the difference between Tg and Ta (see insert). The further increase of the enthalpy change cannot be assigned to enthalpy relaxation but to melting of crystals formed during annealing [38]. The very low melting temperature of these crystals (240 K) corresponds according to the Gibbs-Thomson equation to crystal sizes of about 2–3 nm (see [125] for details). Next, we compare the development of enthalpy relaxation and melting of the crystals with the development of cold-crystallization enthalpy as a measure of nucleation density (Fig. 1.39b, lower panel). The starting level of cold-crystallization enthalpy of −22 J/g is due to the added 5 wt% MWCNT. Nevertheless, after annealing for 0.1 s at 205 K, isothermally formed nuclei increase the cold-crystallization enthalpy further
Bereitgestellt von | Universitätsbibliothek Rostock Angemeldet |
[email protected] Heruntergeladen am | 26.05.14 13:00
54 | 1 Influence of Thermal Prehistory on Crystal Nucleation and Growth in Polymers (see discussion in Section 1.3.4). Comparing the corresponding curves in the upper and the lower panel of Fig. 1.39b shows that the increase in cold-crystallization enthalpy for all annealing temperatures coincides with the approach of the first step (enthalpy relaxation) to its limiting value (horizontal dashed lines). A similar behavior was found for neat PCL in [38] and other polymers as discussed below and in [43, 127, 149, 150]. The approach of the enthalpy change to its limiting value corresponds to a densification of the polymer. This densification presumably proceeds by cooperative rearrangements on a length scale of a few nanometers [153]. On the other hand an estimate from the Gibbs-Thomson equation yields a crystal size of about 2–3 nm for the crystals melting at 240 K [125]. Nucleation around 200 K is therefore expected to occur on an even smaller length scale. It seems plausible that the large scale cooperative rearrangements causing densification and enthalpy relaxation prevent the formation of overcritical nuclei as long as the process is active. Only after equilibrating the amorphous polymer with respect to density and enthalpy according to the corresponding liquid values nucleation can occur at the annealing temperature. This observation provides evidence for the influence of the state of the polymer (pre-history) on nucleation and crystallization, discussed in Section 1.4.
1.3.6.2 Isotactic Polypropylene (iPP) Fig. 1.40 shows DFSC heating curves of initially glassy iPP after annealing for different periods of time at 220 K. The time of annealing was varied covering seven orders of magnitude from 10−3 to 104 s, including immediate reheating after the minimum temperature of the experiment of 100 K has been reached. The heating curve of the non-annealed sample (0 s annealing time, blue curve in color version) shows the glass transition at about 260 K, being superimposed by a small endothermic peak. We in-
Fig. 1.40: Apparent specific heat capacity of iPP as a function of temperature, measured on heating at a rate of 3 ⋅ 104 Ks−1 after annealing initially glassy samples for different periods of time at 220 K.
Bereitgestellt von | Universitätsbibliothek Rostock Angemeldet |
[email protected] Heruntergeladen am | 26.05.14 13:00
1.3 Experimental |
55
terpret this peak as a classical hysteresis peak due to different rates of cooling and heating [152, 154]. Furthermore the data of Fig. 1.40 indicate that the glass transition apparently shifts to higher temperature and that the area and temperature of the endothermic peak increase with annealing time. Note that the small exothermic deviation at the high-temperature side of the endothermic peak is caused by the control loop of the calorimeter. The annealing induced observations shown in Fig. 1.40 may be interpreted as being related either to the formation of nuclei and small ordered domains with latent heat or, more likely, to classical enthalpy relaxation [152]. Fast cooling (vitrification) of the liquid is connected with the formation of a non-equilibrium glass of high enthalpy, which is expected to relax during aging to lower values as a function of time, ultimately approaching the enthalpy of the liquid at the particular temperature of 220 K. On reheating, devitrification of the relaxed glass would then show a hysteresis and continuously be followed by an endothermic enthalpy-recovery peak. The maximum possible enthalpy of relaxation (Δhrelax, max ) on annealing at 220 K is about 17 J/g [152], Δcp (Tg − Ta ) = 0.46 J/gK ⋅ (257.5 − 220)K ≅ 17 J/g, with Tg , Ta , and Δcp being the glass transition temperature, the annealing temperature and the heat capacity difference of solid and liquid iPP at Tg , respectively. Estimation of the decrease of the enthalpy of the glass formed on cooling at 1 ⋅ 104 Ks−1 during annealing for 1.44 ⋅ 104 s at 220 K yields a value of only 7–8 J/g, which indicates that the changes of the DFSC heating curves due to annealing indeed can be caused by enthalpy relaxation only. The relaxation process, however, is not complete; extrapolation of the evolution of the decrease of the enthalpy during annealing with time suggests that equilibrium may only be reached after annealing for at least 1010 s (>300 years), impossible to adjust with the present experiments. In other words, at present we do not fully exclude ordering of chain segments during annealing at 220 K, although a quantitative analysis of the change of enthalpy with time, as discussed below, favors enthalpy relaxation. In Fig. 1.41, DFSC heating curves of samples of iPP annealed at 230 K for different periods of time are shown. Analysis of the heating curves of the sample annealed at 220 K suggests classical enthalpy relaxation only and no indication of formation of homogeneous nuclei or even ordered domains at the annealing temperature; the estimate of the maximum possible decrease/relaxation of enthalpy has not been reached during annealing for 1.44 ⋅ 104 s. Heating of samples annealed at 230 K, in contrast, allows one not only detection of an endothermic peak at the glass transition but also exothermic cold-ordering between about 300 and 330 K, followed by disordering, reorganization and melting between 330 K and temperatures close to 400 K. Estimation of the maximum possible enthalpy of relaxation of the glass at 230 K yields a value of about 12 J/g, Δcp (Tg − Ta ) = 0.46 J/gK ⋅ (257.5 − 230) K ≅ 12 J/g,
Bereitgestellt von | Universitätsbibliothek Rostock Angemeldet |
[email protected] Heruntergeladen am | 26.05.14 13:00
56 | 1 Influence of Thermal Prehistory on Crystal Nucleation and Growth in Polymers
Fig. 1.41: Apparent specific heat capacity of iPP as a function of temperature in the glass transition range, measured on heating at a rate of 3 ⋅ 104 Ks−1 after annealing initially glassy samples for different periods of time at 230 K.
which, at least in part, causes the endothermic peak following the glass transition. While annealing up to few seconds seems to be connected to enthalpy relaxation only, continuation of annealing leads to additional formation of small ordered domains causing cold ordering on heating, and an increase of the enthalpy reduction during annealing to values larger 12 J/g after about 1000 s. Fig. 1.42 is a plot of the overall change of the enthalpy as a function of the time of annealing at 230 K (dark gray squares). The curves of Fig. 1.41 have been integrated between 200 and 450 K, and the value of the non-annealed sample has subsequently been subtracted to gain information about the sole effect of annealing. As such, the data represent enthalpy recovery on heating, initially gained during isothermal annealing. The data of Fig. 1.42 suggest that annealing for periods of time less than a few seconds leads to enthalpy relaxation only without reaching the limit of 12 J/g. Extension of annealing for periods of time longer than about 10 s is connected with additional exchange of latent heat, attributed to the formation of ordered domains, leading to an increase of the slope of the data in Fig. 1.42, and observation of cold-ordering on heating (Fig. 1.41). Evidence for ordering processes during extended annealing at 230 K ultimately is gained by experimental observation of a value of the enthalpy below that of the equilibrium liquid; annealing longer than 1000 s leads to a decrease of the enthalpy larger than 12 J/g. For comparison, in Fig. 1.42 are also shown data calculated from the DFSC heating curves of Fig. 1.40, which is, of samples annealed at 220 K. In this case, cold-ordering has not been observed on heating, and the maximum value of enthalpy relaxation of about 17 J/g has not been reached within the time
Bereitgestellt von | Universitätsbibliothek Rostock Angemeldet |
[email protected] Heruntergeladen am | 26.05.14 13:00
1.3 Experimental |
57
Fig. 1.42: Overall change of enthalpy of iPP as a function of the time of annealing at 230 K, calculated by integration the DFSC heating curves of Fig. 1.41, and subtraction of the enthalpy change of non-annealed amorphous iPP. For comparison, the plot contains data calculated from the DFSC heating curves collected after annealing at 220 K (gray squares) and 250 K (gray triangles). The horizontal arrows at the left-hand side indicate the maximum possible enthalpy relaxation (enthalpy relaxation limit) at the various annealing temperatures; changes of enthalpy beyond these limits unambiguously prove ordering at the annealing temperature connected with change of latent heat.
frame of the experiment as in case of annealing at 230 K. The enthalpy change during annealing obeys the expected exponential law without indication of additional formation of an ordered phase, as could be concluded either by exceeding the enthalpy relaxation limit of 17 J/g, or an increase of the slope of the enthalpy-change with time. Note again, extrapolation of the dashed line in Fig. 1.42 suggests that the enthalpy of the liquid would be reached only after annealing times larger than 1010 s. For further discussion of the DFSC curves of Fig. 1.41 it is important to note that the areas of the cold-ordering peak and subsequent disordering (II), reorganization and melting peaks are approximately identical, at least if the annealing time is less than 120 s. In other words, ordered domains formed on annealing at 230 K disorder in conjunction with the enthalpy recovery peak on devitrification of the amorphous phase. However, for the sake of complete description of data it is reported that annealing longer about 120 s leads to superposition of the disordering peak (I) with subsequently observed exothermic cold ordering; as a consequence, quantitative analysis of the enthalpy of cold ordering is then complicated. Notwithstanding, it has been suggested for PCL in Section 1.3.6.1 [38] that cold ordering on continuation of heating is initiated by self-nuclei left from incomplete randomization of formerly ordered domains during disordering (I). In case of the heating
Bereitgestellt von | Universitätsbibliothek Rostock Angemeldet |
[email protected] Heruntergeladen am | 26.05.14 13:00
58 | 1 Influence of Thermal Prehistory on Crystal Nucleation and Growth in Polymers experiments of iPP, performed at a rate of 3 ⋅ 104 Ks−1 , growth of self-nuclei is detected at temperatures between 300 and 330 K, that is, if the rate of mesophase formation is maximal [143]. The cold ordering is then contiguously followed by disordering and reorganization of the cold-ordered mesophase into crystals which ultimately melt around 375 K; the particular reorganization behavior of semi-mesomorphic iPP has been discussed in detail elsewhere [143, 155]. In conclusion, cold ordering is considered as a strong indication for changes of structure during annealing. Note that heating of iPP, annealed at 220 K, did not result in cold ordering despite heating was performed at identical rate as in the case of samples annealed at 230 K. In Fig. 1.43, DFSC heating curves obtained on samples annealed at 250 K for periods of time between 0 and 2500 s are shown. For the sake of clarity, the obtained heating curves are divided into two sets. The top set of curves represents samples which were annealed for periods of time between 0 and 0.1 s while the bottom set of curves represents samples annealed between 0.6 and 2500 s. Annealing at 250 K leads to negligible enthalpy relaxation compared to the annealing experiments at 220 and 230 K; the maximum possible enthalpy relaxation is here about 3 J/g, i.e., Δcp ⋅ (Tg − Ta ) = 0.46 J/gK ⋅ (257.5 − 250) K ≅ 3 J/g. The low endothermic peak at the glass transition, after annealing for 0.1 s, reveals an enthalpy recovery less than 3 J/g suggesting that the major portion of this peak, indeed, could be caused by enthalpy relaxation. Notwithstanding, simultaneous
Fig. 1.43: Apparent specific heat capacity of iPP as a function of temperature, measured on heating at a rate of 3 ⋅ 104 Ks−1 after annealing initially glassy samples for different periods of time at 250 K.
Bereitgestellt von | Universitätsbibliothek Rostock Angemeldet |
[email protected] Heruntergeladen am | 26.05.14 13:00
1.3 Experimental |
59
observation of cold ordering on continued heating indicates that there must have been formed already small ordered domains/homogeneous nuclei during annealing. Though the enthalpy of disordering of these domains/nuclei is small and perhaps below the detection limit, we assume that they get destroyed on heating and leave self-nuclei for cold-ordering. As in case of annealing at 230 K, the cold-ordering peak is immediately followed by endothermic disordering. The enthalpies of cold ordering and disordering, reorganization and melting are approximately identical, suggesting that annealing at 250 K for 0.1 s, or shorter time, did not result in measurable formation of ordered domains with latent heat release. Further increase of the time of annealing to values larger than about 0.5 s leads to a qualitative change of the heating curves, as is demonstrated with the bottom set of data. The cold-ordering peak apparently disappears and is replaced by an endothermic peak at approximately identical temperature, similar in appearance as in case of samples annealed at 230 K. We assume that cold ordering on heating still occurs, which, however, is just superimposed by the endothermic peak which we relate to minor amount of enthalpy recovery as a result of classical enthalpy relaxation of the unstable glass, and disordering of mesophase domains formed at 250 K. Again, the maximum possible enthalpy relaxation on annealing at 250 K is only 3 J/g. The major portion of the endothermic peak at the glass transition must therefore be caused by disordering of small mesophase particles. Worthwhile to be noted, ordering of molecule segments in the glassy state is connected with distinct immobilization of the amorphous phase, as is concluded from the increase of the glass transition temperature by more than 20 K [156]. A quantitative evidence for the formation of ordered domains during annealing at 250 K is provided by analysis of the change/decrease of the enthalpy with annealing time, shown in Fig. 1.42 with the gray triangles. The enthalpy decreases below the value of the equilibrium liquid after annealing for only about 10 s, that is, if the maximum possible value of about 3 J/g of enthalpy relaxation is exceeded, being in agreement with the observation of deviation of data from the enthalpy relaxation line.
1.3.6.3 Isotactic Polybutene-1 (iPB-1) The analysis of the effect of low-temperature aging on non-isothermal cold crystallization is further demonstrated with Figs. 1.44–1.48. Fig. 1.44 shows the apparent specific heat capacity data of iPB-1 of different thermal history recorded on heating at a rate of 100 Ks−1 . The various curves were obtained after cooling the iPB-1 melt to 213 K and subsequent aging at 243 K, that is, below Tg , for different periods of time between 0 (black curve, 0 s) and 1 ⋅ 104 s (different other (blue in color version) curves). Regardless of the aging conditions, before the beginning of the heating experiment the samples were completely amorphous, that is, aging at 243 K did not result in crystallization within the time frame of the aging experiment, as detailed below. The curve of non-aged iPB-1 shows with the heat-capacity increment at around 255 K the glass tran-
Bereitgestellt von | Universitätsbibliothek Rostock Angemeldet |
[email protected] Heruntergeladen am | 26.05.14 13:00
60 | 1 Influence of Thermal Prehistory on Crystal Nucleation and Growth in Polymers
Fig. 1.44: Apparent specific heat capacity of iPB-1 of different thermal history as a function of temperature, obtained on heating at a rate of 100 Ks−1 . All samples were initially rapidly cooled at 1000 Ks−1 to 213 K, and then annealed at 243 K for different periods of time between 0 and 104 s, as is indicated in the legend. Annealing below Tg leads to enthalpy relaxation and nuclei formation which, on heating, is detected with the enthalpy-recovery peak (1), and cold-crystallization peak (2), respectively.
sition, however, on continued heating neither exothermic cold crystallization nor endothermic melting is observed. As such, heating at 100 Ks−1 is sufficiently fast to avoid cold crystallization in the absence of previously formed nuclei, being a pre-requisite for analysis of the nucleation kinetics at low temperature [38, 125]. With increasing aging time up to 100 s, we observed first relaxation of the enthalpy which leads on heating to an endothermic enthalpy-recovery peak in conjunction with the glass transition. In Fig. 1.44, the enthalpy-recovery peak is indicated with the box labeled ‘1’. Aging for periods of time larger than 100 s is connected with the formation of crystal nuclei which causes on heating exothermic cold crystallization, labeled ‘2’ in Fig. 1.44. On continuation of heating, crystals formed during cold crystallization melt around 380 K. Since the areas of the cold-crystallization peak and melting peak for a sample of given annealing history are identical, it is concluded that crystals were absent at the beginning of the heating experiment. Quantitative data about the enthalpy recovery at the glass transition and the enthalpy of cold-crystallization is provided with Fig. 1.45. It shows the areas of the enthalpy-recovery peak (top part) and the cold-crystallization peak (bottom part) as a function of the time of aging at 243 K. The area of the enthalpy-recovery peak, determined as the area between the curves for the non-annealed sample (0 s, black) and the sample under consideration in the temperature range ‘1’, increases with increasing aging time to reach a plateau value after about 100 s. The obtained maximum enthalpy change is 5 J/g which is in accord with the maximum expected enthalpy of relaxation
Bereitgestellt von | Universitätsbibliothek Rostock Angemeldet |
[email protected] Heruntergeladen am | 26.05.14 13:00
1.3 Experimental
| 61
Fig. 1.45: Areas/enthalpies of the enthalpy-recovery peak (top part, curve 1) and cold-crystallization peak (bottom part, curve 2) of the FSC-curves obtained on iPB-1 of different thermal history shown in Fig. 1.44, with the data plotted as a function of the time of annealing at 243 K.
of the iPB-1 glass at 243 K. The latter amounts to about 4 J/g, and is determined as [152] Δcp (Tg − Ta ) = 0.41 J/gK ⋅ (252 − 243) K ≅ 4 J/g, with Ta and Δcp being the annealing temperature and the heat capacity difference of solid and liquid iPB-1 at Tg , respectively. Fast vitrification of the supercooled liquid is connected with the formation of a glass of high enthalpy, which relaxes during aging, connected with a lowering of the enthalpy, ultimately approaching the enthalpy of the liquid at the particular temperature of 243 K. On subsequent heating, devitrification of the relaxed glass is contiguously followed by an endothermic enthalpy-recovery peak. Cold crystallization in Fig. 1.45 is quantified as the area between the curves for the non-annealed sample (0 s, black) and the sample under consideration in the temperature range ‘2’. The data of Fig. 1.45 reveal that cold crystallization is only observed if the area of the enthalpy-recovery peak is nearly constant and has reached its expected maximum value. In other words, formation of crystal nuclei at 243 K only occurs if the enthalpy relaxation of the glass is completed. During isothermal annealing of the glass cooperative segmental mobility is accelerated by the driving force for relaxation, the distance from the equilibrium liquid state. This enhanced cooperative segmental mobility vanishes if the enthalpy reached the value of the hypothetic liquid phase at identical temperature. We observed that nuclei formation only occurs if the densification of the glass is finished, which implies that the formation of overcritical clusters of parallel aligned
Bereitgestellt von | Universitätsbibliothek Rostock Angemeldet |
[email protected] Heruntergeladen am | 26.05.14 13:00
62 | 1 Influence of Thermal Prehistory on Crystal Nucleation and Growth in Polymers molecule segments, that is, of crystal nuclei is not possible as long as the enhanced cooperative segmental mobility drives the sample towards the supercooled liquid state. This interpretation of the link between the enthalpy relaxation of the glass and the formation of crystal nuclei presumes a homogeneous nucleation mechanism, similar as it has been suggested in a study of the nucleation and crystallization behavior of PCL above [38]. The effect of aging of an initially fully amorphous iPB-1 at temperatures slightly above Tg is demonstrated with Figs. 1.46 and 1.47. Fig. 1.46 shows apparent specific heat capacity data of initially amorphous iPB-1 which has been aged at 273 K for different periods of time, as is indicated in the legend. The black curves were obtained on samples which have been aged at 273 K for periods of time up to 2 s. The data reveal – with the step-like increase of the heat capacity – the glass transition at about 255 K. However, on increasing the temperature no further thermal events are seen, leading to the conclusion that both nucleation and crystal growth were not initiated. If the annealing time is between 2 and 200 s (blue curves in the colored version) then, besides the glass transition at 255 K, exothermic cold-crystallization followed by endothermic melting is detected. The heat-capacity increment on devitrification of the glass and equal areas of the cold-crystallization and melting peaks prove that before the beginning of the FSC heating scan, samples were non-crystalline. Cold crystallization is caused by the formation of crystal nuclei during aging, with the area of the cold-crystallization peak being proportional to the number of nuclei formed. Further increase of the time of aging beyond 200 s leads to crystallization. The heat capacity increment at Tg is reduced to about 2/3 of the value expected for a fully amorphous sample, and the glass transition range becomes wider and is shifted to higher tem-
Fig. 1.46: Apparent specific heat capacity of iPB-1 of different thermal history as a function of temperature, obtained on heating at a rate of 100 Ks−1 . All samples were initially rapidly cooled at 1000 Ks−1 to 213 K, and then annealed at 273 K for different periods of time, as is indicated in the legend.
Bereitgestellt von | Universitätsbibliothek Rostock Angemeldet |
[email protected] Heruntergeladen am | 26.05.14 13:00
1.3 Experimental |
63
Fig. 1.47: Enthalpy of cold crystallization (squares) on heating iPB-1 of different thermal history at a rate of 100 Ks−1 (Fig. 1.46), plotted as a function of the time of prior annealing at 273 K (bottom part). The top part shows the overall change of the enthalpy during annealing at 273 K (diamond symbols). Black (central part) and white (right side) coloring of symbols indicates the time ranges of annealing at which formation of homogeneous crystal nuclei and crystal growth is observed, respectively.
peratures after aging for more than 500 s at 273 K. Moreover, cold crystallization is almost completely absent, and the observed overall change in enthalpy is related to crystals which were formed during annealing. The small endotherm around 315 K may be linked to partial melting associated to mobilization of rigid amorphous segments, which was proven to be completed in this temperature range [157]. A quantitative analysis of the FSC-curves of Fig. 1.46 is provided with Fig. 1.47 that visualizes the area of the cold-crystallization peak (bottom part) and overall change of the enthalpy during aging at 273 K as a function of the time of aging (top part). The overall enthalpy change on heating is determined in the temperature range from 280 to 400 K as the integral of the difference between the measured curve and a linear baseline connecting the integration limits. The gray-colored symbols at aging times less than 2 s indicate that neither cold-crystallization/nuclei formation during aging nor crystallization occurred. Aging between 2 and 200 s, indicated by black coloring of symbols, leads to cold-crystallization/formation of crystal nuclei, however, crystal growth during aging is not detected since the overall enthalpy change remains equal to zero. Only if the aging time exceeds 100 s then crystallization is observed, being in accordance with the half-times of crystallization shown in Fig. 1.32. It is worthwhile noting that the area of the cold-crystallization peak decreases as crystallization proceeds during annealing for times longer than 200 s. In analogy to the experiments and data evaluation explained with Figs. 1.44–1.47, in Fig. 1.48 are shown the overall change of the enthalpy (top part) and the enthalpy of
Bereitgestellt von | Universitätsbibliothek Rostock Angemeldet |
[email protected] Heruntergeladen am | 26.05.14 13:00
64 | 1 Influence of Thermal Prehistory on Crystal Nucleation and Growth in Polymers
Fig. 1.48: Enthalpy of cold crystallization on heating iPB-1 of different thermal history at a rate of 100 Ks−1 , plotted as a function of the time of prior annealing at different temperatures as is indicated at each curve (bottom part). The top part shows the overall change of the enthalpy during annealing at the various temperatures as a function of the annealing time.
cold crystallization (bottom part) of iPB-1 aged at different temperatures as a function of the time of annealing. The top set of data shows that with decreasing aging temperature, within the frame of the analyzed temperature range from 243 to 283 K, the curves are shifted to larger times, that is, the crystallization rate decreases. This result is expected from the cold-crystallization experiments shown in Fig. 1.32 which revealed a maximum cold-crystallization rate at about 340 K. Analysis of the cold-crystallization behavior as a function of time and temperature of aging, provided by the bottom set of curves in Fig. 1.48, reveals that the nucleation rate is maximum at temperatures distinctly lower than 283 K. Aging at 263 and 268 K leads to cold crystallization on heating as a result of nuclei formation already after aging for 2 to 3 s. In contrast, if aging is performed at both either lower temperatures and or higher temperatures then the aging time to observe cold-crystallization/nuclei formation is increased. Quantitative information about the kinetics of formation of crystal nuclei was collected by analysis of FSC heating scans obtained on iPB-1 of different aging history. The FSC scans of samples aged below Tg were evaluated regarding the enthalpy recovery peak caused by prior enthalpy relaxation/densification of the glass and regarding the cold-crystallization peak related to prior formation of crystal nuclei. It has been found that the formation of crystal nuclei in glassy iPB-1 only occurs after completion of the enthalpy relaxation of the glass, similar as has been observed for PCL (see Section 1.3.6.1 and [38]). The link between the enthalpy relaxation of the glass and crystal nucleation is interpreted as pointing to a homogeneous nucleation process. Analysis of
Bereitgestellt von | Universitätsbibliothek Rostock Angemeldet |
[email protected] Heruntergeladen am | 26.05.14 13:00
1.3 Experimental |
65
the aging-time dependence of the enthalpy of cold crystallization on heating of samples aged at different temperatures leads to the conclusion that the rate of nucleation is maximal at around 265 K. In contrast, the maximum rate of form II crystallization is observed at distinctly higher temperatures in the range of 330–340 K.
1.3.6.4 Polyamid 6 (PA 6) Fig. 1.49 shows schematically the temperature-time profile of the FSC nucleation/crystallization experiments performed for PA 6. The specimen was melted by heating to 523 K and then cooled to different annealing temperatures between 313 and 383 K after a dwelling time of 0.5 s. The annealing time at the respective final annealing temperature was varied from 0.1 to 1 ⋅ 104 s. The cooling rate of 1000 Ks−1 to approach the annealing temperature was selected to ensure absence of formation of both nuclei and crystals before the beginning of annealing (Section 1.3.2).
Fig. 1.49: Temperature-time profile for analysis of changes of structure of initially glassy or liquid PA 6 during isothermal annealing.
It has been shown in prior work that cooling the melt of PA 6 faster than 200 Ks−1 suppresses crystallization [95, 150]. The glass transition at the selected cooling rate of 1000 Ks−1 occurs around 330 K, which implies that annealing experiments were performed on both initially glassy and liquid samples. The changes of structure during annealing – including densification of the glass, formation of crystal nuclei and crystal growth, depending on temperature – were again analyzed on subsequent heating. The kinetics of the densification of the glass is analyzed by the area of the enthalpyrecovery peak detected on devitrification of the glass while the kinetics of nuclei formation is followed by analysis of the cold-crystallization peak. While the enthalpy of
Bereitgestellt von | Universitätsbibliothek Rostock Angemeldet |
[email protected] Heruntergeladen am | 26.05.14 13:00
66 | 1 Influence of Thermal Prehistory on Crystal Nucleation and Growth in Polymers the enthalpy recovery peak related to prior enthalpy relaxation of the glass is nearly independent on the heating rate applied, the cold-crystallization behavior is strongly affected by the heating rate. In order to relate the enthalpy of cold crystallization to the formation of crystal nuclei during prior isothermal annealing, it is required that the heating rate is higher than a lower bound critical heating rate to avoid nuclei formation on heating. In addition, it is required that the heating rate is lower than a higherbound critical heating rate to permit crystal growth as discussed in Section 1.3.2. The lower-bound critical heating rate to avoid formation of crystal nuclei and cold crystallization on heating is about 500 Ks−1 . It is worthwhile noting that suppression of cold crystallization on heating requires a higher minimum rate of temperature change than is needed to suppress crystallization on cooling. For the particular homopolymer used in the present work the critical cooling rate to avoid melt-crystallization is only 100 Ks−1 , while suppression of cold crystallization requires heating faster than 500 Ks−1 . A major reason for this observation is that nuclei formed at rather low temperature, regardless whether on cooling at rates between 100 and 500 Ks−1 , or on immediate subsequent heating at rates lower than 500 Ks−1 are allowed to grow at relatively high temperature on heating. Note that the temperature of maximum (highest homogeneous) nucleation rate typically is distinctly lower than the temperature of maximum growth rate. Here non-isothermal nuclei formation is suppressed by cooling and heating the sample at 1000 Ks−1 . However, crystal growth on heating PA 6 at 1000 Ks−1 which contains nuclei still is permitted as is shown below. In the following, selected annealing experiments on initially, that is, before begin of annealing fully amorphous PA 6 will be explained, for demonstration of the effect of the annealing temperature on the occurrence and sequence of enthalpy relaxation, crystal nucleation and crystal growth. In each example, Flash-DSC 1 heating curves in conjunction with quantitative evaluation of transition enthalpies, obtained on samples annealed for different time will be shown and discussed. The process of enthalpy relaxation is analyzed by the enthalpy-recovery peak, the formation of crystal nuclei is probed by analysis of the cold-crystallization peak area, and crystal growth during annealing is detected by the mismatch between the enthalpies of melting and cold crystallization on heating. Flash-DSC 1 curves and transition enthalpies are gray color-coded. Flash-DSC 1 curves and enthalpies of transition shown in black indicate that annealing led to enthalpy relaxation only. In case of formation of crystal nuclei, data are shown in dark gray, and if there has been observed crystal growth during annealing, the corresponding curves and enthalpy data are shown in light gray. Fig. 1.50 shows heat-flow rate data of PA 6 as a function of temperature, obtained on cooling the melt at 1000 Ks−1 . The sample begins to vitrify around 335 K without prior crystallization at higher temperature. The vertical arrows at 313, 323, 333, and 348 K indicate the temperatures of the annealing experiments which are explained in detail below. The colors of the arrows indicate the changes of structure obtained during annealing for 1 ⋅ 104 s. Annealing amorphous PA 6 at 313 K for 1 ⋅ 104 s leads to enthalpy relaxation only, while annealing at 323 and 333 K for 1 ⋅ 104 s additionally
Bereitgestellt von | Universitätsbibliothek Rostock Angemeldet |
[email protected] Heruntergeladen am | 26.05.14 13:00
1.3 Experimental |
67
Fig. 1.50: Heat-flow rate of PA 6 as a function of temperature, obtained on cooling the melt at 1000 Ks−1 .
cause formation of crystal nuclei and eventually growth of crystals, respectively. In case of annealing at 348 K, enthalpy relaxation is absent, and only nuclei formation and crystal growth is detected. Fig. 1.51a shows apparent specific heat capacity data of PA 6 as a function of temperature, obtained on heating at a rate of 1000 Ks−1 . The various curves represent samples which have been annealed for different periods of time between 0 (bold gray curve) and 1 ⋅ 104 s (bold black curve) at a temperature of 313 K, that is, about 20 K below Tg . Before the beginning of annealing, as a result of prior fast cooling of the melt at 1000 Ks−1 , the samples were amorphous. The Flash-DSC 1 curve of the nonannealed sample shows with the heat-capacity increment the glass transition at about 345 K. With increasing time of annealing, the glass transition gets superimposed by
Fig. 1.51: Apparent specific heat capacity of PA 6 of different thermal history as a function of temperature, obtained on heating at 1000 Ks−1 . All samples were initially rapidly cooled at 1000 Ks−1 to 313 K, and then annealed for different periods of time between 0 and 10000 s, leading to enthalpy relaxation. The vertical arrow indicates the temperature of annealing (Ta ). b) Enthalpy of relaxation the glass of PA 6 as a function of the time of annealing at 313 K. Prior to annealing, the melt was vitrified on fast cooling at 1000 Ks−1 .
Bereitgestellt von | Universitätsbibliothek Rostock Angemeldet |
[email protected] Heruntergeladen am | 26.05.14 13:00
68 | 1 Influence of Thermal Prehistory on Crystal Nucleation and Growth in Polymers an enthalpy-recovery peak, indicating prior relaxation of the glass at the annealing temperature. The enthalpy of relaxation of the glass is shown as a function of the time of annealing in Fig. 1.51b. The data have been calculated by integration of the apparent specific heat capacities shown in Fig. 1.51a between 300 and 390 K, and subtraction of the enthalpy of the non-annealed sample. There is observed an increase of the enthalpy of relaxation of the glass with time, however, without the observation of an equilibrium value on extended annealing. Obviously, annealing the glass of PA 6 about 20 K below Tg for 1 ⋅ 104 s is insufficient to complete the relaxation process. The maximum expected enthalpy of relaxation, Δhrelax, max , amounts to about 8 J/g, as it can be estimated from the heat capacity difference Δcp between solid and liquid PA 6 at Tg , and the temperature difference between Tg and the annealing temperature Ta , i.e. [152], Δhrelax, max ≅ Δcp (Tg − Ta ) = 0.44 J/gK ⋅ (Tg − 313 K) ≅ 8 J/g. Note, we consider the calculation of ΔHrelax, max as an estimate only, due to uncertainties in the definition of Tg and additional relaxation processes occurring during cooling and heating the glass subsequent to the isothermal annealing step. Annealing below Tg leads to enthalpy relaxation and nuclei formation which, on heating, is detected with the enthalpy-recovery peak (1), and cold-crystallization peak (2), respectively. The vertical arrow indicates the temperature of annealing (Ta ). Fig. 1.52a shows apparent specific heat capacity data of PA 6 of different thermal history as a function of temperature, obtained on heating at 1000 Ks−1 . Prior to the
Fig. 1.52: (a) Apparent specific heat capacity of PA 6 of different thermal history as a function of temperature, obtained on heating at 1000 Ks−1 . All samples were initially cooled at 1000 Ks−1 to 323 K, and then annealed for different periods of time between 0 and 104 s. (b) Areas/enthalpies of the enthalpy-recovery peak (top part, curve 1) and cold crystallization peak (bottom part, curve 2) of the Flash-DSC 1 curves obtained on PA 6 of different thermal history shown in Fig. 1.52a, with the data plotted as a function of the time of annealing at 323 K.
Bereitgestellt von | Universitätsbibliothek Rostock Angemeldet |
[email protected] Heruntergeladen am | 26.05.14 13:00
1.3 Experimental
| 69
heating experiment, samples were vitrified by fast cooling at 1000 Ks−1 to 323 K, that is, to a temperature about 10 K below the onset of the glass transition during cooling, and then annealed for different periods of time between 0 and 1⋅104 s. The Flash-DSC 1 heating curve of non-annealed PA 6 (black bold curve) shows with the heat-capacity increment at about 345 K the glass transition and then, on continued heating, no further events connected with exchange of latent heat. With increasing annealing time, up to 100 s (black curves), there is detected an enthalpy recovery peak, denoted ‘1’ in Fig. 1.52a. If the annealing time exceeds 100 s, then the area of the enthalpy-recovery peak remains constant, and cold crystallization is observed in the temperature range between 375 and 450 K (blue curves in color version), followed by melting of crystals formed during cold crystallization. The areas of the cold-crystallization and the melting peaks are equal which proves absence of crystals before begin of the heating experiment. Fig. 1.52b shows the areas of enthalpy-recovery peak (top part, curve 1) and cold-crystallization peak (bottom part, curve 2) of the Flash-DSC 1 curves of Fig. 1.52a as a function of the time of annealing at 323 K. In contrast to the annealing experiment at 313 K, shown with Fig. 1.51, the maximum enthalpy of relaxation ΔHrelax, max of the glass of PA 6 on annealing at 323 K is decreased to about 3 J/g and the stabilization of the glass completes after about 100 s (see vertical line in Fig. 1.52b). Simultaneously, there is not observed formation of crystal nuclei during annealing for time periods less than 100 s, as it is concluded from the absence of the cold-crystallization peak on heating. The data of Fig. 1.52 suggest again that cold crystallization on heating, which is related to prior formation of crystal nuclei during isothermal annealing, occurs only if the process of enthalpy relaxation of the glass, quantified with the enthalpy-recovery peak, is completed. Fig. 1.53a shows Flash-DSC 1 heating curves of initially rapidly cooled PA 6 which prior to the heating experiment has been annealed at 333 K, that is, at a temperature slightly lower than the onset of the glass transition during cooling. Annealing for periods of time less than 2 s leads to minor enthalpy relaxation as indicated with the small peak on completion of the glass transition on heating at 350–360 K (black (fully dark smooth) curves). If the annealing time is between 2 and 500 s then the enthalpy-recovery peak at the glass transition remains constant in area, and we observe cold crystallization followed by melting (blue curves in the color version, left figure bottom part). The enthalpies of cold crystallization and melting are equal, that is, annealing up to 500 s does not lead to crystallization at the annealing temperature. Only if the annealing time is longer than 500 s, then the enthalpy of melting is larger than the enthalpy of cold crystallization, indicating crystallization during isothermal annealing at 333 K (red curves in the color version, left figure upper set of curves). Crystallization at 333 K is connected with a shift of the glass transition temperature towards higher temperature, and the appearance of a melting peak at temperatures lower than 400 K, related to the beginning of melting of crystals formed at the annealing temperature. Simultaneously, the cold-crystallization enthalpy decreases due to the lower number of active nuclei, caused by their prior growth to crystals. The high-
Bereitgestellt von | Universitätsbibliothek Rostock Angemeldet |
[email protected] Heruntergeladen am | 26.05.14 13:00
70 | 1 Influence of Thermal Prehistory on Crystal Nucleation and Growth in Polymers
Fig. 1.53: (a) Apparent specific heat capacity of PA 6 of different thermal history as a function of temperature, obtained on heating at 1000 Ks−1 . All samples were initially cooled at 1000 Ks−1 to 333 K, and then annealed for different periods of time between 0 and 104 s. (b) Areas/enthalpies of the enthalpy-recovery peak (top part) and cold crystallization peak (bottom part) of the Flash-DSC 1 curves obtained on PA 6 of different thermal history shown in Fig. 1.53a, plotted as a function of the time of annealing at 333 K. The overall change of the enthalpy during annealing (central part) was calculated by integration of the Flash-DSC 1 curves covering the temperature range of the endothermic melting peaks and the exothermic cold-crystallization peak, and subtraction of the value of the non-annealed sample. Central and right hand side part symbols indicate time ranges of annealing at which formation of homogeneous crystal nuclei and crystal growth is observed, respectively. Annealing leads to enthalpy relaxation, nuclei formation and crystal growth as is seen for the other polymers too and described in the text. The vertical arrow indicates the temperature of annealing (Ta ).
temperature melting peak around 470 K is interpreted as being related to melting of crystals formed by reorganization of crystals developed during annealing, as well as melting of crystals formed from the amorphous phase by cold-crystallization. For the sake of clarity in presentation, the set of curves obtained on samples annealed longer than 500 s (upper set of curves) is shifted relative to the curves obtained on samples annealed for shorter times. In Fig. 1.53b are shown the areas of the enthalpy-recovery peak (top part), of the cold-crystallization peak (bottom part), and the overall change of enthalpy as a function of the time of annealing at 333 K, calculated from the Flash-DSC 1 curves of Fig. 1.53a. The overall change of the enthalpy during annealing (center part) was calculated by integration of the Flash-DSC 1 curves covering the temperature range of the endothermic melting peaks and the exothermic cold-crystallization peak, and subtraction of the value of the non-annealed sample. Despite the low maximum en-
Bereitgestellt von | Universitätsbibliothek Rostock Angemeldet |
[email protected] Heruntergeladen am | 26.05.14 13:00
1.3 Experimental
| 71
thalpy relaxation during annealing of only about 1 J/g, the link between the enthalpy relaxation and nuclei formation, proposed with the annealing experiments performed at 323 K, is confirmed. Cold crystallization on heating is only obtained if the area of the enthalpy-recovery peaks remains constant, that is, if the enthalpy relaxation of the glass is complete. The decrease of the cold-crystallization enthalpy in samples annealed longer than 500 s is explained by growth of homogeneous nuclei to crystals during isothermal annealing. These nuclei are then not available to grow to crystals on heating, leading to reduced cold crystallization. In analogy to Figs. 1.51–1.53, which showed Flash-DSC 1 heating scans and enthalpies of transitions of PA 6 samples annealed at 313, 323, and 333 K, respectively, in Fig. 1.54a the sequence of nuclei formation and crystal growth of initially, that is, before begin of annealing at 348 K, fully amorphous PA 6 is demonstrated. As is shown with the blue (color version), respectively, thick black (black-white version) curves (annealing time 2 . . . 10 s) in Fig. 1.54a, annealing for periods of time between 2 and 10 s leads only to formation of nuclei as is indicated with the observed coldcrystallization peak, and the equivalency of the enthalpies of cold-crystallization and subsequent melting. If the annealing time is larger than 10 s then the area of the endothermic peaks in Fig. 1.54a exceeds the area of the exothermic peak, proving formation of crystals during isothermal annealing. Crystallization at 348 K is con-
Fig. 1.54: (a) Apparent specific heat capacity of PA 6 of different thermal history as a function of temperature, obtained on heating at 1000 Ks−1 . All samples were initially cooled at 1000 Ks−1 to 348 K, and then annealed for different periods of time between 0 and 104 s. Annealing leads to nuclei formation and crystal growth as is described in the text. The vertical arrow indicates the temperature of annealing (Ta ). (b) Enthalpy of the cold-crystallization peak of the Flash-DSC 1 curves obtained on PA 6 of different thermal history shown in Fig. 1.54a, plotted as a function of the time of annealing at 348 K. The top part shows the overall change of the enthalpy during annealing. Black and gray coloring of symbols indicates time ranges of annealing at which formation of homogeneous crystal nuclei and crystal growth is observed, respectively.
Bereitgestellt von | Universitätsbibliothek Rostock Angemeldet |
[email protected] Heruntergeladen am | 26.05.14 13:00
72 | 1 Influence of Thermal Prehistory on Crystal Nucleation and Growth in Polymers nected with a distinct increase of the glass transition temperature by about 10 K, that is, there is observed an immobilization of the amorphous phase due to the formation of crystals. Melting of crystals formed at 348 K occurs in conjunction with the devitrification of the amorphous phase, beginning at temperatures lower than about 400 K. The high temperature melting peak at about 470 K is related to the melting of both reorganized crystals which initially were grown during isothermal annealing at 348 K, and crystals formed during cold-crystallization. As discussed with Fig. 1.53b, the growth of nuclei to crystals during isothermal annealing reduces the number of nuclei which then would be available for cold crystallization. Consequently, the reduction of the enthalpy of cold crystallization parallels the increase of crystallinity during isothermal annealing.
1.3.7 Summary of Experimental Results and Conclusions Fig. 1.55 shows in the top part a series of curves, each representing the change of the enthalpy of PA 6 due to crystallization as a function of the annealing time at a specific annealing temperature. The red (upper part) dotted curve was obtained on a sample which has been annealed at 328 K, and provides the information that formation of crystals began after 1000 s. With increasing temperature of annealing of the initially fully amorphous PA 6, the onset time of crystallization decreases. In case of annealing PA 6 at 333 K (red (in the color version) dashed-dotted curve in the upper part), crystallization begins after 100 s while on annealing at 338 K (solid (red in the color version) curve in the upper part) the onset time of crystallization is further reduced to
Fig. 1.55: Enthalpy of cold crystallization on heating PA 6 of different thermal history at a rate of 1000 Ks−1 , plotted as a function of the time of prior annealing at different temperatures, as is indicated in the legend (bottom part). The top part shows the overall change of the enthalpy during annealing at the various temperatures as a function of the annealing time, indicating crystallization.
Bereitgestellt von | Universitätsbibliothek Rostock Angemeldet |
[email protected] Heruntergeladen am | 26.05.14 13:00
1.3 Experimental | 73
about 10 s. In other words, with increasing annealing temperature between 328 K (dotted (red in the color version) curve in the upper part) and 383 K (dashed curve in the upper part) the crystallization rate increases, as it is expected from former research about the temperature dependence of the crystallization rate [150, 158]. It is known that the crystallization rate of PA 6 has its maximum around 410 K, with the decrease of the crystallization rate on lowering the temperature related to the loss of cooperative mobility of amorphous molecule segments. Though not in focus of the present study, the data obtained provide also information about the transition from primary to secondary crystallization, as it is deduced from the pronounced decrease of the slope of the curves when the conversion exceeds a critical value. The bottom set of curves in Fig. 1.55 represents the enthalpy of cold crystallization as a function of the time and temperature of annealing, ultimately providing information about the temperature dependence of the rate of formation of nuclei. For easy comparison with the curves shown in the top part, the dotted, dashed-dotted, and solid blue (in the color version) curves were obtained on samples annealed at 328, 333, and 338 K, respectively. As in case of crystallization, an increase of the annealing temperature is connected with a shift of the curves to shorter time, that is, in the analyzed temperature range the nucleation rate decreases with increasing temperature. Comparison of the top and bottom sets of curves of Fig. 1.55 demonstrates that both the kinetics of nucleation and crystallization can advantageously be analyzed separately by the experimental approach applied here, and the companion studies on PCL, iPB-1, or iPP [38, 100, 125, 127]. For example, formation of crystal nuclei begins after about 10 s on annealing amorphous PA 6 at 333 K, while crystal growth connected with exchange of latent heat is only observed after 1000 s (see upper and lower dashed-dotted curves). The data of Fig. 1.55 were further reduced by evaluation of extrapolated onset times of formation of crystal nuclei and of crystals, to obtain quantitative information about the temperature dependence of crystal nucleation and crystal growth. Fig. 1.56 shows such extrapolated onset times of crystallization (gray squares) and nuclei formation (dark gray (blue in the color version) squares) as a function of the annealing temperature, focusing on the temperature range close to the glass transition temperature; the temperature range of the glass transition on cooling at 1000 Ks−1 applied in this work is indicated in Fig. 1.56 with the gray shaded area. In addition, Fig. 1.56 includes with the gray circles information about the time required to complete the process of enthalpy relaxation. It is concluded from visual inspection of the various data sets of Fig. 1.56 that formation of crystal nuclei in glassy PA 6 only occurs if the process of enthalpy relaxation of the glass is completed. The experimentally assessable decrease of the enthalpy of the glass to the value of the liquid state at identical temperature corresponds to a densification of the glass, involving cooperative rearrangement of molecule segments on a length scale of few nanometers [99, 153]. The data of Fig. 1.56 suggest that densification of the glass and disappearance of the relatively large scale motions connected to
Bereitgestellt von | Universitätsbibliothek Rostock Angemeldet |
[email protected] Heruntergeladen am | 26.05.14 13:00
74 | 1 Influence of Thermal Prehistory on Crystal Nucleation and Growth in Polymers
Fig. 1.56: Time to complete enthalpy relaxation, onset time of formation of crystal nuclei and onset time of crystallization as a function of the annealing temperature. The gray shaded area indicates the temperature range of the glass transition on cooling at a rate of 1000 Ks−1 .
enthalpy relaxation is completed prior to formation of crystal nuclei. Theoretical estimates show that for homogeneous nucleation frequently the characteristic relaxation times are considerably smaller than the typical times for formation of crystal nuclei of critical size (cf. [1] and Section 1.4). For heterogeneous nucleation, the respective difference between these time scales becomes smaller and nucleation may proceed even faster than relaxation. Thus, the experimentally in this work observed sequence of densification of the glass and nuclei formation is considered as evidence for a homogeneous nucleation mechanism. The here presented data for PCL, iPP, iPB-1 and PA 6 show a very similar behavior regarding enthalpy relaxation and homogeneous nucleation during annealing below or slightly above the glass transition temperature. Since the studied polymers exhibit very different crystallization kinetics (PCL and iPP very fast and iPB-1 and PA 6 significantly slower) the observed behavior seems to be universal. In all cases homogeneous nucleation only starts after finalizing enthalpy relaxation. Obviously there is a strong coupling between the processes responsible for enthalpy relaxation and homogeneous nucleation, respectively. In other words, the thermodynamic state of the supercooled melt (measured by its enthalpy) plays an important role for the homogeneous nucleation. We try to summarize and generalize this aspect in the next section.
1.4 Illumination of the Nucleation and Growth Mechanism 1.4.1 Low-temperature Endotherms and Homogeneous Nucleation The annealing treatment below the common glass transition of the polymers should allow us to gain information about details of homogeneous nucleation. In the classical model of nucleation and growth of crystals, one expects it to proceed from a crit-
Bereitgestellt von | Universitätsbibliothek Rostock Angemeldet |
[email protected] Heruntergeladen am | 26.05.14 13:00
1.4 Illumination of the Nucleation and Growth Mechanism
|
75
ical nucleus to a supercritical nucleus (both unstable with a positive free enthalpy of formation) and continue on to an initial, tiny, stable crystal with a free enthalpy of formation less than zero, and finally grow to macroscopic sizes (see, for example [1, 23]). In Fig. 1.57a, the results of thermal analysis are shown when heating a PCL sample after annealing at 195 K for different times. As for the other polymers under investigation, a structured, small endotherm appears close to the increase in heat capacity due to the glass transition. Such endotherms are normally single, small peaks, referred to as enthalpy relaxation of the amorphous phase. The development of the endotherm with annealing time is enlarged in Fig. 1.57b. The peak clearly separates into two events while the corresponding glass transition broadens and shifts to higher temperature. What is seen is a superposition of a typical enthalpy relaxation of the mainly amorphous sample with a small melting or disordering peak which indicates the presence of tiny crystals losing their thermodynamic stability somewhat above Ta , but before cold crystallization takes over. An early mention of similar observations can be found for selenium in its linear polymer allotrope and poly(ethylene terephthalate) (Figs. 2 and 1 on pages 617–618, respectively, in [159]). A quantitative evaluation of the peak area was performed by integrating the measured curves vs. temperature over a baseline obtained from a sample heated without annealing (black curve in Fig. 1.57b). The result of integration versus annealing time is shown in Fig. 1.57c. For comparison, the maximum value of enthalpy relaxation for amorphous PCL at the annealing temperature Ta = 195 K Δhrelax, max ≅ Δcp (Tg − Ta ) = 0.012 J/gK ⋅ (200 K − 195 K) ≅ 0.06 μ J is given by the horizontal line in Fig. 1.57c. The value equals the difference between the enthalpy of the glass and that of the under-cooled liquid at Ta (as marked by the vertical (red in the color version) line in Fig. 1.57d). After 5 min annealing, the area of the peak becomes larger than possible due to enthalpy relaxation alone, therefore, the second peak in the (blue in the colored version, upper arrow) curve (1 min) of Fig. 1.57b must be considered to be due to melting. May be there is already before 0.4 s (red curve in the color version, lower arrow) a small shoulder due to melting at the high temperature flank of the enthalpy relaxation peak. The presence of a relatively small melting peak between the glass transition and the beginning of cold crystallization (accounted for by less than 10 % crystallinity after 8 h annealing) depresses the glass transition in a way as it is otherwise only observed for the highly crystalline material marked by the orange in the color version, (8 h 235 K)-curve in Fig. 1.57b and reached after 8 h at 235 K. This confirms the creation of a large amount of rigid amorphous material even around the tiny crystals. To discuss the melting of the small crystals at Tm sc , close to Tg , we will try to apply classical nucleation theory, as described, for example, in [1, 23]. The schematic enthalpy diagram of Fig. 1.57d follows the analysis path. The first solid vertical (red in the color version) segment marks the densification of the initial glass which, on analysis by heating, yields the hysteresis peak at the upper end of the glass transition.
Bereitgestellt von | Universitätsbibliothek Rostock Angemeldet |
[email protected] Heruntergeladen am | 26.05.14 13:00
76 | 1 Influence of Thermal Prehistory on Crystal Nucleation and Growth in Polymers
Fig. 1.57: The heating after annealing at 195 K. (a) Evolution of annealing (melting) peaks with annealing time (for comparison the curve of material crystallized for 8 h at 235 K is given). (b) The annealing peak enthalpy (integrated against heating of fully amorphous material without annealing, black curve in (b). (c) Schematic representation in an enthalpy-temperature diagram. Note that an axis break was introduced in the ordinate because the enthalpy of the crystal is considerably smaller than that of the glass (d).
Simultaneously, however, as the glass approaches the dashed line of the extrapolated liquid, ordering takes place, moving the system into the bold dotted vertical (blue in the color version) segment beyond the enthalpy of the extrapolated liquid. The small crystals, grown at the temperature Ta , must by then have passed over the critical nucleus barrier (the saddle point in the free enthalpy landscape), and, as supercritical nuclei, grown to reach the small crystal sizes with a negative free enthalpy of formation from the amorphous phase (glass). This process of growing crystals slows down and stops as soon as the rigid-amorphous fraction, RAF, influences all remaining amorphous material, as seen from the glass transition in Fig. 1.57b and is discussed in more detail in [38]. On subsequent heating, part of the RAF may go through its glass transition, increasing the slope of the grey (green in the color version) dots in the schematic from that of the glass, ultimately to that of the under-cooled liquid, corrected by the crystallinity. At Tm sc melting or disordering begins. This scheme lets one note that the critical nucleus size at Tm sc is larger than at Ta and, using the calculations in [23] for the free enthalpy for the case of polyethylene as a measure, many
Bereitgestellt von | Universitätsbibliothek Rostock Angemeldet |
[email protected] Heruntergeladen am | 26.05.14 13:00
1.4 Illumination of the Nucleation and Growth Mechanism
| 77
of the supercritical nuclei at Ta are expected to revert back into embryos on heating to Tm sc and disappear without measurable latent heat if they are not able to stabilize themselves on heating. The small crystals grown at Ta remain stable up to their specific melting temperature, Tm sc , which depends on Ta as well as time for growth and perfection. Fig. 1.57b mirrors the distribution in perfection of these tiny crystals, and Fig. 1.28 illustrates the kinetics of the crystals grown at Ta . Fig. 1.57c further depicts the relation between enthalpy relaxation and homogeneous nucleation followed by crystallization. A separate melting peak is first seen after 10 s annealing. This is the time needed to reach the enthalpy of the supercooled liquid (horizontal line in Fig. 1.57c, lower end of the full (red in the color version) vertical line in Fig. 1.57d). Nevertheless, an increase of the number of active nuclei is observed at similar times. Particularly for the studies of iPP, iPB-1 and PA 6 it is seen that nucleation only occurs after completion of enthalpy relaxation. This is in accordance with the data for the half-time of nucleation and crystallization shown in Fig. 1.30. Crystallization requires mobility on the time (length) scale of the dynamic glass transition (α -relaxation) while nucleation is much faster (shorter length scale) and may occur at time scales closer to local relaxations (β -relaxation). While the dielectric α -relaxation has been linked to the dynamic glass transition (cooperative, segmental relaxation), the β -relaxation has been linked to more local processes (secondary relaxation) [160]. The crystallization at low temperatures follows the dielectric α -relaxation in the activation diagram, confirming that under such conditions crystallization is long-range diffusion controlled. The nucleation at low temperatures is assumed to have a homogeneous origin and it becomes two orders of magnitude faster than crystallization, positioned in-between the dielectric α - and β -relaxation, in agreement with Oguni’s observations [161], but, ultimately, it also approaches the slow-down of the α -process. One may speculate that the initial steps of nucleation involve both local and long range motion, something expected if in this stage the observation of molar mass segregation (molecular nucleation [21, 22]) is also taking place. Therefore it was an interesting task to study the influence of molecular mass and molecular mass distributions on the nucleation and crystallization kinetics as it was reported in [125]. Unfortunately, no clear answer was obtained regarding molar mass segregation (molecular nucleation). The classical polymer crystallization theory does not give insight in these actual molecular motion processes taking place during the early stages of crystallization. One newer model on this subject was proposed by Muthukumar [19]. Based on molecular dynamics simulation, he showed that the organization of the nucleus occurs in several steps and requires significant time before crystal growth actually starts. This scenario seems to be in agreement with our data. The crystallization shows a significant delay after nucleation occurs. It is seen from Figs. 1.28 and 1.57c that as soon as large scale crystallization begins, additional nucleation seems to stop. In this way, the newly developed DFSC allows one a check of the existing theories for polymer nucleation and crystallization and may, by generating more quantitative information, contribute to a better understanding of polymer crystallization and nucleation. Based on the present
Bereitgestellt von | Universitätsbibliothek Rostock Angemeldet |
[email protected] Heruntergeladen am | 26.05.14 13:00
78 | 1 Influence of Thermal Prehistory on Crystal Nucleation and Growth in Polymers observation, the classical nucleation and growth theory needs to be modified by coupling the thermodynamic landscape of the free energy with a mobility landscape (viscosity), which is also size (and perfection) dependent. As in the classical theory which identifies only one critical nucleus, it may be possible to identify a limited number of significant maxima, respectively, saddle points, for the multidimensional landscape, instead of identifying the complete path of the process.
1.4.2 Some Brief Theoretical Considerations In the present section, we briefly summarize and discuss some theoretical results of the classical theory of nucleation and growth processes to have a “baseline” allowing one to classify which experimental results can be explained by classical theory and which not. Considering nucleation at isothermal conditions after the melt was transferred into the respective state sufficiently fast to avoid nucleation and growth in cooling, in order to estimate the effect of possible deviations of the properties of the ambient liquid from equilibrium on crystallization, we have here to account for two different time scales, (i) the characteristic time of relaxation to the respective equilibrium state, τR , already discussed in Section 1.2.1 (and denoted there as τ ), and (ii) the characteristic time-scale of nucleation, τnucl . The characteristic time-scale of nucleation, we can identify with the time-lag in nucleation, τ , being equal – in one of its interpretations – to the time of establishment of steady-state conditions in nucleation. In other words, this is the time required in order to allow the first supercritical nuclei to be formed by homogeneous nucleation. According to Gutzow and Schmelzer [1, Eqs. (6.193)– (6.196)], the time-lag in homogeneous nucleation can be written frequently in the form (hom) τnucl ≅ constant τR jc2/3 ,
(1.9)
where jc is the number of particles in the critical cluster and the constant is frequently estimated for glass-forming melts as having values in the range of 102 –103 (cf. [1, 162] for details). In the derivation of the respective equations it is assumed that the Stokes-Einstein relation is fulfilled, i.e., that the effective diffusion coefficients governing crystal cluster formation and growth can be replaced by Newtonian viscosity. This is frequently assumed but not always the case. In addition, a linear relationship between viscosity and relaxation time is supposed to exist. At such assumptions, it follows that the characteristic relaxation time is much smaller than the characteristic time of nucleus formation. By this reason, first – at the mentioned conditions – relaxation to the respective metastable state occurs and afterwards (homogeneous) nucleation is followed. Densification (or, more generally, stabilization) of a glass or glass-forming melt has under such conditions as a rule to be expected to proceed prior to nucleation, at least, as far as the process proceeds via homogeneous nucleation. These considerations allow
Bereitgestellt von | Universitätsbibliothek Rostock Angemeldet |
[email protected] Heruntergeladen am | 26.05.14 13:00
1.4 Illumination of the Nucleation and Growth Mechanism
79
|
us – as it has been already done here earlier – to give a straightforward interpretation of some of the experimental results obtained. Under mentioned conditions, enthalpy relaxation has to proceed prior to nucleation (cf. Section 1.3.6). For heterogeneous nucleation, one can arrive at the estimate (cf. [1], Eq. (7.18)) (het) (hom) 1/3 = τnucl Φ τnucl
(1.10)
for the time-lag in heterogeneous nucleation. Here Φ is the activity of the heterogeneous nucleation core, defined via the factor Φ, Whet = Whom Φ,
(1.11)
by which the work of critical cluster formation in heterogeneous nucleation, Whet , is reduced as compared with the case of homogeneous nucleation, Whom . Consequently, indeed, if Φ is small, then heterogeneous nucleation may occur at the respective sites prior to relaxation. For heterogeneous nucleation, nucleation may proceed consequently under certain conditions prior to relaxation to the respective metastable equilibrium. In connection with elastic stresses in silicate and other classes of glass-forming systems, similar problems, i.e., the relation between relaxation and nucleation, are discussed in detail in [162]. There it is shown by similar considerations that for crystallization processes elastic stresses can be of importance only if diffusion and viscosity (or relaxation) are independent parameters and not coupled via the Stokes-Einstein relation. Earlier, a lot of work has been done by some us [1] in describing the effect of elastic stresses for segregation in multi-component solutions [1, 163, 164]. In such segregation processes, different diffusion coefficients of segregating particles and ambient phase units are involved. In case, the latter are much smaller than the first, elastic stresses may occur growing more rapidly than linear with the cluster volume. In an alternative case, realized, for example, in gas segregation in polymers [165], growth of bubbles may lead to a decrease of the viscosity of the polymer-gas solution due to a decrease of its concentration in it and, as a consequence, to a shift of the glass transition temperature respectively a termination of bubble growth (this is the basic mechanism employed in polymeric foam formation at BASF). In such cases, the growth of the clusters may be also terminated by elastic stresses. There exists some deep as it seems analogy of these phenomena to processes of formation of rigid amorphous structures (RAF) playing an important role in polymer crystallization. Elastic stresses do play an important role also in crystallization processes of different classes of glass-forming melts as discussed in detail in [1, 162]. Such behavior can be explained in classical terms only assuming that the characteristic relaxation times have to be again of similar order of magnitude or larger as compared to the characteristic times of nucleation. In order that elastic stresses may affect nucleation, critical clusters need to be formed in the presence of elastic stresses, i.e., critical clusters formation has to proceed at time-scales smaller than the characteristic relaxation time
Bereitgestellt von | Universitätsbibliothek Rostock Angemeldet |
[email protected] Heruntergeladen am | 26.05.14 13:00
80 | 1 Influence of Thermal Prehistory on Crystal Nucleation and Growth in Polymers of stresses. Under such conditions also the dependence of the properties of the ambient melt on prehistory has to be expected to be of significant importance for crystal nucleation and growth. In addition, also for low-molecular systems cluster properties may deviate from the properties of the newly evolving macroscopic phases and the scenario of phase evolution may differ from the classical picture [1] showing some analogy to the features of polymer crystallization as discussed in the present chapter. A further detailed study of these problems is considered, therefore, to be of considerable interest (cf. also Chapter 10).
1.5 Conclusions and Outlook Extensive research on the crystallization and nucleation of PCL, iPP, iPB-1 and PA 6 has demonstrated the enormous capabilities of chip-based fast scanning calorimetry as a new calorimetric technique. The starting amorphous melt and all intermediate stages of ordering to mesophases or crystals could be frozen for detailed subsequent analysis. It was shown that the classical model of crystal nucleation and growth developed on the basis of small motifs and a single viscosity term correcting for the slowing of molecular motion at lower temperatures must be modified to include the local as well as global mobility of polymer molecules. Based on this first insight, many additional experiments must be designed to collect specific, quantitative information on the time and temperature dependence of nucleation, ordering, molecular segregation, organization of the various levels of rigid-amorphous structures surrounding the ordered phase, annealing, and, finally, isotropization. Structures down to nanophase size can now be studied by assessing the changes in the heat capacity in the glass transition region which can test local molecular motion on a nanometer scale, as well as through the latent heat analysis on order/disorder transitions. The crystallization of the studied polymers could be connected by the following working hypothesis through the two basic stages. Stage 1: Homogeneous nucleation at a given temperature, Ta , is considered to be initiated as soon as a pertinent critical free-energy barrier can be overcome. The path of homogeneous nucleation may be clarified within the classical nomenclature. It starts with embryos which need increasing free energy for further growth in size and perfection. The embryo must move by fluctuation across the barrier of the critical nucleus, described as the saddle point in the size-and-perfection landscape of the freeenthalpy of formation. This leads to the supercritical nucleus which can grow with a thermodynamically permitted decrease in free enthalpy of formation. The actual rates of progress are additionally determined by kinetic factors which also are size and perfection dependent, creating a much more intricate, multidimensional free enthalpy landscape. In the past, only the rate of crossing the critical nucleus barrier was considered. It was described using the theory of absolute reaction rates which assumes the kinetics can be fitted with a single term similar in temperature dependence to the
Bereitgestellt von | Universitätsbibliothek Rostock Angemeldet |
[email protected] Heruntergeladen am | 26.05.14 13:00
1.5 Conclusions and Outlook
|
81
bulk viscosity. The molecular dynamics simulations should be able in the near future to supply more details about the complete path to a stable nucleus or small crystal (species with a zero or negative free enthalpy of formation). The analysis of Fig. 1.30 indicates that crystal growth and nucleation cannot be fitted with a single viscosity-related term which slows the process in parallel to the bulk glass-transition kinetics. Particularly the nucleation needs much faster, local viscosity terms as are known from dielectric and heat capacity measurements for largeamplitude molecular motion. On the other hand it is surprising that homogeneous nucleation does not start immediately after reaching an annealing temperature below Tg . For all studied polymers it was observed that first enthalpy relaxation (densification) towards the supercooled liquid state finalizes and then homogeneous nucleation occurs. One possible explanation for this observation may be the following: Enthalpy relaxation is considered to proceed via cooperative rearrangements on length scales typical for the α -relaxation. These length scales are of the order of nanometer, according to Donth 2–5 nm [153]. From the melting temperature of the small crystals a size of about 2–3 nm was estimated, Section 1.3.6.1 and [125]. For the critical nuclei the size is even smaller and they exist only temporarily. Therefore it seems possible that the cooperative rearrangements responsible for the enthalpy relaxation below Tg and occurring on a length scale of about 2–5 nm overturn the formation of overcritical nuclei which result from sporadic fluctuations. Only after reaching the local equilibrium for the cooperative rearrangements by approaching the supercooled liquid state the driving force for the rearrangements vanishes and overcritical nuclei may survive. Obviously this is not the case for annealing temperatures above the glass transition temperature. There nucleation starts without any enthalpy relaxation as shown in Fig. 1.54. Following nucleation, a growth of small to large crystals, depending on temperature, occurs as Stage 2: In the past, a new barrier to growth in the form of secondary or molecular nucleation was assumed [23]. The molecular nucleation was thought to introduce the molecular segregation on crystallization [21, 22]. The new data give a hint that the segregation may already occur before or in Stage 1. Further growth of the initial crystals at Ta is hindered by the slow, long-range diffusion, leading ultimately to a sufficient amount of RAF with a higher glass transition temperature to stop all further growth. The melting of crystals retains nuclei that can enhance cold crystallization for low melting temperatures. For high melting temperatures such nucleus retention has in the past been called self-nucleation and the nuclei were found to survive at heating above the equilibrium melting temperature. To study the activity of these self-nuclei cooling was necessary to temperatures that permit crystallization. This research has, thus, opened a new direction of inquiry to gather quantitative information about nucleation and growth of polymer crystals as it affects the amorphous and crystalline phases and their interrelationship. The observation of missing cold crystallization for samples annealed at higher temperatures sheds some light on the two different stages of nucleation in PCL recently
Bereitgestellt von | Universitätsbibliothek Rostock Angemeldet |
[email protected] Heruntergeladen am | 26.05.14 13:00
82 | 1 Influence of Thermal Prehistory on Crystal Nucleation and Growth in Polymers discovered [14]. Looking at Fig. 1.37, one notes that the three crystallization conditions chosen in the display start with the same amorphous glass, characterized at the shortest annealing times by the same glass transition (temperature and width). Next, (at least) two largely different ordering processes are obvious. At low annealing temperature (202 K) poorly ordered species grow first (nuclei and small crystals), both being able to lead to cold crystallization during the analysis by heating with 1.8 ⋅ 104 Ks−1 . At higher annealing temperatures (252 and 272 K) no cold crystallization is detected during the analysis. The devitrification of the partially ordered samples is also different after the annealing at various temperatures. In all cases the ordering is connected with an increase in glass transition temperature and its width. While at 202 K, the increase in glass transition temperature at longer annealing times goes parallel with the initial ordering (judged by the low-temperature endotherm) and beyond 1.0 s exceeds the annealing temperature, at 252 and 272 K the melting endotherms of the 1.0 s curves begin at the upper end of the glass transition (the Tg of the RAF close to the annealing temperature). Increasing the annealing times increases the Tg of the RAF, but less than at the 202 K annealing temperature. Finally, for all three annealing temperatures, the 0.1 s annealing time curve represents a unique separation between the (at least) two processes. Comparing the the curves (green in the color version) after 0.1 s annealing in Fig. 1.37 yields for all annealing temperatures different observable effects. At 202 K, the lowest annealing temperature, the crystallinity is close to zero as seen from the zero overall enthalpy change on heating and the heat capacity throughout the glass transition. Nevertheless, a large number of nuclei is active in the temperature range between 230 K and 270 K, causing a strong cold-crystallization peak (exotherm). After annealing for 0.1 s at 272 K, the highest annealing temperature, only a small endothermic enthalpy change is observed, indicating a few percent crystallinity grown before heating of the sample, but there is practically no corresponding cold-crystallization seen before the final melting. The nuclei and crystals formed at longer times at 272 K are not able to initiate cold-crystallization. One may argue that this is due to a mismatch between the thickness of the crystalline lamellae or the size of the nuclei formed at 272 K and the size of the crystals growing around 250 K. To check this, annealing was performed at 252 K, the temperature close to the maximum cold-crystallization rate seen for the sample annealed at 202 K. Crystals grown under this annealing condition should meet the growth condition, particularly with respect to the lamellar thickness, for further cold-crystallization in the same temperature range. But as seen from the pronounced melting peak in Fig. 1.37b a significant amount of crystals was present after annealing for 0.1 s at 252 K but by direct crystallization (followed by possible crystal perfection during the heating for analysis) without any major prior cold crystallization. This result is surprising because classical crystallization theories would predict a further growth of supercritical nuclei and metastable crystals present in the quite mobile polymer melt as follows from the pronounced step in the heat capacity at the glass transition. Summarizing,
Bereitgestellt von | Universitätsbibliothek Rostock Angemeldet |
[email protected] Heruntergeladen am | 26.05.14 13:00
1.5 Conclusions and Outlook
| 83
there are nuclei and crystals with the right size for further growth present in the melt and only a minor RAF, if any, is present. Obviously another mechanism than a size mismatch must prevent further growth. This result is somehow similar to the observation that stable seed crystals in a saturated polymer solution do not act as nuclei for further growth as shown already by Wunderlich [166]. Looking carefully at the curves for 0.1 s and 0.01 s annealing times (green and red, respectively, in the color version) in Fig. 1.37a and comparing them to the curves for the longer annealed samples, one can identify tiny endothermic peaks at approximately 220 K. The crystalline objects formed at 202 K seem to cause even after melting a remaining not fully relaxed melt which begins immediately thereafter with cold crystallization, although the exotherm of the curve representing 0.01 s annealing time (red in the color version) barely exceeds the error limit. The situation after annealing at higher temperatures is different. After annealing for 1 s or longer at 252 K a significant amount of crystals is formed. These crystals are not molten before passing through the cold-crystallization range and do not cause further crystal growth. In the amorphous part therefore no measurable amounts of poorly ordered, low-melting structures are present and the high level of the heat capacity shows that practically all amorphous material is mobile and able to crystallize. Only annealing below the coldcrystallization temperature range leads to an acceleration of cold crystallization and indicates enhanced nucleation. Annealing at higher temperatures yields more perfect ordered structures which do not act as nuclei on heating at 1.8 ⋅ 104 Ks−1 . The needed molecular nucleation seems to be supported only by mobile melts, as are generated after the low-temperature melting endotherm, seen in Fig. 1.37a. Comparing the heat capacities in the glass transition regions in Fig. 1.37a–c, indicates that, both, the growth of the poorly ordered, low melting structures in Fig. 1.37a as well as the better ordered, higher melting structures in Fig. 1.37b and c, shift and broaden the glass transitions up to the beginning of melting, i.e., generate a rigid amorphous fraction, RAF, that keeps the melt rigid [38, 167]. Note the terms mobile and rigid melts must be considered in reference to the chosen cooling and heating rates in the experiments in addition to the annealing temperatures and times. With the disordering of the small ordered structures, the RAF disappears and does not retard cold crystallization, as it was observed in other cases [142]. The annealing experiments and subsequently collected DFSC heating curves lead to the unexpected though clearly evidenced conclusion that annealing of fully amorphous polymer samples below the glass transition temperature allows formation of homogeneous nuclei and ordered structures with latent heat, often mesophases in polyolefines [127, 143, 168–170] but also in polyamides [42, 43, 171] and other polymers [172]. Disordering of the mesophase formed below the glass transition temperature occurs on devitrification of the glass as has been detected by an endothermic peak, denoted as disordering. Subsequent to the disordering of the ordered domains, cold crystallization has been observed which, in amount, is proportional to the fraction
Bereitgestellt von | Universitätsbibliothek Rostock Angemeldet |
[email protected] Heruntergeladen am | 26.05.14 13:00
84 | 1 Influence of Thermal Prehistory on Crystal Nucleation and Growth in Polymers of previously disordered structures. This leads to the conclusion that self-nuclei after disordering were left, permitting/accelerating cold ordering on continued heating. The nucleation and growth of small mesophase particles of perhaps sub-nanometer size in the glass of most polymers suggests that cooperative, large-amplitude mobility of unrestraint molecule segments is not a requirement for partial ordering of macromolecules, as is commonly assumed; non-cooperative local mobility of chain segments is sufficient to form ordered structures. Modeling of the rate of nucleation and crystallization has in the past been performed using the well-known Turnbull-Fisher equation. It includes an estimation of the free enthalpy of activation of transport processes/diffusion of molecular segments at the boundary between ordered and non-ordered phases by the WLF equation [139, 173]. Since the WLF equation typically is applied for quantification of the viscosity of liquids only, obviously, prediction of ordering processes below the glass transition temperature is impossible. For this reason, the data of the present work strongly suggest that the classical nucleation and crystallization theories for polymers need modification from point-of-view of correction the restriction of nucleation and growth of ordered phases to temperatures between the equilibrium melting temperature and the glass transition temperature. This important conclusion is in accord with a number of recently published studies of homogeneous nucleation and crystallization of polymers in the glassy state, pointing to universality/generality of this observation. Quantitative analysis allowed us to judge the nucleation efficiency of carbon nanotubes in PCL in the whole range of temperatures, where PCL crystallizes. Though highly nucleated samples show two orders of magnitude faster crystallization in the region of heterogeneous nucleation (small under-cooling, high temperatures), the homogeneous nucleation dominates at low temperatures, making crystallization rate at this region independent of the nucleating agent content. Even for the highest MWCNT loadings (up to 5 wt%) homogeneous nucleation is significantly more effective than the heterogeneities as seen from the shift in the cold-crystallization peak towards lower temperatures. This information is not available from non-isothermal experiments but requires isothermal treatments after very fast cooling where nucleation on cooling was prevented. Differential fast scanning calorimetry (DFSC), a new powerful tool for the investigation of nucleation and crystallization in polymers enables us to study homogeneous nucleation in materials crystallizing relatively fast. Beside the observed nucleation and growth below the glass transition in polymers information about the nucleation activity of small crystals grown at different temperatures relative to the coldcrystallization temperature range were obtained. As a next step stability of the nuclei at further heating will be studied (Tammann’s development method [45]). Fast scanning calorimetry allows us to vary the heating rate going from the nucleation temperature to the development temperature in a wide range of heating rates covering at least 7 orders of magnitude. The advantage of the new technique is the wide temperaturetime range covering the kinetics of industrially important semi-crystalline polymers.
Bereitgestellt von | Universitätsbibliothek Rostock Angemeldet |
[email protected] Heruntergeladen am | 26.05.14 13:00
Bibliography
| 85
The ultra-fast cooling ability of the DFSC allows one an investigation of crystal nucleation and growth on time scales starting from 1 millisecond. Thus, previously unavailable temperatures of homogeneous and heterogeneously enhanced crystallization of fast crystallizing polymers became accessible and more interesting results are expected in near future. Acknowledgement: A. W. and R. A. acknowledge support from the German Science Foundation (DFG SCHI331/21-1 and DFG AN212-8, -9, -12, respectively) and E. Z. from a European Union funded Marie Curie EST fellowship (ADVATEC).
Bibliography [1]
[2] [3] [4] [5] [6]
[7]
[8] [9] [10] [11] [12]
[13] [14]
I. Gutzow and J.W.P. Schmelzer, The Vitreous State: Thermodynamics, Structure, Rheology, and Crystallization (First Edition, Springer, Berlin, 1995; Second enlarged edition, Springer, Heidelberg, 2013). V.M. Fokin, E.D. Zanotto, and J.W.P. Schmelzer, Homogeneous nucleation versus glass transition temperature of silicate glasses, Journal Non-Crystalline Solids 321, 52 (2003). H.N. Ritland, Density Phenomena in the Transformation Range of a Borosilicate Crown Glass, J. American Ceramic Society 37, 370 (1954). G.M. Bartenev, On the Relation between the Glass Transition Temperature of Silicate Glass and Rate of Cooling or Heating, Doklady Akademii Nauk SSSR 76, 227 (1951). J.W.P. Schmelzer and I.S. Gutzow, Glasses and the Glass Transition (WILEY, Berlin-Weinheim, 2011). J. Schmelzer, W.P., and C. Schick, Dependence of crystallization processes of glass-forming melts on melt history: a theoretical approach to a quantitative treatment, Physics and Chemistry of Glasses – European Journal of Glass Science and Technology Part B 53, 99 (2012). I. Gutzow, J.W.P. Schmelzer, and S. Todorova, Frozen-in fluctuations, immiscibility and crystallisation in oxidee melts and the structural and thermodynamic nature of glasses, Physics and Chemistry of Glasses – European Journal of Glass Science and Technology Part B 49, 136 (2008). J. Deubener, Structural aspects of volume nucleation in silicate glasses, J. Non-Crystalline Solids 351, 1500 (2005). E. Zhuravlev, and C. Schick, Fast scanning power compensated differential scanning nanocalorimeter: 1. The device, Thermochim. Acta 505, 1 (2010). A.A. Minakov, and C. Schick, Ultrafast thermal processing and nanocalorimetry at heating and cooling rates up to 1 MKs−1 , Rev. Sci. Instr. 78, 073902 (2007). D.A. Ivanov, in Polymer Science: A Comprehensive Reference, Editors-in-Chief: M. Krzysztof and M. Martin (Elsevier, Amsterdam, 2012, pp. 227). C.K. Ober, S.Z.D. Cheng, P.T. Hammond, M. Muthukumar, E. Reichmanis, K.L. Wooley, and T.P. Lodge, Research in Macromolecular Science: Challenges and Opportunities for the Next Decade, Macromolecules 42, 465 (2009). M. Muthukumar, in Progress in Understanding of Polymer Crystallization, edited by G. Reiter, and G. Strobl (Springer Berlin, Heidelberg, 2007, pp. 1). H. Janeschitz-Kriegl, Some remarks on flow induced crystallization in polymer melts, Journal of Rheology 57, 1057 (2013).
Bereitgestellt von | Universitätsbibliothek Rostock Angemeldet |
[email protected] Heruntergeladen am | 26.05.14 13:00
86 | 1 Influence of Thermal Prehistory on Crystal Nucleation and Growth in Polymers [15] [16] [17] [18] [19] [20] [21] [22] [23] [24] [25] [26] [27] [28]
[29] [30]
[31]
[32]
[33] [34]
[35] [36]
C. Luo and J.-U. Sommer, Disentanglement of Linear Polymer Chains Toward Unentangled Crystals, ACS Macro Letters 2, 31 (2012). E. Piorkowska and G.C.R. (Eds.), in Handbook of Polymer Crystallization (John Wiley & Sons, Inc., 2013, pp. 1). G. Strobl, Colloquium: Laws controlling crystallization and melting in bulk polymers, Rev. Mod. Phys. 81, 1287 (2009). G. Strobl, Crystallization and melting of bulk polymers: New observations, conclusions and a thermodynamic scheme, Progress in Polymer Science 31, 398 (2006). M. Muthukumar, Modeling Polymer Crystallization, Advances in Polymer Science 191, 241 (2005). P.D. Olmsted, W.C.K. Poon, T.C.B. McLeish, N.J. Terrill, and A.J. Ryan, Spinodal-Assisted Crystallization in Polymer Melts, Phys. Rev. Lett. 81, 373 (1998). A. Mehta and B. Wunderlich, A study of molecular fractionation during the crystallization polymers, Colloid & Polymer Science 253, 193 (1975). B. Wunderlich and A. Mehta, Macromolecular nucleation, J. Polymer Science. B: Polymer Physics Edition 12, 255 (1974). B. Wunderlich, Macromolecular Physics, Vols. 1–3 (Academic Press, New York, 1973, 1976, and 1980, resp.), Vol. 1, Crystal structure, Morphology, Defects. H.J.D. Lauritzen Jr., Theory of formation of polymer crystals with folded chains in dilute solution, Journal of Research of the National Bureau of Standards 64a, 73 (1960). T. Yamamoto, Computer Modeling of Polymer Crystallization-Toward Computer-Assisted Materials Design, Polymer 50, 1975 (2009). W. Hu and D. Frenkel, Polymer Crystallization Driven by Anisotropic Interactions, Advances in Polymer Science 191, 1 (2005). C. Luo and J.-U. Sommer, Coexistence of Melting and Growth during Heating of a Semicrystalline Polymer, Phys. Rev. Lett. 102, 147801 (2009). J.U. Sommer and C. Luo, Molecular dynamics simulations of semicrystalline polymers: Crystallization, melting, and reorganization, Journal of Polymer Science Part B: Polymer Physics 48, 2222 (2010). C. Luo and J.-U. Sommer, Growth Pathway and Precursor States in Single Lamellar Crystallization: MD Simulations, Macromolecules 44, 1523 (2011). L.H. Allen, G. Ramanath, S.L. Lai, Z. Ma, S. Lee, D.D.J. Allman, and K.P. Fuchs, 1000 000 C/S thin film electrical heater: In situ resistivity measurements of Al and Ti/Si thin films during ultra rapid thermal annealing, Applied Physics Letters 64, 417 (1994). R.T. Tol, A.A. Minakov, S.A. Adamovsky, V.B.F. Mathot, and C. Schick, Metastability of polymer crystallites formed at low temperature studied by Ultra fast calorimetry: Polyamide 6 confined in sub-micrometer droplets vs bulk PA 6, Polymer 47, 2172 (2006). J. Ibarretxe, G. Groeninckx, L. Bremer, and V.B.F. Mathot, Quantitative evaluation of fractionated and homogeneous nucleation of polydisperse distributions of water-dispersed maleic anhydride-grafted-polypropylene micro- and nano-sized droplets, Polymer 50, 4584 (2009). D. Turnbull, Correlation of Liquid-Solid Interfacial Energies Calculated from Supercooling of Small Droplets, J. Chemical Physics 18, 769 (1950). L. Kailas, C. Vasilev, J.N. Audinot, H.N. Migeon, and J.K. Hobbs, A Real-Time Study of Homogeneous Nucleation, Growth, and Phase Transformations in Nanodroplets of Low Molecular Weight Isotactic Polypropylene Using AFM, Macromolecules 40, 7223 (2007). J. Carvalho and K. Dalnoki-Veress, Surface nucleation in the crystallisation of polyethylene droplets, The European Physical Journal E: Soft Matter and Biological Physics 34, 1 (2011). E. Zhuravlev and C. Schick, Fast scanning power compensated differential scanning nanocalorimeter: 2. Heat capacity analysis, Thermochim. Acta 505, 14 (2010).
Bereitgestellt von | Universitätsbibliothek Rostock Angemeldet |
[email protected] Heruntergeladen am | 26.05.14 13:00
Bibliography
[37] [38] [39] [40] [41] [42] [43] [44] [45] [46] [47]
[48]
[49] [50] [51] [52]
[53] [54] [55]
[56]
[57] [58]
| 87
B. Wunderlich, The ATHAS database on heat capacities of polymers see on WWW URL: http://www.springermaterials.com/docs/athas.html, Pure and Appl. Chem. 67, 1019 (1995). E. Zhuravlev, J.W.P. Schmelzer, B. Wunderlich, and C. Schick, Kinetics of nucleation and crystallization in poly(ε -caprolactone) (PCL) Polymer 52, 1983 (2011). A. Wurm, R. Soliman, and C. Schick, Early Stages of Polymer Crystallization – A Dielectric Stud, Polymer 44, 7467 (2003). S. Adamovsky and C. Schick, Ultra-fast isothermal calorimetry using thin film sensors, Thermochim. Acta 415, 1 (2004). Q. Zia, H.-J. Radusch, and R. Androsch, Deformation behavior of isotactic polypropylene crystallized via a mesophase, Polym. Bull. 63, 755 (2009). D. Mileva, R. Androsch, E. Zhuravlev, and C. Schick, Morphology of mesophase and crystals of polyamide 6 prepared in a fast scanning chip calorimeter, Polymer 53, 3994 (2012). A. Mollova, R. Androsch, D. Mileva, C. Schick, and A. Benhamida, Effect of Supercooling on Crystallization of Polyamide 11, Macromolecules 46, 828 (2013). D. Mileva, R. Androsch, and H.J. Radusch, Effect of structure on light transmission in isotactic polypropylene and random propylene-1-butene copolymers, Polymer Bulletin 62, 561 (2009). G. Tammann, Number of nuclei in supercooled liquids, Zeitschrift für Physikalische Chemie 25, 441 (1898). B. Wunderlich and A. Mehta, The Nucleation of Polyethylene Dendrites from Solution, Journal of Materials Science 5, 248 (1970). M. SalmeronSanchez, V.B.F. Mathot, G. VandenPoel, and J.L. GomezRibelles, Effect of the Cooling Rate on the Nucleation Kinetics of Poly(L-Lactic Acid) and Its Influence on Morphology, Macromolecules 40, 7989 (2007). T. Hikima, Y. Adachi, M. Hanaya, and M. Oguni, Determination of potentially homogeneous nucleation based crystallization in o-terphenyl and an interpretation of the nucleation enhancement mechanism, Phys. Rev. B 52, 3900 (1995). S. Vyazovkin and I. Dranca, Effect of physical aging on nucleation of amorphous indomethacin, Journal of Physical Chemistry B 111, 7283 (2007). C.A. Angell, Structural instability and relaxation in liquid and glassy phases near the fragile liquid limit, J. Non-Crystalline Solids 102, 205 (1988). R.K. Kadiyala and C.A. Angell, Separation of nucleation from crystallization kinetics by two step calorimetry experiments, Colloids and Surfaces 11, 341 (1984). V.M. Fokin, A.A. Cabral, R.M.C.V. Reis, M.L.F. Nascimento, and E.D. Zanotto, Critical assessment of DTA-DSC methods for the study of nucleation kinetics in glasses, J. Non-Crystalline Solids 356, 358 (2010). A. Marotta, S. Saiello, F. Branda, and A. Buri, Nucleation and Crystal Growth in NA2 O ⋅ 2CAO ⋅ 3SIO2 Glass – A DTA Study, Thermochim. Acta 46, 123 (1981). S.A. Adamovsky, A.A. Minakov, and C. Schick, Scanning microcalorimetry at high cooling rate, Thermochim. Acta 403, 55 (2003). M.F.J. Pijpers, V.B.F. Mathot, B. Goderis, R. Scherrenberg, and E. van der Vegte, High-speed calorimetry for the analysis of kinetics of vitrification, crystallization and melting of macromolecule, Macromolecules, 35, 3601 (2002). PerkinElmer_Inc., Technical Specifications Thermal Analysis for the DSC 8000/8500 Differential Scanning Calorimeters http://las.perkinelmer.com/content/RelatedMaterials/Specification Sheets/SPC_8000and8500.pdf, (2009). N.E. Hager, Thin heater calorimeter, Rev. Sci. Instrum. 35, 618 (1964). M.Y. Efremov, E.A. Olson, M. Zhang, F. Schiettekatte, Z. Zhang, and L.H. Allen, Ultrasensitive, fast, thin-film differential scanning calorimeter, Rev. Sci. Instrum. 75, 179 (2004).
Bereitgestellt von | Universitätsbibliothek Rostock Angemeldet |
[email protected] Heruntergeladen am | 26.05.14 13:00
88 | 1 Influence of Thermal Prehistory on Crystal Nucleation and Growth in Polymers [59]
[60]
[61] [62]
[63]
[64] [65]
[66] [67]
[68] [69] [70]
[71]
[72]
[73] [74] [75] [76] [77]
M.Y. Efremov, E.A. Olson, M. Zhang, Z. Zhang, and L.H. Allen, Probing Glass Transition of Ultrathin Polymer Films at a Time Scale of Seconds Using Fast Differential Scanning Calorimetry, Macromolecules 37, 4607 (2004). M. Chonde, M. Brindza, and V. Sadtchenkoa, Glass transition in pure and doped amorphous solid water: An ultrafast microcalorimetry study, Journal of Chemical Physics 125, 09501 (2006). E. León-Gutierrez, G. Garcia, M.T. Clavaguera-Mora, and J. Rodríguez-Viejo, Glass transition in vapor deposited thin films of toluene, Thermochim. Acta 492, 51 (2009). S.A. McCartney and V. Sadtchenko, Fast scanning calorimetry studies of the glass transition in doped amorphous solid water: Evidence for the existence of a unique vicinal phase, J. Chemical Physics 138, 084501 (2013). A. Sepulveda, E. Leon-Gutierrez, M. Gonzalez-Silveira, C. Rodriguez-Tinoco, M.T. ClavagueraMora, and J. Rodriguez-Viejo, Glass transition in ultrathin films of amorphous solid water, The Journal of Chemical Physics 137, 244506 (2012). D. Bhattacharya, C.N. Payne, and V. Sadtchenko, Bulk and Interfacial Glass Transitions of Water, J. Physical Chemistry A 115, 5965 (2011). A. Sepúlveda, E. Leon-Gutierrez, M. Gonzalez-Silveira, M.T. Clavaguera-Mora, and J. Rodríguez-Viejo, Anomalous Transformation of Vapor-Deposited Highly Stable Glasses of Toluene into Mixed Glassy States by Annealing Above Tg, J. Physical Chemistry Letters 3, 919 (2012). A.A. Minakov, S.A. Adamovsky, and C. Schick, Non adiabatic thin-film (chip) nanocalorimetry, Thermochim. Acta 432, 177 (2005). A.A. Minakov, A.W. van Herwaarden, W. Wien, A. Wurm, and C. Schick, Advanced nonadiabatic ultrafast nanocalorimetry and superheating phenomenon in linear polymers, Thermochim. Acta 461, 96 (2007). A.W. van Herwaarden, Overview of calorimeter chips for various applications, Thermochim. Acta 432, 192 (2005). A.A. Minakov, D.A. Mordvintsev, and C. Schick, Melting and Reorganization of Poly(ethylene Terephthalate) on Fast Heating (1000 Ks−1 ), Polymer 45, 3755 (2004). A.A. Minakov, D.A. Mordvintsev, and C. Schick, Isothermal reorganization of poly(ethylene terephthalate) revealed by fast calorimetry (1000 Ks−1 ; 5 ms), Faraday Discuss. 128, 261 (2005). A.A. Minakov, D.A. Mordvintsev, R. Tol, and C. Schick, Melting and reorganization of the crystalline fraction and relaxation of the rigid amorphous fraction of isotactic polystyrene on fast heating (3 ⋅ 104 K/min), Thermochim. Acta 442, 25 (2006). A. Gradys, P. Sajkiewicz, A.A. Minakov, S. Adamovsky, C. Schick, T. Hashimoto, and K. Saijo, Crystallization of polypropylene at various cooling rates, Mater. Sci. Eng. A 413–414, 442 (2005). A. Gradys, P. Sajkiewicz, S. Adamovsky, A. Minakov, and C. Schick, Crystallization of poly(vinylidene fluoride) during ultra-fast cooling, Thermochim. Acta 461, 153 (2007). F. De Santis, S. Adamovsky, G. Titomanlio, and C. Schick, Scanning nanocalorimetry at high cooling rate of isotactic polypropylene, Macromolecules 39, 2562 (2006). F. De Santis, S. Adamovsky, G. Titomanlio, and C. Schick, Isothermal nanocalorimetry of isotactic polypropylene, Macromolecules 40, 9026 (2007). V.V. Ray, A.K. Banthia, and C. Schick, Fast isothermal calorimetry of modified polypropylene clay nanocomposites, Polymer 48, 2404 (2007). A. Krumme, A. Lehtinen, S. Adamovsky, C. Schick, J. Roots, and A. Viikna, Crystallization behavior of some unimodal and bimodal linear low-density polyethylenes at moderate and high supercooling, Journal of Polymer Science Part B: Polymer Physics 46, 1577 (2008).
Bereitgestellt von | Universitätsbibliothek Rostock Angemeldet |
[email protected] Heruntergeladen am | 26.05.14 13:00
Bibliography
[78]
[79] [80]
[81] [82]
[83] [84] [85] [86]
[87] [88] [89] [90] [91] [92] [93]
[94]
[95]
[96]
|
89
C. Silvestre, S. Cimmino, D. Duraccio, and C. Schick, Isothermal Crystallization of Isotactic Poly(propylene) Studied by Superfast Calorimetry, Macromolecular Rapid Communications 28, 875 (2007). C. Schick, Differential scanning calorimetry (DSC) of semicrystalline polymers, Analytical and Bioanalytical Chemistry, 1 (2009). M. Pyda, E. Nowak-Pyda, J. Heeg, H. Huth, A.A. Minakov, M.L.Di Lorenzo, C. Schick, and B. Wunderlich, Melting and Crystallization of Poly(butylene Terephthalate) by Temperaturemodulated and Superfast Calorimetry, Journal of Polymer Science. B: Polymer Physics 44, 1364 (2006). A. Minakov, A. Wurm, and C. Schick, Superheating in linear polymers studied by ultrafast nanocalorimetry, Eur. Phys. J. E Soft Matter 23, 43 (2007). V. Brucato, S. Piccarolo, and V. La Carrubba, An experimental methodology to study polymer crystallization under processing conditions. The influence of high cooling rates, Chem. Eng. Sci. 57, 4129 (2002). H. Janeschitz-Kriegl, Crystallization Modalities in Polymer Melt Processing, Fundamental Aspects of Structure Formation (Springer, Wien, New York, 2010). W. Chen, D. Zhou, G. Xue, and C. Schick, Chip calorimetry for fast cooling and thin films: a review, Front. Chem. China 4, 229 (2009). A.F. Lopeandia, J. Valenzuela, and J. Rodríguez-Viejo, Power compensated thin film calorimetry at fast heating rates, Sensors and Actuators A: Physical 143, 256 (2008). T. Naiki, H. Sugiyama, R. Tashiro, and T. Karino, Flow-dependent concentration polarization of plasma proteins at the luminal surface of a cultured endothelial cell monolayer, Biorheology 36, 225 (1999). M. Merzlyakov, Method of Rapid (105 Ks−1 ) Controlled Cooling and Heating of Thin Samples, Thermochim. Acta 442, 52 (2006). M.J. O’Neill, The analysis of a temperature-controlled scanning calorimeter, Anal. Chem. 36, 1238 (1964). M.J. O’Neill, Measurement of Specific Heat Functions by Differential Scanning Calorimetry, Anal. Chem. 38, 1331 (1966). E.S. Watson, M.O. O’Neill, J. Justin, and N. Brenner, A differential scanning calorimeter for quantitative differential thermal analysis, Anal. Chem. 36, 1233 (1964). E.S. Watson, and M.J. O’Neill, (The Perkin-Elmer Corporation, Norwalk, Conn., 1966). S. van Herwaardena, Micro-sensors for Analysis Equipment: Research and Innovation, Procedia Engineering 5, 464 (2010). G. Poel, D. Istrate, A. Magon, and V. Mathot, Performance and calibration of the Flash DSC 1, a new, MEMS-based fast scanning calorimeter, Journal of Thermal Analysis and Calorimetry 110, 1533 (2012). S. van Herwaarden, E. Iervolino, F. van Herwaarden, T. Wijffels, A. Leenaers, and V. Mathot, Design, performance and analysis of thermal lag of the UFS1 twin-calorimeter chip for fast scanning calorimetry using the Mettler-Toledo Flash DSC 1, Thermochim. Acta 522, 46 (2011). V. Mathot, M. Pyda, T. Pijpers, G. Vanden Poel, E. van de Kerkhof, S. van Herwaarden, F. van Herwaarden, and A. Leenaers, The Flash DSC 1, a power compensation twin-type, chip-based fast scanning calorimeter (FSC): First findings on polymers, Thermochim. Acta 522, 36 (2011). E. Iervolino, A.W. van Herwaarden, F.G. van Herwaarden, E. van de Kerkhof, P.P.W. van Grinsven, A.C.H.I. Leenaers, V.B.F. Mathot, and P.M. Sarro, Temperature calibration and electrical characterization of the differential scanning calorimeter chip UFS1 for the Mettler-Toledo Flash DSC 1, Thermochim. Acta 522, 53 (2011).
Bereitgestellt von | Universitätsbibliothek Rostock Angemeldet |
[email protected] Heruntergeladen am | 26.05.14 13:00
90 | 1 Influence of Thermal Prehistory on Crystal Nucleation and Growth in Polymers [97]
[98]
[99]
[100]
[101] [102] [103] [104]
[105]
[106] [107] [108]
[109] [110] [111] [112] [113] [114]
[115]
[116]
G.V. Poel, A. Sargsyan, V. Mathot, G.V. Assche, A. Wurm, C. Schick, A. Krumme, and D. Zhou, Recommendation for Temperature Calibration of Fast Scanning Calorimeters (FsCs) for Sample Mass and Scan Rate (Beuth Verlag GmbH, Berlin, 2011). A. Wurm, D. Lellinger, A.A. Minakov, T. Skipa, P. Pötschke, I. Alig, and C. Schick, Crystallization of poly(ε -caprolactone)/MWCNT composites: A combined SAXS/WAXS, electrical and thermal conductivity study, Polymer, submitted for publication. E. Zhuravlev, P. Pötschke, R. Androsch, J.W.P. Schmelzer, and C. Schick, Kinetics of nucleation and crystallization of poly(ε -caprolactone) – multiwalled carbon nanotube composites, European Polymer Journal, submitted for publication. I. Stolte, R. Androsch, M.L. Di Lorenzo, and C. Schick, Effect of Aging the Glass of Isotactic Polybutene-1 on Form II Nucleation and Cold Crystallization, The Journal of Physical Chemistry B 117, 15196 (2013). Product information available at https://polymers.lyondellbasell.com. F. Paladi, and M. Oguni, Generation and extinction of crystal nuclei in extremely nonequilibrium glassy state of salol, Journal of Physics: Condensed Matter 15, 3909 (2003). F. Paladi, and M. Oguni, Anomalous generation and extinction of crystal nuclei in nonequilibrium supercooled liquid o-benzylphenol, Phys. Rev. B 65, 144202 (2002). T. Hikima, M. Hanaya, and M. Oguni, Microscopic observation of a peculiar crystallization in the glass transition region and beta-process as potentially controlling the growth rate in triphenylethylene, Journal of Molecular Structure 479, 245 (1999). T. Hikima, N. Okamoto, M. Hanaya, and M. Oguni, Calorimetric study of triphenylethene: observation of homogeneous-nucleation-based crystallization, Journal of Chemical Thermodynamics 30, 509 (1998). N. Okamoto, M. Oguni, and Y. Sagawa, Generation and extinction of a crystal nucleus below the glass transition temperature, Journal of Physics: Condensed Matter 9, 9187 (1997). N. Okamoto and M. Oguni, Discovery of crystal nucleation proceeding much below the glass transition temperature in a supercooled liquid, Solid State Communications 99, 53 (1996). T. Hikima, M. Hanaya, and M. Oguni, Discovery of a potentially homogeneous-nucleationbased crystallization around the glass transition temperature in salol, Solid State Communications 93, 713 (1995). G.S.Y. Yeh and P.H. Geil, Crystallization of polyethylene terephthalate from the glassy amorphous state, J. Macromol. Sci. (Phys.) B1, 235 (1967). W. Frank, H. Goddar, and H.A. Stuart, Electron microscopic investigations on amorphous polycarbonate, Journal of Polymer Science Part B: Polymer Letters 5, 711 (1967). D.M. Gezovich, and P.H. Geil, Morphology of quenched polypropylene, Polymer Engineering & Science 8, 202 (1968). Q. Zia, E. Ingoli˘c, and R. Androsch, Surface and bulk morphology of cold-crystallized poly(ethylene terephthalate), Colloid & Polymer Science 288, 819 (2010). V.B.F. Mathot, Calorimetry and Thermal Analysis of Polymers (Hanser Publishers, München, 1994). J. Jiang, E. Zhuravlev, Z. Huang, L. Wei, Q. Xu, M. Shan, G. Xue, D. Zhou, C. Schick, and W. Jiang, A transient polymorph transition of 4-cyano-4 -octyloxybiphenyl (8OCB) revealed by ultrafast differential scanning calorimetry (UFDSC), Soft Matter 9, 1488 (2013). M. Chen, M. Du, J. Jiang, D. Li, W. Jiang, E. Zhuravlev, D. Zhou, C. Schick, and G. Xue, Verifying the symmetry of ultra-fast scanning calorimeters using liquid crystal secondary temperature standards, Thermochim. Acta 526, 58 (2011). S.M. Sarge, G.W.H. Hohne, H.K. Cammenga, W. Eysel, and E. Gmelin, Temperature, heat and heat-flow rate calibration of scanning calorimeters in the cooling mode, Thermochim. Acta 361, 1 (2000).
Bereitgestellt von | Universitätsbibliothek Rostock Angemeldet |
[email protected] Heruntergeladen am | 26.05.14 13:00
Bibliography
|
91
[117] S. Neuenfeld, and C. Schick, Verifying the symmetry of differential scanning calorimeters concerning heating and cooling using liquid crystal secondary temperature standards, Thermochim. Acta 446, 55 (2006). [118] C. Schick, U. Jonsson, T. Vassilev, A. Minakov, J. Schawe, R. Scherrenberg, and D. Lörinczy, Applicability of 8OCB for temperature calibration of temperature modulated calorimeters, Thermochim. Acta 347, 53 (2000). [119] G.W.H. Hohne, J. Schawe, and C. Schick, Temperature calibration on cooling using liquid crystal phase transitions, Thermochim. Acta 221, 129 (1993). [120] O.D. Lavrentovich, M. Kleman, and V.M. Pergamenshchik, Nucleation of Focal Conic Domains in Smectic-A Liquid Crystals, J. Phys. II 4, 377 (1994). [121] S.H. Lee, Y.W. Jung, and R. Agarwal, Size-Dependent Surface-Induced Heterogeneous Nucleation Driven Phase-Change in Ge2Sb2Te5 Nanowires, Nano Lett. 8, 3303 (2008). [122] Y. Diao, A.S. Myerson, T.A. Hatton, and B.L. Trout, Surface Design for Controlled Crystallization: The Role of Surface Chemistry and Nanoscale Pores in Heterogeneous Nucleation, Langmuir 27, 5324 (2011). [123] J. Russo, and H. Tanaka, Selection mechanism of polymorphs in the crystal nucleation of the Gaussian core model, Soft Matter 8, 4206 (2012). [124] K. Konnecke, Crystallization of Poly(Aryl Ether Ketones), 1. Crystallization Kinetics, J. Macromol. Sci.-Phys. B33, 37 (1994). [125] A. Wurm, E. Zhuravlev, K. Eckstein, D. Jehnichen, D. Pospiech, R. Androsch, B. Wunderlich, and C. Schick, Crystallization and Homogeneous Nucleation Kinetics of Poly(ε -caprolactone) (PCL) with Different Molar Masses, Macromolecules 45, 3816 (2012). [126] B. Wunderlich, Reversible crystallization and the rigid-amorphous phase in semicrystalline macromolecules, Progress in Polymer Science 28, 383 (2003). [127] M. Mileva, R. Androsch, E. Zhuravlev, C. Schick, and B. Wunderlich, Homogeneous nucleation and mesophase formation in glassy isotactic polypropylene, Polymer 53, 277 (2012). [128] J.W.P. Schmelzer and O. Hellmuth, Nucleation Theory and Applications (Joint Institute for Nuclear Research, Dubna, 2013). [129] B. Fillon, A. Thierry, B. Lotz, and J.C. Wittmann, Efficiency scale for polymer nucleating agents, J. Therm. Anal. 42, 721 (1994). [130] M. Trujillo, M.L. Arnal, A.J. Müller, M.A. Mujica, C. Urbina de Navarro, B. Ruelle, and P. Dubois, Supernucleation and crystallization regime change provoked by MWNT addition to poly(ε -caprolactone), Polymer 53, 832 (2012). [131] H. Suzuki, J. Grebowicz, and B. Wunderlich, Glass transition of poly(oxymethylene), British Polymer Journal 17, 1 (1985). [132] M. Avrami, Transformation-Time Relaxations for Random Distribution of Nuclei, Journal of Chemical Physics 8, 212 (1940). [133] F. Rybnikar, Mechanism of secondary crystallization in polymers, Journal of Polymer Science Part A: General Papers 1, 2031 (1963). [134] P. Supaphol, and J.E. Spruiell, Isothermal melt- and cold-crystallization kinetics and subsequent melting behavior in syndiotactic polypropylene: a differential scanning calorimetry study, Polymer 42, 699 (2001). [135] I. Kolesov, R. Androsch, D. Mileva, W. Lebek, A. Benhamida, M. Kaci, and W. Focke, Crystallization of a polyamide 11/organo-modified montmorillonite nanocomposite at rapid cooling, Colloid Polym Sci 291, 2541 (2013). [136] J. Boor, and J.C. Mitchell, Kinetics of crystallization and a crystal-crystal transition in poly-1butene, Journal of Polymer Science Part A: General Papers 1, 59 (1963). [137] F. Danusso, and G. Gianotti, Isotactic polybutene-1: Formation and transformation of modification 2, Die Makromolekulare Chemie 88, 149 (1965).
Bereitgestellt von | Universitätsbibliothek Rostock Angemeldet |
[email protected] Heruntergeladen am | 26.05.14 13:00
92 | 1 Influence of Thermal Prehistory on Crystal Nucleation and Growth in Polymers [138] B. Wunderlich, Macromolecular Physics (Academic Press, New York, 1976), Vol. 2, Crystal Nucleation, Growth. Annealing. [139] J.D. Hoffman, G.T. Davis, and J.I. Lauritzen, Crystalline and noncrystalline solids (Plenum Press, 1976), Vol. 3, In Treatise on Solid State Chemistry. [140] B. Fillon, J.C. Wittmann, B. Lotz, and A. Thierry, Self-Nucleation and Recrystallization of lsotactic Polypropylene (a Phase) Investigated by Differential Scanning Calorimetry, J. Polym. Sci. B: Polym. Phys. 31, 1383 (1993). [141] A. Müller, Z. Hernández, M. Arnal, and J. Sánchez, Successive self-nucleation/annealing (SSA): A novel technique to study molecular segregation during crystallization, Polymer Bulletin 39, 465 (1997). [142] A. Wurm, M. Ismail, B. Kretzschmar, D. Pospiech, and C. Schick, Retarded Crystallization in Polyamide/Layered Silicates Nanocomposites caused by an Immobilized Interphase, Macromolecules 43, 1480 (2010). [143] D. Mileva, R. Androsch, E. Zhuravlev, C. Schick, and B. Wunderlich, Formation and reorganization of the mesophase of random copolymers of propylene and 1-butene, Polymer 52, 1107 (2011). [144] B. Wunderlich, Crystal melting (Academic Press, New York, 1980), Vol. 3, Macromolecular Physics. [145] G. Strobl, From the melt via mesomorphic and granular crystalline layers to lamellar crystallites:A major route followed in polymer crystallization? Eur. Phys. J. E 3, 165 (2000). [146] A. Wurm, and C. Schick, Development of thermal stability of polymer crystals during isothermal crystallisation, e-Polymers 24, 1 (2002). [147] P. Kohn, and G. Strobl, Continuous Changes in the Inner Order of the Crystalline Lamellae during Isothermal Crystallization of Poly(ε -caprolactone), Macromolecules 37, 6823 (2004). [148] D. Mileva, R. Androsch, E. Zhuravlev, and C. Schick, Temperature of Melting of the Mesophase of Isotactic Polypropylene, Macromolecules 42, 7275 (2009). [149] R. Androsch, and M.L. Di Lorenzo, Crystal Nucleation in Glassy Poly(l-lactic acid), Macromolecules 46, 6048 (2013). [150] I. Kolesov, D. Mileva, R. Androsch, and C. Schick, Structure formation of polyamide 6 from the glassy state by fast scanning chip calorimetry, Polymer 52, 5156 (2011). [151] J.M. Hutchinson, S. Smith, B. Horne, and G.M. Gourlay, Physical aging of polycarbonate: Enthalpy relaxation, creep response, and yielding behavior, Macromolecules 32, 5046 (1999). [152] I.M. Hodge, Enthalpy relaxation and recovery in amorphous materials [Review], J. NonCrystalline Solids 169, 211 (1994). [153] E. Donth, Glass Transition: Thermal Glass Transition – Glass temperature – Partial Freezing (Springer, Berlin, 2001). [154] B. Wunderlich, Thermal Analysis of Polymeric Materials (Springer, Berlin, Heidelberg, New York, 2005). [155] D. Mileva, R. Androsch, E. Zhuravlev, C. Schick, and B. Wunderlich, Isotropization, perfection and reorganization of the mesophase of isotactic polypropylene, Thermochim. Acta 522, 100 (2011). [156] Q. Zia, D. Mileva, and R. Androsch, Rigid Amorphous Fraction in Isotactic Polypropylene, Macromolecules 41, 8095 (2008). [157] M.L. Di Lorenzo, M.C. Righetti, and B. Wunderlich, Influence of Crystal Polymorphism on the Three-Phase Structure and on the Thermal Properties of Isotactic Poly(1-butene), Macromolecules 42, 9312 (2009). [158] W. Kozlowski, Kinetics of crystallization of polyamide 6 from the glassy state, Journal of Polymer Science Part C: Polymer Symposia 38, 47 (1972).
Bereitgestellt von | Universitätsbibliothek Rostock Angemeldet |
[email protected] Heruntergeladen am | 26.05.14 13:00
Bibliography
|
93
[159] B. Wunderlich, Beweglichkeit in kristallinen und amorphen Hochpolymeren aus kalorischen Messungen (Discussion with G. Hentze, figure on page 618), Kolloid-Zeitschrift & Zeitschrift für Polymere 231, 605 (1969). [160] F. Kremer, and A. Schönhals, Broadband Dielectric Spectroscopy (Springer, Heidelberg, 2002). [161] M. Oguni, Intra-Cluster Rearrangement Model for the Alpha-Process in Supercooled Liquids, as Opposed to Cooperative Rearrangement of Whole Molecules Within a Cluster, J. NonCrystal. Solids 210, 171 (1997). [162] J.W.P. Schmelzer, R. Müller, J. Möller, and I.S. Gutzow, Theory of Nucleation in Viscoelastic Media: Application to Phase Formation in Glassforming Melts, J. Non-Crystalline Solids 315, 144 (2003). [163] J. Schmelzer, R. Pascova, and I. Gutzow, Cluster Growth and Ostwald Ripening in Viscoelastic Media, physica status solidi a 117, 363 (1990). [164] J. Schmelzer, I. Gutzow, and R. Pascova, Kinetics of Phase Segregation in Elastic and Viscoelastic Media, J. Crystal Growth 104, 505 (1990). [165] J. Schmelzer (under participation of V.V. Slezov, I.S. Gutzow, S. Todorova, J. Schmelzer Jr.), Bubble Formation and Growth in Viscous Liquids (Project Report for BASF Ludwigshafen, Rostock – Ludwigshafen, 1998, 203 pgs. (unpublished)). [166] B. Wunderlich, and C.M. Cormier, Seeding of supercooled polyethylene with extended chain crystals, J. Phys. Chem. 70, 1844 (1966). [167] B. Wunderlich, The Thermal Properties of Complex, Nanophase-Separated Macromolecules as Revealed by Temperature-Modulated Calorimetry, Thermochim. Acta 403, 1 (2003). [168] D. Mileva, R. Androsch, D. Cavallo, and G.C. Alfonso, Structure formation of random isotactic copolymers of propylene and 1-hexene or 1-octene at rapid cooling, European Polymer Journal 48, 1082 (2012). [169] D. Cavallo, L. Gardella, G.C. Alfonso, D. Mileva, and R. Androsch, Effect of comonomer partitioning on the kinetics of mesophase formation in random copolymers of propene and higher α -olefins, Polymer 53, 4429 (2012). [170] R. Androsch, M.L.D. Lorenzo, C. Schick, and B. Wunderlich, Mesophases in polyethylene, polypropylene, and poly(1-butene), Polymer 51, 4639 (2010). [171] D. Cavallo, L. Gardella, G. Alfonso, G. Portale, L. Balzano, and R. Androsch, Effect of cooling rate on the crystal/mesophase polymorphism of polyamide 6, Colloid & Polymer Science 289, 1073 (2011). [172] D. Cavallo, D. Mileva, G. Portale, L. Zhang, L. Balzano, G.C. Alfonso, and R. Androsch, Mesophase-Mediated Crystallization of Poly(butylene-2,6-naphthalate): An Example of Ostwald’s Rule of Stages, ACS Macro Letters 1, 1051 (2012). [173] M.L. Williams, R.F. Landel, and D.J. Ferry, The temperature dependence of relaxation mechanisms in amorphous polymers and other glass-forming liquids, J. Am. Ceramic Soc. 77, 3701 (1955).
Bereitgestellt von | Universitätsbibliothek Rostock Angemeldet |
[email protected] Heruntergeladen am | 26.05.14 13:00
Bereitgestellt von | Universitätsbibliothek Rostock Angemeldet |
[email protected] Heruntergeladen am | 26.05.14 13:00