TABLE OF CONTENTS 1 INTRODUCTION _________________________________________________ 1 1.1 Problem Identification _________________________________________________ 3 1.2 Objective ____________________________________________________________ 4 1.2.1 Main Objective ____________________________________________________________ 4 1.2.2 Specific Objectives _________________________________________________________ 4
2 LITERATURE REVIEW ___________________________________________ 5 2.1 Reclamation Areas in Egypt ____________________________________________ 5 2.2 Effects of Management in Dry Lands_____________________________________ 7 2.3 Concept of Land Degradation __________________________________________ 10 2.4 Degradation By Human-Induced _______________________________________ 12 2.4.1 Industrial Land ___________________________________________________________ 12 2.4.2 Agricultural Land _________________________________________________________ 12 2.4.3 Urban Land ______________________________________________________________ 13 2.4.4 Deforestation ____________________________________________________________ 13
2.5 Soil Degradation Mechanisms __________________________________________ 13 2.5.1 Degradation By External Soil Material ________________________________________ 13 2.5.1.1 Water Erosion ________________________________________________________ 13 2.5.1.2 Wind Erosion _________________________________________________________ 14 2.5.2 Degradation By Internal Soil Deterioration _____________________________________ 14 2.5.2.1 Physical Deterioration __________________________________________________ 14 2.5.2.2 Chemical Deterioration _________________________________________________ 16 2.5.2.3 Biological Degradation _________________________________________________ 17
2.6 Analysis and Interpolation Sequences of Data ____________________________ 18 2.6.1 Analysis Sequences of Data _________________________________________________ 18 2.6.2 Point Interpolation Procedures (Gridding) ______________________________________ 19 2.6.3 Analysis of Variances (ANOVA) _____________________________________________ 22 2.6.4 Geostatistical Analysis (Theory of Regionalized Variables) ________________________ 24 2.6.4.1 The Regionalized Variables Theory _______________________________________ 24 2.6.4.2 The Semi-Variogram and Its Estimation ____________________________________ 25 2.6.4.3 Semi-Variogram Models ________________________________________________ 27 2.6.4.4 Fitting Models ________________________________________________________ 30 2.6.4.5 The Kriging System ____________________________________________________ 31 2.6.5 The Geostatistical Techniques and Soils Survey Data _____________________________ 33
2.7 Terrain Analysis (Digital Terrain Model) ________________________________ 39 2.8 Spectral Analysis (Remote Sensing Imagery) _____________________________ 42 2.9 Land Degradation Assessment (GLASOD) _______________________________ 43 2.9.1 Soil Degradation Status ____________________________________________________ 44 2.9.2 Extent of Soil Degradation __________________________________________________ 45 2.9.3 Overall Severity Level of Soil Degradation _____________________________________ 45
2.10 Agriculture Drainage Systems _________________________________________ 45 2.10.1 Ground water flow into drains ______________________________________________ 46 2.10.1.1 Steady state equations. _________________________________________________ 46 2.10.2 The Ernst Equation _______________________________________________________ 49 2.10.3 Field Drains and Field Laterals______________________________________________ 49 2.10.3.1 Field Drains _________________________________________________________ 49 2.10.3.2 Field Laterals ________________________________________________________ 50 2.10.4 Lay-out of Field Drains and Laterals _________________________________________ 50 2.10.4.1 Random Field Drainage System _________________________________________ 50 2.10.4.2 Parallel Field Drainage System __________________________________________ 51
1
3 AREA DESCRIPTION ____________________________________________ 52 3.1 Location____________________________________________________________ 52 3.2 Climate ____________________________________________________________ 52 3.2.1 Atmosphere Climate _______________________________________________________ 52 3.2.2 Soil Climate _____________________________________________________________ 54
3.3 Geology and Geomorphology __________________________________________ 55 3.4 General Characterization of the Soils ___________________________________ 57 3.4.1 Soil according Master plan __________________________________________________ 57 3.4.2 Initial Soil Characteristics of Year 1986________________________________________ 58 3.4.2.1 The Morphological Features _____________________________________________ 58 3.4.2.2 The Chemical Analyses _________________________________________________ 60 3.4.2.3 The Physical Analysis __________________________________________________ 60
3.5 Hydrology __________________________________________________________ 61 3.6 Irrigation and Drainage_______________________________________________ 62 3.7 Vegetation and Land Use _____________________________________________ 62 3.8 Previous Studies _____________________________________________________ 63
4 MATERIALS AND METHODS ____________________________________ 65 4.1 Materials ___________________________________________________________ 65 4.2 Methods Applied ____________________________________________________ 66 4.2.1 Pre-Field Work ___________________________________________________________ 66 4.2.1.1Terrain Analysis (DTM) _________________________________________________ 67 4.2.1.2 Create soil mapping units _______________________________________________ 67 4.2.1.3 Spectral Analysis ______________________________________________________ 67 4.2.1.4 Samples Design _______________________________________________________ 69 4.2.2 Fieldwork _______________________________________________________________ 69 4.2.3 Laboratory Work _________________________________________________________ 69 4.2.3.1 Soil Physical Analyses__________________________________________________ 69 4.2.3.2 Soil Chemical Analyses _________________________________________________ 70 4.2.4 Data Processing and Analysis ________________________________________________ 70 4.2.4.1 Data input ___________________________________________________________ 70 4.2.4.2 Analysis of Variance (ANOVA) __________________________________________ 71 4.2.4.3 Geostatistical Analysis _________________________________________________ 71 4.2.4.4 Interpolation of the Soil Properties ________________________________________ 71 4.2.5 Data Interpretation (Land Degradation Assessment) ______________________________ 72 4.2.5.1 Calculation of the differences between the two years (1986 & 2001) 73 4.2.5.2 Soil degradation status __________________________________________________ 73 4.2.5.3 Extent of soil degradation _______________________________________________ 74 4.2.5.4 Severity of land degradation _____________________________________________ 74
5 RESULTS AND DISCUSSION _____________________________________ 75 5.1 Geomorphic Analysis _________________________________________________ 75 5.1.1 Terrain Analysis: Geostatistical Technique _____________________________________ 75 5.1.1.1 Contour Point’s Map ___________________________________________________ 75 5.1.1.2 Spatial correlation and empirical Semi-variogram ____________________________ 76 5.1.1.3 Modeling the Semi-Variogram and Goodness of Fit ___________________________ 77 5.1.1.4 Kriging Value and Error Maps ___________________________________________ 79 5.1.1.5 Determination of Geomorphic Mapping Units _______________________________ 80
5.2 Field work __________________________________________________________ 81 5.3 Soils characteristics of year 2001 _______________________________________ 82 5.3.1 Morphological Description __________________________________________________ 82 5.3.2 The Chemical Analysis _____________________________________________________ 84 5.3.3 The Physical Analysis _____________________________________________________ 85
2
5.4 Analysis of Variance (ANOVA) ________________________________________ 86 5.5 Geostatistical Analysis ________________________________________________ 88 5.5.1 Create The Effective Soil Depth (Water-Table Depth) ____________________________ 90 5.5.2 Create The Salic Horizon of Year 2001 ________________________________________ 93 5.5.3 Soil Sets Characteristics: ___________________________________________________ 96
5.6 Monitoring Waterlogging Problem ____________________________________ 127 5.7 Land Degradation Assessment Using GLASOD Methodology
135
5.7.1 The ANOVA of Year 1986 ________________________________________________ 136 5.7.2 Geostatistical Analysis ____________________________________________________ 138 5.7.3 Creating Effective Soil Depth, Soil Salinity and Bulk Density of Year 1986 139 5.7.3.1 Create the Effective Soil Depth __________________________________________ 139 5.7.3.2 Create the EC Value of The Layer (0 - 60cm) of Year 1986 140 5.7.3.3 Create the Bulk Density Value Map of The Layer (60cm) 1986 142 5.7.4 Creating Effective Soil Depth, Soil Salinity and Bulk Density of Year 2001 142 5.7.4.1 Create the Effective Soil Depth __________________________________________ 143 5.7.4.2 Create the EC Value of the Layer (0-60cm) of Year 2001 143 5.7.4.3 Create the Bulk Density Map of the Layer (60cm) of Year 2001 145 5.7.5 Calculate the Differences Between Year 1986 and 2001 _________________________ 146 5.7.6 Severity Classes of the Differences __________________________________________ 149 5.7.7 Calculate the Degradation Severity Extent _____________________________________ 154 5.7.7.1 Extent Percent of the Water-Table Depth __________________________________ 154 5.7.7.2 Extent Percent of the Salinization ________________________________________ 156 5.7.7.3 Extent Percent of Soil Compaction _______________________________________ 158
5.8 Drainage Efficiency _________________________________________________ 160
6 SUMMARY AND CONCLUSION _________________________________ 164 6.1 Soil Characteristics _________________________________________________ 164 6.2 Spectral Analysis ___________________________________________________ 165 6.3 Physical Analyses ___________________________________________________ 166 6.4 Degradation assessment ______________________________________________ 166
7 REFERENCES__________________________________________________ 171
3
1
INTRODUCTION Lands like water is a fundamental resource supporting much of the life
on the earth. The natural resources of water, soil and vegetation essential for future agricultural productivity in the dry lands to face are unprecedented threats of degradation and destruction. Climate variation is partly responsible for declining resource quality and quantity, but so far the greatest danger emanates from human activity, and in particular from agricultural production systems that still dominate land use in the dry lands. In recent years there has been very great pressure on land to meet the increasing demands of both the human and livestock population. In Egypt 90% of population (nearly 49 million people) live in the hyperarid Nile Valley, only 10% of the population live in susceptible dry-land areas. There is a high relationship between land degradation severity and the population distribution. Due to population pressure, more and more marginal lands are being used. To solve population pressure and unemployment problem, the Egyptian government started land reclamation project to allocate land to university graduates. Egypt’s most essential targets by the beginning of the twenty first century are to achieve Egypt’s dream by leaving the narrow valley of the Nile. The Egyptian government carried out extensive national projects for the horizontal expansion of agricultural lands. The main efforts were directed towards the increase of the total cultivated lands, regardless of the quality of the lands being reclaimed, and/or of the potential risk that lands would be subjected to, due to improper management practices. The most important management practice, which would deteriorate the agricultural lands very quickly and very easily is surface irrigation. In the near past, surface irrigation was applied to the crops in amounts that exceed the requirements of the plants. The direct results of such an application was the increase of water table level, less soil air, flooding of lowlying areas, and consequently the formation of waterlogged and saline soils. This problem needs to be assessed, in order to improve soil productivity. 4
Population density *: person per Km2 Nubariya district is considered to have scoped for the expansion of arable land as the Nile delta traditionally forms the old alluvial cultivable land. El-Bustan areas I & II are one of the land reclamation projects, which is irrigated from El-Bustan El-Gddidah canal using drip and sprinkle irrigation systems. Since, the area is considered as a sandy soils, therefore, it is planed to use the modern irrigation systems and without a need of a drainage system. Previous studies identified the main soil problems in El-Bustan sector to be: 1) Low soil fertility and poor physical properties, 2) Lack of sustainable crop rotations, 3) The waterlogging and soil salinity in some area. The waterlogging problem had appeared in some areas of El-Bustan I&II in the year 1995 as a result of bad water management. It was due to the seepage from irrigation canals when the farmers changed the irrigation system from modern to flooding irrigation system. This was also due to the lack of information about the water requirement and irrigation scheduling, and insufficient drainage system. The
new
technologies,
geographic
information
system
(GIS),
geostatistical analysis, and remote sensing (RS) enable researchers and land use planner, to better understand and handle the complicated situation of the problem and assess the lands degradation in the area. The current work aims to investigate the indicators and processes of land degradation due to management in El Bustan area, Nubariya, and to assess and estimate degree, extent, and overall severity of land degradation, using geostatistical analysis and FAO, and GLASOD approach in GIS environment.
5
2
REVIEW OF LITERATURE
2.1 Land Reclamation in Egypt Agriculture plays major economic and social roles in the development and welfare of the Arab Republic of Egypt. It accounts for about 20% of General Development Project’s (GDP) and total exports and about 36% of employment. Since early 1980, the agriculture sector has experienced liberal reforms on input and output prices by eliminating crop area control. Significant increases in crop production of wheat, maize, beans, fruits and vegetables have been recorded in the recent years. It has also been observed that the farmers are following the market trends for their production. The total area of agricultural land (old and new) has reached about 7.5 million feddans, representing only 3% of Egypt’s total area, with a per capita share of 0.14 feddan. The total areas of about 450,000 feddans were reclaimed between 1987 and 1992, but at least 30% of these lands is still below the marginal productivity level (Sanad M. M., 1995). However the agricultural sector in Egypt faces the major limitation of extremely low rate of cultivable land per head: in the order of 0.13 Feddan (1 Feddan = 0.42 hectare). Under economic reform programmes currently applied by the state, priority should be given to maximiza-tion of returns from the new lands. The total area of reclaimed land is 1.9 million feddans, representing only 25% of Egypt’s cropland. However, its share in the total agricultural production does not exceed 7% despite heavy investments. Maps of Egypt’s land resources indicate that there are more than 2.88 million feddans potentially reclaimable by the Nile water (with a maximum pumping of about 150 m) and 0.55 million feddans potentially reclaimable by ground water in the New Valley (Hanna and Osman, 1995). Table (2-1) shows Potentially Reclaimable Lands (Throughout Egypt) Depending on the Nile or Ground Water.
6
Table (2-1). Potentially Reclaimable Lands (Throughout Egypt) Depending on the Nile or Ground Water (Area In Thousands Of Feddans) Region East Delta West Delta Central Delta Total Middle Egypt Upper Egypt Sinai Lake Nasser' shores Total
Targeted areas 799 685 59 1 543 224 782 283 50 1 339
Priority Areas 612 264 59 935 184 195 212 -591
2 882 546 3 428
1526 82 1 608
Areas irrigated with Nile water Areas irrigated with groundwater Grand Total
Source: Master Plan of Egypt's Land Resources, 1986, Hanna and Osman, 1995.
Taking into full account the natural conditions prevailing for agriculture (desert climate, the river Nile being the main source of water), the government of the Arab Republic of Egypt had initiated a vast programme of land reclamation on desert land coupled with the construction of irrigation canals from the Nile.The construction of that area started in 1965, and cultivation began in 1968 with particular emphasis on agricultural production, especially for wheat, maize, potatoes and some vegetables. The reclamation projects on heavy textured deltaic soils are all located along the northern coast of Delta. The projects on calcareous soils, both completed and planned, are only located in Nubariya area. The reclamation project on sandy soils is planned throughout the country Table (2-2). Table (2-2) Main Soils Types in Old and New Lands Reclaimed in the Period 1952 1979 (Source: World Bank Review 1984). Area in which Reclamation area (ha) 108 000
Area Brought into Production Area (ha) 96 000
Area in Production % of total area 89
Calcareous Soils
80 000
68 000
85
Sandy Soils
184 000
104 000
56
Total
372 000
268 000
72
Soil types Heavy Deltaic Soils
Table (2-3) shows the geographical location and the areas of soil reclamation and productive areas.
7
Table (2-3) Geographical Location and Areas of Newly Reclaimed Soils (Source: El Ahram-Economics, 1990). Location Western Delta Middle Delta Eastern Delta Middle & Upper Egypt Others Total
Reclamation area (‘000 hectares) % 156 60 70 44 88 24 24 6 372 100
Productive area (‘000 hectares) 120 52 32 52 12 268
% 76 19.5 4.5 100
West Nubariya, and El Bustan areas (I, II, and III) are parts of those new agricultural lands of the western delta projects developed by El Bustan agricultural development project. They were reclaimed about 12 years ago. The landholders distribution is as following in Table (2-4). Table (2-4) The Holding Distribution (Young Graduates and Small Farmers) In West Nubariya and El Bustan Zones. (BADP, 2003) Reclamation program West Nubariya El Bustan I El Bustan II El Bustan III Total
Number of village 7 6 5 13 21
Young graduates Area Number (feddan) 44 223 724 6085 2764 13,828 3000 15,000 6532 35,136
farmers Area Number (feddan) 754 4227 654 3625 14 70 8000 20,000 9422 27,922
El Bustan I was distributed on young graduates, small farmers, and some private industrial farms. Most of the areas of El Bustan II were distributed to private industrial farms. El Bustan areas have been roughly leveled prior to reclamation, but some slight depressions still exist (BADP, 1997). The detailed numbers and areas of the distribution of the young graduates and small farmers in the West Nubariya and El Bustan zones is show in Table (2-5).
8
Table (2-5) The Number of Young Graduates and Small Farmers in West Nubariya and El- Bustan (Zone I, II, III). (BADP, 2003). Area
Village name
West Nubariya
Abu Bakr as-Siddiq Ahmad Shawqi Al-Adl Saad Zaghlul El Nour Taha Husayn Abd al-Azim Abu alAta
Total
Al-Bustan I
Abd El Megiad Selium Abbas al Aqqad Tawfik El-Hakium Hafiz Ibrahium Ali Bin Abi Talib Asheakh Shishai
Total
Al-Bustan II
Al Imam al-Husayn Al Imam al-Ghazali Ahmed Rami Al Shahid Abd alMunim Riyad Al Sheakh Muhamed Rifaat
Total
Al-Bustan III
Total
Ali Mumbark Al Shohada Al-Safa wal-Marwah Al Esrai wal Mearag Elyas Al-Tabarani Salah Al-Abd Al-Immam Malek El Sediq Youssif Aziz Abdel Azium Zaher Al Hada wal Takwa El Aamilin bel Dowlah
Young Graduates Areas Number Fedden ----43 215 ----1 8 ---------
Small farmers Number Areas Fedden 191 955 1 5 90 450 140 882 140 835 96 580
Total
191 44 90 141 140 96
Areas Fedden 955 220 450 890 835 580
Number
---
---
96
520
96
520
44
223
754
4227
798
4450
259
2590
227
1135
486
3725
23 71 167 86 118 724 648 701 612
115 710 830 1250 590 6085 3240 3505 3060
187 169 --71 --654 4 3 6
935 845 --710 --3625 20 15 30
210 240 167 157 118 1378 652 704 618
1050 1555 830 1960 590 9710 3260 3520 3090
515
2575
1
5
616
2580
288
1440
---
---
288
1440
2764 600 800 600 480 520 ---------------
13,828 3000 4000 3000 2400 2600 ---------------
14 ----------1900 700 2500 700 300 1500 400
70 ----------4750 1750 6250 1750 750 3750 1000
2878 600 800 600 480 520 1900 700 2500 700 300 1500 400
13,890 3000 4000 3000 2400 2600 4750 1750 6250 1750 750 3750 1000
500
6000
---
---
---
---
3000
15000
8000
20000
11000
35000
9
2.2 Land Degradation 2.2.1 Concept of Land Degradation The United Nations Environment Program (UNEP, 1991) has defined Desertification as land degradation in arid, semi-arid, and dry sub-humid areas resulting mainly from adverse human impact. This definition is a revision of the definition formulated at the 1977 by the United Nations Conference on Desertification. The later definition described desertification as the diminution or destruction of the biological potential of the land, which could lead ultimately to the formation of desert-like conditions (UNCOD 1977). Land Degradation implies reduction of resource potential by one or a combination of processes acting on the land. These processes include water erosion, wind erosion and sedimentation by those agents, long-term reduction in the amount or diversity of natural vegetation, where relevant, and salinization and sodication occur (UNEP, 1992). Degraded land has been defined as land which is, due to natural processes or human activity, no longer able to sustain properly an economic function and/or the original ecological function. Land degradation defined also as: “the decline in soil quality caused through its misuse by humans and it refers to a decline in the land productivity though adverse changes in nutrient status, soil organic mater, structural attributes, and concentrations of electrolytes and toxic chemicals” (Lal and Stewart, 1998). Three categories of human induced land degradation are (1) degradation by external soil material (wind erosion), (2) human influence (compaction), and (3) degradation by internal soil deterioration physical, biological and chemical deterioration (Lal and Stewart, 1998). The most important factors causing land degradation and ultimately desertification are soil constraints, water action, wind action, salinization, animal pressure and population (UNEP, 1984). Land Degradation Assessment in Dry Lands (LADA, 2002), indicated that in Egypt: (1) 62% of none severe area had 15% 10
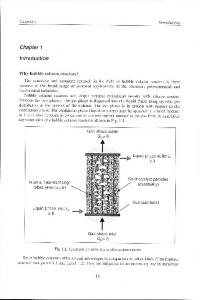
of population density, (2) 27% of light severe area had 38% of population density*, (3) 3% of moderate severe area had 43% of population density, (4) 7% of high severe area had 430% of population density, and (5) 2% of very high severe area had 370% of population density. Poverty also acts as a disabling factor: poor health, poor education, illiteracy and lack of legal rights may all act to reduce the ability and incentive to prevent degradation (David and Nicholas, 1996). The action of people causing land degradation is well known and is certainly widely quoted. There are methods of land use, which are inappropriate in the sense that they lead to environmental degradation (David and Nicholas, 1996). Two principal types of land degradation were introduceed: natural due to soil forming factors, and human induced due to anthropogenic activities (Figure 2-1). Different authors have organized these causes in different ways, but generally they fall under the headings of overgrazing, over cultivation, deforestation, urbanization, industrial land, natural by soil formation and climatic change (Lal and Stewart, 1998).
Land degradation Degradation by Human-Induced
Agricultural Land
Urban Land
Industrial Land
Soil pollution and compaction
Chemical
Salinization alkaliiztion leaching
Physical
Degradation by Natural Process
Chemical
Laterization Soil pollution Calcification and compaction Leaching
Physical
Hard setting pan formation
biological
Decline in soil biodiversity
biological
Compaction crust&seal water&wind erosion
Decrease in biomass
11
Figure (2-1) Principal Types of Land Degradation Natural & Human-Induced .
2.2.2 Land Degradation Types The types of land degradation includes two main catogaries which are the external degradation due to the surrounding conditions such as the climate, topography….etc. and the interal degradation due to the misuse of soil. Both lead to a deterioratrn in land productivity. 2.2.2.1 Degradation By External Soil Material 2.2.2.1.1 Water Erosion
Water erosion is caused by various sources of water included rainfall, melted ice, irrigation water, and rivers. Rainfall erosion is more widely spread out than other causes (Balba, 1995). Lal, (1993) coculoded that, soil erosion affects crop yield both directly and indirectly. Direct effects of erosion on yields are due to the damage of the crop stand, washing away or burial of young seedling. Indirect effect are occuered due to depletion of soil fertility, degradation of soil structure, reduction in plant-available water reserves, and decrease in effective rooting depth. The forms of water erosion, as described by Lal and Stewart (1990) are splash erosion, sheet erosion, rill erosion and gully erosion. Visual evaluation is a qualitative method and based on reconnaissance surveys. It is estimated that the topsoil of the world is being depleted at the rate of 0.7% per year (Balba, 1995). Castilo et al. (1997) reported that the removal of vegetation in semiarid areas leads to an increase in the surface runoff and soil loss caused by soil degradation. 2.2.2.1.2 Wind Erosion
Wind erosion is also an important problem in arid ecosystems. When the wind blows with high velocity, the soil clods are easily broken down and entrained, if vegetation cover is meager (Balba, 1995). The movement of soil particles occurs according to one or more of the following process: saltation (spin-like form), creeping (particles of large sizes may creep on the soil surface) and dust (Bergsma, 1982). Hagen and Armbrust (1994), studied the effects of plant canopy on wind erosion saltation. There is high correlation between plant area index of stalks and soil protection. Planting cacti (opuntia spp) can play a key role in erosion control and land rehabilitation, particularly 12
in arid and semi-arid areas, and as shelter, refuge and feed resource wildlife (Lehouerou, 1996). 2.2.2.2 Degradation By Internal Soil Deterioration
This category describes soil degradation as a result of internal soil deterioration. There are three types: physical, chemical, and biological. 2.2.2.2.1 Physical Deterioration
The Globle Assessement of Desertification (GLASOD) methodology recognized five forms of physical deterioration. This includes sealing and crusting, compaction, Waterlogging, aridification, and subsidence of organic soils (David and Nicholas, 1996). 1- Soil Crusting and Sealing
The term soil crusting refers to the forming process and the consequence of a thin layer at the soil surface with reduced porosity and high penetration resistance (Lal and Stewart, 1998). Bouza et al. (1993) indicated that the Ap horizons showed common characteristics such as high silt and low organic matter cintents. The high ESP is considered the main cause of crust formation in the A horizons o the Haplargid and Natrargid. Dispersion and subsequent illuviation of fine particles into the pores (washing-in) have often been suggested as major processe causing the formation of soil crusts (Braesson and Coadot, 1992). Surface sealing is defined as the initial or wetting phase in crust formation and crusting as the hardening of the surface seal in the subsequent drying phase (Lal et al, 1989). 2- Compaction
The term compaction is used for a process in a three-phase soil system induced by a mechanical stress, often caused by machinery traffic, and characterized by a decrease in volume (an increase in density), mainly under extrusion of air. The term compactness is used for the state of the soil, being the net result of various loosening, compactions and natural processes (Lal and Stewart, 1998). Moffat and Erwue (1997), showed that ripping has only a limitaed ability to remedy soil physical degradation caused by machine-induced compaction. The most common causes of compaction are 13
the use of heavy machinery and trampling by livestock on soils with a low structural stability (David and Nicholas, 1996). Human-induced soil compaction has increased dramatically during recent decades, the most important source being wheel traffic by off-road vehicles. 3- Aridification
Aridification is human-induced change of soil moisture regime towards a more water-deficient soil system (David and Nicholas, 1996). Excavation of deep wells for irrigation causes lowering of the groundwater table, leading to aridification. The World Atlas of Desertification (David and Nicholas, 1996) used the Aridity Index (AI), calculated as the ratio between annual rainfall and potential evapotranspiration. The AI was decided primarily from a climatic aridity index as follows: Aridity Index (AI) = P / PET Where P is the mean annual rainfall and PET is potential evapotranspiration. Potential evapotranspiration is calculated by the method of Penman (1990), taking into account atmospheric humidity, wind and solar radiation. Aridity classification is given in Table (2-6). Table (2-6) Aridity Index according to David and Nicholas (1996) Climatic regions Aridity Index Hyper-arid areas < 0.03 Arid areas 0.03 - 0.20 Semiarid areas 0.20 - 0.50 Sub-humid areas 0.50 - 0.65 4- Waterlogging
Land Degradation Assessment in Dry Lands (LADA, 2002), indicated that in Egypt there is 14,000 km2 (1% of the total area) of hydromorphy condition. Abo Waly, (1990&1998), coculoded that waterlogging usually results from canal seepage, over-irrigation and poor internal drainage. A soil water table rises, salt accumulate on soil surface when the soil water evaporates, leaving its sals behind. Waterlogging affects the aeration status and leads to prevailing of reductomorphic in the form of gleyzation which affects the solubility of soe ions. Waterlogging includes flooding and submergence caused by human 14
intervention in natural drainage systems. Waterlogging usually results from poorly managed irrigation systems where water is applied in excess of needs of the crops and the soil infiltration rate (David and Nicholas, 1996). 5- Subsidence of organic soils
The subsidence of organic soils, due to excessive drainage and/or oxidation, is only included in areas where the agricultural potential of the land is adversely affected (David and Nicholas, 1996). Pang et al. (1996) reported that higher water applications that lead to reduced yield were associated with higher N leacing for a given N application amount. Over the past 45 years, about 11 % of earth’s vegetated soils become degraded to the point that their original biotic functions are damaged, and reclamation may be costly or in some cases impossible (World Resources Institute, 1992). 2.2.2.2.2 Chemical Deterioration
The Globle Assessement of Desertification (GLASOD) methodology recognized four forms of physical deterioration. This includes nutrient and organic matter loss, salinization, acidification and soil pollution (David and Nicholas, 1996). 1- Nutrient depletion
Soil nutrient depletion is a component of chemical degradation relevant to many dry land locations. The depletion of nutrients is often intimately linked to a decline in soil organic matter. Human actions (over cultivation) and the insufficient application of replacement nutrients are the most commonly to promote the loss of nutrients. The Aswan High Dam has deprived agricultural land downstream of nutrient enriching flood-borne silts (David and Nicholas, 1996). 2- Salinization
Salinization of intensively irrigated lands is an increasingly alarming land degradation process experienced in many irrigated regions of the developed countries (Mouat and Hutchinson, 1995). Salt accumulation reduces soil pore space and the ability to hold soil air and nutrients. The salinization
15
embraces alkalization, the excess accumulation of sodium, which rises in association with the dissolved salt load of irrigation water. The effects of salinity on crop yields depend upon crop type, since different crops are susceptible to different concentrations, and forms of salinity. Two types of salt-affected soils are known: primary (natural), and secondary (man-made). The primary (natural) salinization is caused by natural processes mainly due to geological, hydrological and pedological conditions. Humans created saltaffected soils in many parts of the world resulting in a serious degradation and deterioration of land. The land area affected by secondarily salinized soils is larger than that of irrigated land because the former includes all those, which were affected by irrigation for a long time in the past even through they have not been irrigated for centuries (Lal and Stewart, 1998). Nearly 50% of canal irrigated areas in India are affected by salt problems due to a lack or inadequate artificial and/or restricted natural drainage, inefficient use of irrigation water and sociopolitical reasons (Abrol and Sehgal, 1994). Bishay (1993) reported that the assessment of the risk of regional salinization involves integration of hydrology, hydrogeology, soil and land mamagement issues. 3- Acidification
Soil acidification is a naturally occurring process, which leads to degradation and the consequences for crop productivity. In most cases, soil acidification does not cause serious degradation until the pH falls below 5.5 at which point toxic levels of Al (and sometimes Mn) begin to be found in many soils (Lal and Stewart, 1998). 4- Soil pollution and contamination
Soil pollution is reserved to the cases where contamination has become severe and adverse effects have become unacceptable and lead to malfunctioning of the soil and consequently to soil. Soil contamination by heavy metals, metalloids, organic pollutants, and radionuclides, which may occur by traffic, mining activities, metal smelters, long-term use of metal contaminated sewage sludge and pesticides (Lal and Stewart, 1998). 16
Jones (1996) indicated that potential nutrient losses and reduction in nutrient cycling were largest under conventional management were in contrast with those found with organic management. 2.2.2.2.3 Biological Degradation
Reduction in soil organic matter content, decline in biomass carbon, and decrease in activity and diversity of soil fauna are ramifications of biological degradation, which can also be caused by indiscriminate and excessive use of chemicals and soil pollutants (Lal and Stewart, 1990). 2.2.3 Land degradation severity The original request for land degradation assessment came from parties to combat land degradation, a workshop was organized on the issue of land degradation in drylands (LADA, 2002) , funded by UNEP-GEF and the global mechanism of the convention to combat land degradation. The national statistics estimate land degradation based on various small scale maps and inventories that were not always up to date, reliable or both. Actual and potential available arable land (Table 2-7a&b), Humaninduced land degradation due to agricultural activities (Table 2-8a&b), Land degradation: severity of human-induced degradation (Table 2-9a&b), Land degradation severity and population distribution (Table 2-10a&b), Major soil constraints (Sodicity, Shallowness, Erosion Risk) (Table 2-11), and Major soil constraints (Vertic Properties, High P fixation, Salinity) (Table 2-12) were show according to the Land Degradation Assessement in Drylands (LADA, 2002).
17
Table (2-7a) North Africa and Near East, Actual and potential available arable land - part 1(2) Total area Country
Afghanistan Algeria Egypt Iran Iraq Jordan Kuwait Lebanon Libya Morocco Oman Qatar Saudi Arabia Syria Tunisia United Arab Emirates Western Sahara Yemen Total
'000 km² 650 2 382 1 001 1 643 438 96 24 104 1 760 447 271 11 2 396 185 164 75 252 480 12 379
Equiv. % of Equiv. potential Actual potent. Agric. Potential Total popupotential arable land arable arable land popu- lation arable land lation 1994 arable land as % of total land 1994 actually in 1994 land use '000 ha '000 ha % '000 ha % '000 ha '000 ha 3 039 1 325 2 8 054 265.0 16 994 13 105 12 834 7 656 3 8 043 62.7 27 450 6 492 121 59 0 3 500 2 892.6 60 946 21 213 4 709 1 986 1 18 122 384.8 63 903 23 521 4 406 2 890 7 5 750 130.5 20 758 2 441 563 260 3 405 71.9 3 967 595 1 0 0 5 500.0 1 608 20 269 178 17 306 113.8 2 819 138 2 464 1 355 1 2 170 88.1 5 225 362 12 270 7 669 19 9 291 75.7 26 025 10 910 1 0 0 63 6 300 2 082 884 1 0 0 8 800.0 457 14 1 0 0 3 800 380 000 18 056 2 577 5 636 3 555 19 5 527 98.1 14 262 4 607 3 310 2 071 14 4 952 149.6 8 820 2 128 1 0 0 39 3 900 1 812 168 1 0 0 NA NA 201 NA 5 2 0 1 545 30 900 15 475 7 991 49 632 29 009 3 71 580 144.2 290 860 97 166
Table (2-7b) North Africa and Near East, Actual and potential available arable land - part 2(2)
Total area Country '000 km²
Potential Actual arable arable land/caput land/caput agric. agric. population population
Equiv. potential Actual arable arable land/caput Potential land/caput total arable land agric. population population ha ha per capita
Equiv. potential arable land
ha
ha
650
0.6
0.2
0.1
0.5
0.2
0.1
Algeria
2 382
1.2
2.0
1.2
0.3
0.5
0.3
Egypt
1 001
0.2
0.0
0.0
0.1
0.0
0.0
Iran
1 643
0.8
0.2
0.1
0.3
0.1
0.0
Iraq
Afghanistan
per capita
438
2.4
1.8
1.2
0.3
0.2
0.1
Jordan
96
0.7
0.9
0.4
0.1
0.1
0.1
Kuwait
24
0.3
0.1
0.0
0.0
0.0
0.0
Lebanon
104
2.2
1.9
1.3
0.1
0.1
0.1
1 760
6.0
6.8
3.7
0.4
0.5
0.3
Morocco
447
0.9
1.1
0.7
0.4
0.5
0.3
Oman
271
0.1
0.0
0.0
0.0
0.0
0.0
Qatar
11
0.6
0.1
0.0
0.0
0.0
0.0
Libya
Saudi Arabia
2 396
1.5
0.0
0.0
0.2
0.0
0.0
Syria
185
1.2
1.2
0.8
0.4
0.4
0.2
Tunisia
164
2.3
1.6
1.0
0.6
0.4
0.2
United Arab Emirates
75
0.2
0.0
0.0
0.0
0.0
0.0
Western Sahara
252
NA
NA
NA
NA
0.0
0.0
Yemen
480
0.2
0.0
0.0
0.1
0.0
0.0
12 379
0.7
0.5
0.3
0.2
0.2
0.1
Total
18
Table (2-8a) North Africa and Near East, Human-induced land degradation due to agric. activities - part 1(2) Land degradation(total) Total % of total area Very severe degradation degraded '000 km² '000 km² %
Severe Country
Total area
'000 km²
Afghanistan Algeria
650 2 382
127 445
54 52
181 498
28 21
Egypt Iran
1 001 1 643
66 674
19 282
85 956
8 58
Iraq Jordan
438 96
196 14
149 16
344 30
79 31
Kuwait Lebanon
24 104
0 26
1 0
1 26
2 25
Libya Morocco
1 760 447
593 63
95 23
688 87
39 19
271 11
107 0
0 0
107 0
39 0
2 396 185
660 78
142 33
802 112
33 60
Tunisia United Arab Emirates
164 75
126 3
0 0
126 3
77 4
Western Sahara Yemen
252 480
0 217
0 0
0 217
0 45
12 379
3 395
865
4 260
34
Oman Qatar Saudi Arabia Syria
Total
Table (2-8b) North Africa and Near East, Human-induced land degradation due to agric. activities - part 2(2) Total area Country
Severe
Land degradation due to agric. activities % of Total % of total Very severe degraded degradat. area area '000 km² '000 km² % %
'000 km²
'000 km²
Afghanistan Algeria
650 2 382
4 255
0 52
4 307
2 62
1 13
Egypt Iran
1 001 1 643
39 35
12 38
51 73
60 8
5 4
Iraq Jordan
438 96
4 0
141 0
145 0
42 0
33 0
Kuwait Lebanon
24 104
0 0
1 0
1 0
100 0
2 0
Libya Morocco
1 760 447
0 87
0 0
0 87
0 100
0 19
271 11
0 0
0 0
0 0
0 NA
0 0
2 396 185
0 8
0 33
0 41
0 37
0 22
Tunisia United Arab Emirates
164 75
51 0
0 0
51 0
41 0
31 0
Western Sahara Yemen
252 480
0 0
0 0
0 0
NA 0
0 0
12 379
482
277
759
18
6
Oman Qatar Saudi Arabia Syria
Total
19
Table (2-9a) North Africa and Near East, Land degradation: severity of human-induced degradation - part 1(2)
Country Afghanistan Algeria Egypt Iran Iraq Jordan Kuwait Lebanon Libya Morocco Oman Qatar Saudi Arabia Syria Tunisia United Arab Emirates Western Sahara Yemen Total
Land degradation Total area None Light Moderate '000 km² '000 km² % '000 km² % '000 km² % 650 32 5 75 12 362 56 2 382 1 048 44 579 24 250 11 1 001 614 62 272 27 26 3 1 643 129 8 94 6 465 28 438 3 1 0 0 91 21 96 3 4 0 0 62 65 24 0 0 0 0 24 98 104 0 0 72 69 6 6 1 760 941 54 88 5 37 2 447 20 4 42 9 297 67 271 42 16 76 28 46 17 11 0 0 7 65 4 35 2 396 514 21 732 31 348 15 185 0 0 9 5 64 35 164 35 21 0 0 0 0 75 14 19 0 0 58 77 252 251 100 0 0 1 0 480 18 4 85 18 161 33 12 379 3 664 30 2 132 17 2 302 19
Table (2-9b) North Africa and Near East, Land degradation: severity of human-induced degradation - part 2(2) Landdegradation Total area Severe Very Severe Country '000 km² '000 km² % '000 km² % Cause Type O W Afghanistan 650 127 20 54 8 A N, C Algeria 2 382 445 19 52 2 A C Egypt 1 001 66 7 19 2 V,O,D W,C,N Iran 1 643 674 41 282 17 O,A N,C,W,P Iraq 438 196 45 149 34 O,D N,W Jordan 96 14 14 16 17 O Kuwait 24 0 0 1 2 N O,D W Lebanon 104 26 25 0 0 O, (A) N, (C) Libya 1 760 593 34 95 5 A, D, (O) W, (C,N) Morocco 447 63 14 24 5 O,D Oman 271 107 39 0 0 W,N O N Qatar 11 0 0 0 0 O N Saudi Arabia 2 396 660 28 142 6 A,O W,N,C Syria 185 78 42 33 18 O, A, (D) N, (C) Tunisia 164 129 79 0 0 O,A N,C United Arab Emirates 75 3 4 0 0 NA NA Western Sahara 252 0 0 0 0 D,O W,N Yemen 480 217 45 0 0 Total 12 379 3 398 27 865 7 L e g e n d: Cause: A = agriculture; O = overgrazing; D = deforestation; V = over exploitation of vegetation Type: W = water erosion; N = wind erosion; C = chemical deterioration; P = physical deterioration
20
Table (2-10a) North Africa and Near East, Land degradation severity and population distribution - part 1(2) Total area Country
'000 km²
None Population area (%) density 5 10 44 1
Light Population area (%) density 12 47 24 1
Moderate Population area (%) density 56 28 11 39
Afghanistan Algeria
650 2 382
Egypt Iran
1 001 1 643
62 8
15 16
27 6
38 58
3 28
43 44
Iraq Jordan
438 96
1 4
109 13
0 0
3 224
21 65
37 22
Kuwait Lebanon
24 104
0 0
NA NA
0 69
NA 27
98 6
66 26
Libya Morocco
1 760 447
54 4
1 5
5 9
1 232
2 67
18 41
271 11
16 0
7 NA
28 65
7 42
17 35
9 36
2 396 185
21 0
2 NA
31 5
13 151
15 35
7 69
Tunisia United Arab Emirates
164 75
21 19
5 8
0 0
NA NA
0 77
NA 27
Western Sahara Yemen
252 480
100 4
1 4
0 18
NA 18
0 33
3 75
12 379
30
1
18
22
17
34
Oman Qatar Saudi Arabia Syria
Total
Table (2-10b) North Africa and Near East, Land degradation severity and population distribution - part 2(2) Total area Country
'000 km²
Severe Population area (%) density 20 14 19 34
Very Severe Population area (%) density 8 23 2 22
Afghanistan Algeria
650 2 382
Egypt Iran
1 001 1 643
7 41
430 44
2 17
370 21
Iraq Jordan
438 96
45 14
14 171
34 17
97 11
Kuwait Lebanon
24 104
0 25
NA 27
2 0
70 NA
Libya Morocco
1 760 447
34 14
6 38
5 5
1 114
271 11
39 0
8 NA
0 0
NA NA
2 396 185
28 42
7 66
6 18
2 100
Tunisia United Arab Emirates
164 75
79 4
63 46
0 0
NA NA
Western Sahara Yemen
252 480
0 45
NA 8
0 0
NA NA
12 379
30
15
5
22
Oman Qatar Saudi Arabia Syria
Total
21
Table (2-11) North Africa and Near East, Major soil constraints (Sodicity, Shallowness, Erosion Risk) Total Area Sodicity Country Afghanistan Algeria Egypt Iran Iraq Jordan Kuwait Lebanon Libya Morocco Oman Qatar Saudi Arabia Syria Tunisia United Arab Emirates Western Sahara Yemen Total
Sodicity
'000 km² '000 km² 650 5 2 382 6 1 001 4 1 643 37 438 0 96 0 24 0 104 0 1 760 0 447 0 271 0 11 0 2 396 0 185 0 164 5 75 0 252 0 480 0 12 379 57
% 1 0 0 2 0 0 0 0 0 0 0 0 0 0 3 0 0 0 0
Shallow ness '000 km² 215 622 325 357 139 24 2 2 204 121 92 2 430 61 46 10 77 127 2 854
Shallo w ness % 33 26 32 22 32 26 14 22 12 27 29 19 22 32 28 12 31 30 23
Erosion risk '000 km² 138 143 78 321 33 13 1 5 78 109 29 1 140 21 24 4 10 36 1 185
Erosion risk % 22 6 8 20 8 15 8 46 4 24 9 10 7 11 14 5 4 9 10
Table (2-12) North Africa and Near East, Major soil constraints (Vertic Properties, High P fixation, Salinity) Country Afghanistan Algeria Egypt Iran Iraq Jordan Kuwait Lebanon Libya Morocco Oman Qatar Saudi Arabia Syria Tunisia United Arab Emirates Western Sahara Yemen Total
Total area
High P fixation
'000 km² 650 2 382 1 001 1 643 438 96 24 104 1 760 447 271 11 2 396 185 164 75 252 480 12 379
'000 km² 0 0 0 0 0 0 0 0 0 0 0 0 0 0 0 0 0 0 0
High P fixation
% 0 0 0 0 0 0 0 0 0 0 0 0 0 0 0 0 0 0 0
22
Vertic properties
Vertic properties
'000 km² 0 5 1 1 30 0 0 1 3 12 0 0 0 11 5 0 0 0 69
% 0 0 0 0 7 0 0 12 0 3 0 0 0 6 3 0 0 0 1
Salinity
'000 km² 37 72 87 238 61 3 2 0 40 23 20 2 93 5 13 10 0 17 723
Salinity
% 6 3 9 15 14 3 10 0 2 5 6 17 5 2 8 13 0 4 6
2.2.4 Land Degradation Indicators Land Degradation Assessment in Dry-lands project proposing a set of indicators that describe the biophysical land qualities, socio-economic conditions and institutional factors that influence land degradation in drylands (LADA, 2002). The Biophysical indicators are inappropriate land use (e.g., over-grazing, excessive irrigation, extensive tillage and deforestation), degradation of soil, water and vegetation cover and loss of both soil and vegetative biological diversity, affecting ecosystem structure and functions. The biophysical impacts of land degradation, all leading to loss of soil productivity, include soil erosion by water and wind, salinization and alkalinisation and chemical, physical, and biological degradation (Mathilde and Alexandra, 2002). Biophysical indicators of land degradation are described with respect to soil properties (e.g., soil fertility, soil productivity, compaction, and loss of topsoil and subsoil), erosion (e.g., shifting sands over fertile soils, water turbidity and sedimentation, soil loss, and gullying incidence), land cover (e.g., land cover change and farming and grazing intensity), and land form (e.g., topography). Socio-economic indicators are often poverty and food insecurity combined with extreme climatic variation such as drought, whether natural or anthropogenic (Mathilde and Alexandra, 2002). Due to the centrality of poverty as a root cause, and consequence, of land degradation – in which the causes and consequences of land degradation are more pronounced among the poorest segments of the world’s population - socio-economic indicators are framed about key characteristics of poverty: lack of opportunity (e.g., lack of income, credit, land, and other assets to attain basic necessities such as food, clothing and shelter; insecurity (e.g., vulnerability to adverse shocks and limited means to cope); and disempowerment (e.g., voicelessness and powerlessness to influence decisions). Institutional indicators are institutional and policy distortions; failures in the public or government, private or market, civil or community sectors; and 23
civil strife. Lack of institutional support; apprehension to decentralize; inadequate development of land and natural resources management policies; negative externalities of privatization schemes; development of macroeconomic policies that encourage land mismanagement; and incomplete markets for environmental goods and services (e.g., that do not internalize environmental costs) have decreased incentive and ability for collective action to manage land and natural resources (Mathilde and Alexandra, 2002). 2.3 Mapping Land Degradation in GIS Environment GIS provide new tools to collect, store, retrieve, analyze, and display spatial data in a timely manner and at low cost. The availability of data sources in a digital form and increased capability of computers to handle large volumes of data have allowed them to create attribute data of soils, climate, landform, and vegetation necessary for spatial representation of land degradation hazards. Land degradation attribute data in a GIS consist of discrete observations or measured parameters recorded while digitizing maps or estimated from the combination of other spatial parameters contained in an existing data base. The application of GIS to land degradation assessments has been in the areas of analysis and display of relevant attribute data, the parameterization of simulation models, and the linkage of GIS with these models(Petersen et al., 1997). Mapping the various types of land degradation (physical, chemical, and biological) cannot be achieved following a single standard cookbook recipe (Marcel et al., 1997). As with soil survey, the desired amount of detail and the variability within map units that will be accepted, both of which are determining factors for the size of map scale, will impose restrictions to the use of one or more methods for economic or technical reasons. Spatial mapping usually involves the interpolation and/or extrapolation of point data across surfaces to depict conditions at all positions on the land surface. Remote sensing may be used as an aid to distinguish landscape
elements. The
mapping
techniques
content
extrapolation
(qualitative models) and interpolation (quantitive models). Qualitative models
24
derived from modifications of soil-landscape models are efficient means of extrapolating point data based on conceptual relationships between observations of the soil property or condition being mapped and easily observable landscape features (Hudson, 1992). Quantitive geostatistical models are available to model and map spatial and temporal variability. These procedures are all based on sampling a degraded area by means of point observations. The objectives in choosing a mapping method are to (1) meet the needs of the user and (2) maximize the efficiency of survey, thereby minimizing costs. Both qualitative and quntitative methods have advantages and limitations relative to these objectives. One of the greatest advantages to using a qualititive modeling approach as described for the purpose o mapping soil degradation is relativily low cost, but experience in soil survey proves that extrapolation of limited data based on scientifically sound relationships can produce useful maps based on a minimum of observations. Quantitave models are often the only reliable way to interpolate between point measurements or observations when the variable being mapped is not easily observed or correlated with another easily observable variable(Marcel et al., 1997). 2.3.1 Spectral Analysis (Remote Sensing Imagery) The evolution of RS techniques applied to land degradation assessments has been slow over the years as compared to field methods.the primary reasons deal with the fact that spectral signatures of soil properties indicative of land degradation may, under some circumstances, be masked by other features at the soil surface such as vegetation cover, management, and tillage practices. Although RS cannot replace field mapping of land degradation, they supplement and/or provide information not otherwise available to soil scientist. There is no doubt that the development of higher resolution (spectral and spatial) sensors than the ones currently used and the use of recently declassified images acquired by “spy” satellites and aircraft
25
systems will increase the applications of satellite RS to land degradation assessments (Egide and Petersen, 1997). Remote sensing enable us to extract some spectral data reflecting the characteristics of an object earth, which can be transformed into information by processing and interpretation (Dugging and Robinove, 1990). The overall objective of image classification procedures is to automatically categorize all pixel values into classes. The different feature types manifest different combination of DNs based on their inherent spectral reflectance and emittance properties. The supervised classification requires good reference knowledge about at least some training sets for the use of the maximum likelihood (MLHD) decision functions. The purpose of the training sets is to assist the computer program in determining the statistical relationships between the data and the user defined classes in order not to contain a mixture of classes when running the classifier (Lillesand and Kiefer, 1994). The Classify operation performs a multi-spectral image classification according to training pixels in a sample set. Before classification, a sample set thus has to be prepared with Sample. The Maximum Likelihood classification assumes that spectral values of training pixels are statistically distributed according to a multi-variate normal probability density function. For each set of spectral input values, the distance is calculated towards each of the classes is calculated using Mahalanobis distance. Another factor is added to compensate for within class variability (ILWIS.3.11, 2001). Abdel-hady and Abdel-kader (1999), illustrated that transformed SPOT data proved high potentially to map infrastructure, even tertiary drain. This mapping capability may be used to update the infrastructure of topographic map (scale 1:25,000) and to map successfully the waterlogging soils. Goossens (1994) concluded that the waterlogged soils in the western part of the newly reclaimed areas in the Baheira province in Egypt are created by a clay horizon below the aeolian sands impeding drainage. The use of satellite imagery has proved to be an excellent tool for monitoring of
26
salinization and waterlogging. By the application of multitemporal image analysis it is possible to estimate the loss of land due to waterlogging and implementing a spatial growth model it is possible predict the expansion of waterlogging. 2.3.2 Terrain Analysis (Digital Terrain Model) Digital terrain models (DTM) are digital representations of altitude and are store continuously varying such as elevation, groundwater depth or soil thickness (ILWIS 3.11, 2001). Hutchinson (2000) reported that, terrain plays fundamental role in modulating earth surface and atmospheric processes. The issue of spatial scale enters directly into these analyses. This can be related to the spatial resolution of supporting digital terrain models (DTM). Surfaces potentially have an infinite number of points, which can be measured. Obviously it is impossible to record every point; consequently, a sampling method must be used to extract representative points to build a surface model that approximates the actual surface. The choice of data acquisition strategy and techniques is critical for the quality of the results. Input data should reflect adequate information in the modelling. The database should contain the significant surface points and structural features (Markus, 2001). Surveying data are often put it directly into the computer through data recorders which, may be attached to field instruments. Since data tend to be very accurate, and topographers tend to dept the survey to the character of the terrain surface, the accuracy of the DTM is very high. It is possible to distinguish a number of sampling methods, describing grids, profiles or contours of the terrain surface. Progressive sampling has been proposed as a method to automate the sampling in response to a varied terrain. However, there are still problems of redundancy associated with raster encoding (Makarovic, 1973). Depending on the sampling method and imagery that are used, the resulting DTM accuracy will be medium or high. The most frequent method
27
is to digitize contour lines from existing topographic maps. These analogue data may be digitized through manual digitization, semi-automated line following, or by means of automatic raster scanning and vectorization. Weibel and Heller, (1991), reports that errors may be introduced (in drawing, line generalization, reproduction) and a lot of the information is lost in map making. The captured data must be structured to enable handling by subsequent modelling operations. A variety of data structures for DTM have been in use over time. Today, the majority of DTM confirm to two data structures: the regular grid and the structural DTM (randomly distributed set of surface specific points) are the most common approaches of representing digital surface data (Markus, 2001). Transfer the digital contour lines to a grid system and add the control elevation points from topographic maps, then apply hybrid method, using spatial correlation techniques will increase the chance to obtain good results. Therefore, it will be high accuracy to distinguish all the hilly and depression area between the contour lines. Digital Terrain Models (DTM) are made via the following techniques (ILWIS 3.11, 2001): 1- Photogrammetrical techniques These methods use stereoscope aerial photographs or satellite images to sample a large number of points with X, Y, and Z values by means of advanced Photogrammetrical equipment. After this, the points are interpolated into a regular grid (raster). At present, Photogrammetrical software packages are on the market which can automatically generate a DTM from stereoscopic scanned aerial photographs or satellite images in combination with a number of control points for which (x, y, and z) coordinates are known. 2- Point interpolation techniques When point data is available for an area, obtained via ground survey using theodolites and/or Global Positioning Systems (GPS), point interpolation can be used to generate a DTM. For complex terrain, the interpolation techniques are also rather complex, taking into account break-lines of slope. 28
3- Interpolation of contour lines digitized from existing maps When neither existing DTM derived from Photogrammetrical techniques nor detailed point data available, the contour information on existing topographic maps is the only source from which you can generate a DTM. In that case the contour lines are digitized and interpolated. 4- Interpolation of contour lines with additional point heights The interpolation of contour lines will give wrong results for hilltops, which are enclosed on all sides by a contour line. They will appear flat areas with the same altitude as the contour line surrounding it. To improve this, it is possible to combine the segment map; containing the contour line, with a point map; containing the altitudes of the hilltop. Both maps should first be converted to raster and then combined into one raster map. This raster map will serve as the basis for the interpolation. Digital Terrain Models (DTM) have a very wide range of applications. They form one of most frequently used spatial data sources in GIS projects. They are also the basis for a large number of derivative informations. The most important application areas of DTM are (ILWIS 3.11, 2001): 1- Slope steepness map showing the steepness of slope in degrees, percentages, or radians for each location (pixel). 2- Slope direction map (slope aspect maps): showing the orientation or compass direction of slope (between 0° - 360°). 3- Slope convexity / concavity maps: showing the change of slope angles within a short distance. From this maps you can see if slopes are straight, concave, or convex in the form. 4- Hill shading maps (shadow maps): showing the terrain under an artificial illumination, with bright sides and shadow. Hill shading is used to portray relief difference and terrain morphology in hilly and mountainous areas.
29
5- Three-dimensional views: showing a bird eye view of the terrain from a user defined position above the terrain. 6- Cross-sections: indicating the altitude of the terrain along a line and represented in a graph (distance against altitude). 7- Creation of ortho-images: from aerial photographs or satellite images with the help of DTM, aerial photographs and satellite images can be corrected for tilt distortion and relief displacement. 2.3.3 Soil Data Analysis 2.3.3.1 Analysis Sequences of Data
Three types of analysis sequence of data sets, the first, the distance between observations varies and must be specified for every point. Next, the points are assumed to be equally and regularly spaced; the numerical value of the spacing does not enter into the analyses except as a constant. Finally, the spacing may not be considered at all and only the sequence of the observations is important. Table (2-13) shows the classification of the various data-analysis techniques (Davis, 1986). These methods and techniques provide answers to the following broad categories of questions: Are the observations random, or do they contain evidence of trend or pattern? If a trend exists, what is its form? Can cycles or repetitions be detected and measured? Can predictions or estimations be made from the data? Can variables be related or their effectiveness measured? Although such questions may not be explicitly posed in each of the following discussions, we should examine the nature of the methods and that think about their applicability and the type of problems they may help solve. The sample problems are only suggestions from the many that could be used. Another question is very important to answer it, Why do we need to use variogram models instead of the real thing? To ensure that Kriging the variance is positive or zero (negative variances do not make much sense), the spatial correlation must be based on some “positive definite” theoretical 30
models. Such models are fit to the actual (or experimental) variogram, and include spherical, exponential, Gaussian, etc models. Furthermore, values of the variogram might be needed at lag distances where measurements are not available, so a function, which relates the lag distance to the variogram value, will ,therefore, be useful. Geostatistical analysis will be described later in this text with more emphases on methodology and conditions. Table (2-13) The Classification of the Various Data-Analysis Techniques. (Davis 1986) Nature of variable
Variable measured on interval or ratio scales
Variable measured on nominal or ordinal scales
Observations irregularly spaced
Observations equally and regularly spaced
Interpolation Polynomial regression Splines
Orthogonal polynomial regression Moving averages Filtering and smoothing Zonation Autocorrelation and cross-correlation Semivariograms Spectral analysis
Series of events K-S Test
Autoassociation and cross-association Substitutability analysis Markov chains Runs tests
Spacing not considered
Autocorrelation and crosscorrelation
Autoassociation and crossassociation Substitutability analysis Markov chains Runs tests
2.3.3.2 Analysis of Variances (ANOVA)
ANOVA tests the null hypothesis that the population means are all equal. The alternative is that they are not all equal. This alternative could be true if all of the means are different, or simply if one of them differs from the rest. Comparison of several means is accomplished by using an F statistic to compare the variation among groups with the variation within groups. Calculations are organized in an ANOVA table, which contains numerical measures of the variation among groups and within groups (Davis, 1998). The null and alternative hypotheses for one-way ANOVA are: Ho : 1 = 2 = …= I and (F statistic F Table). H1 : not all of the I are equal and (F statistic F Table).
31
This technique is useful when validity of the measurements of variables has to be analyzed. In general, this technique in this field is involved for separating the total variance in a collection of measurements into various components. The test of equality operates by simultaneously considering both differences in means and in variances (Frugoni, 1997). In one way ANOVA, total variance of the data set is broken into two parts: (1) variance within each group and (2) variance between the groups. The formalized procedure for analysis of variance is contained in an ANOVA table. The columns of the ANOVA table are labeled Source, Degree of freedom, Sum of Squares, Mean Square, F value and probability. And the rows are labeled Between groups and Within groups. Between groups (variation among groups) corresponds to the FIT. Within groups (variation within groups) corresponds to the RESIDUAL. Sum of Squares represents variation present in the data. The sources of variation are groups, error, and total. The total variation is composed of two parts, one due to groups and one due to error. Degrees of freedom are related to the deviations that are used in the sums of squares. To calculate each mean square, divide the corresponding sum of squares by its degrees of freedom. To test the null hypothesis in a one-way ANOVA, F statistic was calculated (Davis, 1998). If the variation within the groups considered is large compared to the difference between groups, the differences will be difficult to prove (Davis, 1986). We reject Ho in favor of Ha if the F statistic is sufficiently large. The P value of the F test is the probability that the random distribution of the variable is greater than or equal to the calculated value of the F statistic (Davis, 1998). 2.3.3.3 Geostatistical Analysis
Geostatistical analysis takes into account both the structured and random characteristics of spatially distributed variables, thus providing tools for their description and optimal estimation. The principal difference between Geostatistics and conventional statistics is that in Geostatistics the variables are linked to locations. The spatial dependence function of observations is
32
defined by the second part of the intrinsic hypothesis, which is termed the semi-variogram (h). The semi-variogram is defined as a function of the distance h between locations in the observation space. Geostatistical analysis is a two step procedure: (a) the calculation of the experimental semivariogram and fitting a model; and (b) interpolation through some sort of Kriging, which uses the semi-variogram parameters (Stein, 1998). The geostatistical analysis is a key of regionalized variable theory, which considers differences between pairs of values of a property at places separated by any distance and expresses these as their variances. It also takes into account direction. Suppose we have the values z(x) and z(x+h) at x and x+h, respectively, where x and x+h are positions with one, two, or three spatial coordinates and h is a vector with both distance and direction, usually known as the lag, separating them (Webster, 1995). Then for this pair the variance per site is S2 = [z(x) – z- ]2+ [z(x + h) - z- ]2
………………………..(1)
Where z- is the mean of the two values. Notice that S2 is half the square of the difference: S2 = 1/2[z(x) – z- ]2+ [z(x + h) - z- ]2 ……………………….(2) Regionalized variable theory focused attention first on such differences and their variances. The quantity S2 was therefore called the semi-variance, and the name has stuck. Nevertheless, it is the variance per site or observation. If further we have, say, m pairs of observations separated by the same lag, h, then we can define their average: Ŝ2 = 1/2m Σm i=1 [z(xi) – z(xi + h)]2 ……………………….(3) To make use of this simple notion and generalize equation (3), certain stationarity assumptions must be made. These are as follows: 1- The expected value of z at any place x is the mean, μ :
E [z(x)] = μ
……………………………(4)
2- For any h the difference [z(xi) – z(xi + h)] has a finite variance, which again is independent of x:
Var [z(xi) – z(xi + h)]= E{[z(xi) – z(xi + h)]2}= 2 (h)……………(5)
33
These two assumptions constitute the intrinsic hypothesis of regionalized variable theory. They assume the following model of soil variation: z(x) = μv + ε(x), ………………………….(6) Where z(x) is the value of the property at position x within a region, μ v is the mean value in that region, and ε(x) is a spatially dependent random component with zero mean and variance defined by Var [ε(x) - ε(x + h)] = E{[ ε(x) - ε(x + h)]2} = 2 (h) …………….(7) In a large region, of course, we know that a soil property will vary from one part to another. Nevertheless, the property will commonly be locally stationary within some neighborhood v, and this condition is usually quite adequate for analysis in which h is limited to some maximum radius r within which the relationships apply. 2.3.3.3.1 The Semi-Variogram and Its Estimation
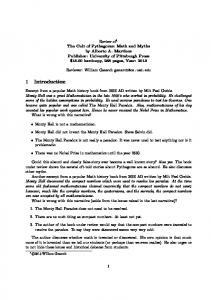
Equations (5) and (7) defined the semi-variance as a function of h, the lag. This function is semi-variogram, (h). In one dimension, (h) can be estimated at regular intervals by sampling along transects. Thus given a set of values z(x1), z(x2),……z(xn) we can estimate (h), where h is any integral multiple of the sampling interval, by γ(h) = ½(n-h) i=1Σn-hy (xi) – y (xi+h)2 ………………………..(8) Figure (2-2) shows the comparisons involved for h = 1, 2, and 3. The result is an ordered set of values that constitute the sample semi-variogram. Simple formula for estimating semi-variance is sensitive to extreme values of the differences z(x) – z(x+h), especially as the squared difference follows a chisquared distribution with one degree of freedom, which is highly skewed. Cressie and Hawkins 1980 investigated more robust estimators of (h) and discovered that the fourth root of the usual squared difference, had a distribution close to normal with negligible skew (Davis, 1986).
34
(a)
Lag 1 Lag 2 Lag 3
(b)
Lag 1 Lag 2 Lag 3
Figure (2-2) The Comparisons for Estimating Semi-Variances on Linear Transects at Lags of 1, 2, And 3 Sampling Intervals, (A) For Complete Data And (B) where Some Observations Are Missing the Open Circles
y(x) = {[z(x) – z(x+h)]2}1/4 ……………………………(9) In survey we are usually interested in the variation in a plane rather than in a single direction along a transect. The semi-variogram is then a twodimensional function. A sample semi-variogram can be calculated quite straightforwardly if we have measured the soil at regular intervals on a twodimensional grid. Potentially different distances and directions then separate every pair of observations. This difficulty is usually overcome by grouping the separations both in distance and direction. A range in each is chosen, again usually equal to the class interval between successive lags, and applied so that the nominal lag lies at center of the range. Each squared difference then contributes to the semi-variance for the lag class into which it falls by virtue of its actual separation. Figure (2-3) shows the geometry of the grouping.
Figure (2-3) Grouping Have Lags By Distance and Direction.
35
2.3.3.3.2 Semi-Variogram Models
Soil varies continuously in space, at least at most practical scales, and so semi-variogram of soil properties are continuous function. Figure (2-4) shows the principal features of semi-variogram of soil.
Figure (2-4) The Principal Features of Semi-Variogram of Soil.
The interpretation of several parameters of the semi-variogram is as follows: The nugget effect, a term borrowed from gold mining, contains the nonspatial variability. The sources of such variability are the operator bias, the measurement error and the short-distance variability (distances shorter than the smallest sampling distance). The nugget effect does not measure a systematic deviation in the observation, such as all measurements are shifted by a fixed constant value. The sill value (or the variance) is the value, which the semi-variogram reaches if h tends to infinity, i.e. if the observations are growing to be uncorrelated. The range of the semi-variogram is a measure for the distance up to which the spatial dependence extends. Positive Definite Functions
To represent a sample semi-variogram we must allow for at least three elements in most instances: an intercept, an increasing section of potentially varying shape, and a sill. In two dimensions there must also be provision for
36
anisotropy. There are situations where soil properties do not have definable covariances because their variances increase apparently without limit. Safe models
The safe models define models that can be recommended for semi-variogram of soil properties. They are defined for one dimension but are safe in the sense that they are conditional positive definite in two and three dimensions. A- Linear models
The simplest model that can be fitted in one dimension is clearly linear. It has slope w and may have an intercept or nugget variance co. Its formula is: γ(h) = co + wh
for h > 0
γ(0) = 0.
B- Spherical Models
A model that has been found to fit not only many semi-variogram of soil properties but also those of mineral deposits of many kinds is the spherical model. Its definition is γ(h) = co + c [(3h/2a) – ½ (h/a)3] γ(h) = co + c
for < h a
for h > a
γ(0) = 0 Where a is the range, c0 + c is the sill, and c0 is the nugget variance. C- Exponential Models
The formula of the exponential model is γ(h) = co + c [1 – exp (-h/r)]
for h > 0
γ(0) = 0 The spatially dependent variance and nugget are c and c0 , and r is a distance parameter controlling the spatial extent of the function. Here γ(h) approaches the sill asymptotically, and so there is no strict finite range. D- Gaussian Models
The Gaussian or hyperbolic isotropic model is similar to the exponential model but assumes a gradual rise for the y-intercept. The formula used for this model is: γ (h) = Co + C[1-exp(-h2/Ao2)]
37
Where h = lag interval, Co = nugget variance 0, C = structural variance Co, and Ao = range parameter (not range). As for Ao in the exponential model, Ao in the Gaussian model is not the range but rather a parameter used in the model to provide range. Range to 95% of the sill in the Gaussian model can be estimated as 1.73Ao (1.73 is the square root of 3). Risky Models
In most instances soil properties appear transitive: the semi-variogram appears monotonic increasing to a sill, and this is to be expected in a finite region. The main difference among them is the degree of curvature. The exponential function curves gradually. The spherical model curves more tightly. But there are instances where the semi-variogram appears to curve more tightly still, even abruptly, and the investigator may be tempted to fit more tightly curving models. A- The Circular Model
The area of intersection of two equal circles is given by A = a2/2 cos-1 (h/a) – h/2 a2 – h2
for h a ,
Where a is the diameter of the circles and h the distance between their centers. Expressing this as a fraction of the area of the circle gives for the autocorrelation function, and the following semi-variogram: γ(h) = co + c [1 – 2/ cos-1 (h/a) – 2h/a 1 – h2/a2] γ(h) = co + c
for h > a
γ(0) = 0 B- Linear Model with sill
The extreme form of transitive model is linear with sill: γ(h) = co + c (h/a)
for < h a
γ(h) = co + c
for h > a
γ(0) = 0
38
for < h a
Again, by analogy with the spherical scheme this can arise from linear zones of influence of equal length but with varying distance between their centers, h.. 2.3.3.3.3 Fitting Models
Choosing models to describe observed semi-variances and procedures for fitting them are matters of some controversy. The choice of model will obviously be governed by the general graphic appearance of the sample semivariogram. It also depends on the purpose for which it is wanted. The criteria for choosing models for estimation or interpolation might be quite different from those used for illustration or explanation. For all practical purposes there are some general rules, which have to be obeyed in order to obtain reliable semi-variogram estimates: 1- The sample schemes that had less than 72 pairs of points per lag commonly estimated the range of the true spatial structure with an error of 25% or greater. This means that square grids with at least seven points on a side are required for accurate analysis (Jury, 1991). 2- The maximum distance h between observation points for which the semivariogram may be determined should not exceed half the length of the area (Stein, 1998). 3- Two-dimensional sampling grids yield more accurate information about () than transects (one-dimensional lines of samples) with the same number of points. The semi-variogram, which can be calculated from the data needs to be modelled using one of the following models in order to find the ‘best’ model and the ‘best’ parameters for the nugget, sill and range one-dimensional semivariogram models. Geostatistical process generally is a two step procedure: (a) the calculation of the experimental semi-variogram and fitting a model to it, (b) the actual interpolation through some sort of kriging, which is an interpolation technique that uses the semi-variogram parameters to obtain the relationship between the data points (Stein, 1998). 39
2.3.3.3.4 The Kriging System
Kriging is named after D. G. Krige, a South African mining engineer and pioneer in application of statistical techniques to mine evaluation. The Kriging technique is derived from the theory of regionalized variables. An advantage of Kriging is that it provides a measure of the probable error associated with the estimates (Stein, 1998). Lang, (1996) states that many properties of the earth’s surface vary in an apparently random yet spatially correlated fashion. Using Kriging for interpolation enables us to estimate the confidence in any interpolated value in a way better than the earlier methods do (classical techniques). Kriging is also the method that is associated with the acronym B.L.U.E. (Best Linear Unbiased Estimator), it is “linear” since the estimated values are weighted linear combinations of the available data, and it is “unbiased” because the mean of error is 0. Kriging is “best” since it aims at minimizing the variance of the error. Kriging is a geostatistical interpolation method that considers both the distance and the degree of variation between known data points when estimating unknown areas. It also provides the ability to create semivariogram that helps users understand directional (e.g., north-south, east-west) trends of their data. A unique feature of Kriging is the error estimation for each grid node, which gives a measure of confidence in the modeled surface. Several different variations of Kriging are available including Ordinary, Simple, Universal and Block Kriging, as is the ability to apply a nugget effect when doing multi-directional analysis of the point file (Northwood technologies Inc., 2000). Kriging is particularly appropriate where best estimates are required, data quality is good, and error estimates are essential. For example, Kriging is often used to map soil chemistry. Consider a typical situation in which we have measured a property at a number of places, xi, within a region to give values z(xi), i = 1, 2, ……..n. from these we wish to estimate the value of the property at some place B. the place might be a
40
“point”, that is, an area of same size and shape as those on which the measurements were made. The estimated value at B is the linear sum. Ž(B) = λ1 z(xi) + λ2 z(x2) +····+ λn z(xn) ………………(1) Where λi are the weight associated with the sampling point and we want our estimate to be unbiased; E[ Z(B)- Ž(B)] = 0, and this is assured if the weights sum to 1: nΣi=1 λi = 1. The estimation variance at B is the expected square difference between our estimate and the true value, and is σ2E (B) = E[Z(B) - Ž(B)]2 = 2 nΣ
i=1
λi ŷ (xi,B) - nΣ
n i=1
Σ
j=1
λi λj y (xi,xj) – ŷ
(B,B)…..(2) Where y (xi,xj) is the semi-variance of the property between xi and xj, taking account of both the distance, xi - xj, separating them and the angle, ŷ (xi,B) is the average semi-variance within the block. Kriging thus provides not only unbiased estimates of minimum variance, but also a measure of estimation variance. In this respect it is superior to other methods of interpolation. The Kriging weight factors of n valid input points (i= 1,.., n) are found by solving the following matrix equation. This matrix equation can be written as a set of n+1 simultaneous equations: ΣI (wi * y (hik) ) + λ = y (hpi)
for k =1,……….., n
ΣI wI = 1 Where: hik is the distance between input point i and input point k, hpi is the distance between output point p and input point i, y (hik) is the value of the semi-variogram model for the distance hik , y (hpi) is the value of the semi-variogram model for the distance hpi, wi is the weight factor for input point i, λ is the Lagrange multiplier, which used to minimize possible estimation error. Figure (2-5) shows P lying one-third of a sampling interval from the bottom and right-hand side of grid cell. The sampling points are at the nodes of the
41
grid, and the nearest 16 points are shown. The values at the nodes are the weights. 0.006
0.032
0.095
0.180
-0.001
0.019
0.076
P
0.254
0.089
0.107
0.019
0.036 -0.002
0.006
Figure (2-5) The Weights for Kriging Stone Content at a point, P, at Plase Gogerddan Source: R. Webster, 1995.
0.079
0.0
2.3.4 Interpolation Methods of Soil Data More and more phenomena can be measured and might be involved in the spatial analysis. Among others we can mention the precipitation, temperature, soil parameters, ground water characteristics, pollution sources, and vegetation data. We are not able to measure the values of the particular phenomenon in all points of the sphere, but only in sample points. The interpolation gives us values in such points where we have no measurements. The goodness of interpolation can be characterized by the discrepancy of the interpolated value from the true value (Ferenc, 1998). Many of the following techniques require data that are equally spaced; the observations must be taken at regular intervals on a traverse or line. Of course, this often is not possible when dealing with natural phenomena over which you have little control. Many stratigraphic measurements, for example, are recorded bed-by-bed rather than foot-by-foot (Davis, 1986).
42
McBratney, et al. (2000) reported that a point interpolation performs an interpolation on randomly distributed point valued and returns regularly distributed point values, which also known as gridding. There are many point interpolation methods that can be used to estimate the unknown point. These methods are subdivided into three classes. The first depends on the classic statistics, the second depends on spatial correlation (Geostatistical analysis), and the third is based on combinations of the geostatistical and multivariate or univariate (CLORPT) methods (Classic Statistical). The point interpolation methods can be defined as following: - Nearest point: assigns to pixels the value, identifier or class name of the nearest point, according to Euclidean distance. This method is also called Nearest Neighbour or Thiessen. - Moving average: assigns to pixels weighted averaged point values. The weight factors for the points are calculated by a user- specified weight function. Furthermore, the weight functions are implemented in such a way that points which are farther away from an output pixel than a user-defined limiting distance obtain weight zero; this speeds up the calculation and prevents artifacts. - Trend surface: calculates pixel values by fitting one surface through all point values in the map. The surface may be of the first order up to the sixth order. A trend surface may give a general impression of the data. Surface fitting is performed by a least square fit. It might be a good idea to subtract the outcome of a trend surface from the original data, and calculate the residuals. - Moving surface: calculates a pixel value by fitting a surface for each output pixel through weighted point values. The weight factors for the points are calculated by a user-specified weight function. Weights may for instance approximately equal the inverse distance to an output pixel. The weight function ensures that points close to an output pixel obtain larger weights than points, which are farther away. Furthermore, the weight functions are
43
implemented in such a way that points which are farther away from an output pixel than a user-defined limiting distance obtain weight zero; this speeds up the calculation and prevents artifacts. Surface fitting is preformed by a last square fit. - Kriging: assigns to pixels weighted averaged point’s values, like the moving average operation. The weight factors in Kriging are determined by using a user-specified semi-variogram model (based on the output of the spatial correlation operation), the distribution of input points, are calculated in such a way that they minimize the estimation error in each output pixel. Two methods are available: Simple Kriging and Ordinary Kriging. The technique is derived from the theory of regionalized variables. - Anisotropic Kriging: calculates, estimates or predictions an optionally standard errors from point values similar to the Kriging operation but spatial dependencies (anisotropy) are taken into account. The direction of anisotropy can be investigated with the Variogram surface operation, than, by using the bidirectional method in spatial correlation to determine two semi-variogram models, for two perpendicular directions; the ranges of these semi-variogram models determine the ratio of anisotropy. - Universal Kriging: calculates, estimates or predictions an optionally standard errors from point values similar to the kriging operation but a local trend is taken into account. This local trend or drift is a continuous and slowly varying trend surface on top of which the variation to be interpolated is superimposed. The local trend is recomputed for each output pixel and the operation is therefore more similar to the moving average operation than to the trend surface operation. - Cokriging: calculates, estimates or predictions an optionally standard errors from point values for a poorly sampled variable (the predictand) with help of a well-sampled variable (the covariate). The variables should be highly correlated (positive or negative). Cokriging is a multi-variate variant of the Ordinary Kriging operation. We need to specify semi-variogram models for
44
the predictand and for the covariable, and a cross variogram model for the combination of both variables. All three models can be determined from the output table of the cross variogram operation. 2.3.5 The Geostatistical Techniques and Soils Survey Data Ramadan (1992) studied the soil variability of Dabaa-Fuka area in Egypt using 147 samples covering 100 km2 and applied the geostatistical analysis to his data. He reported that the semi-variogram was Gaussian for the sand content and soil depth; and was spherical for salinity and calcium carbonate content. Martinez and Zinck (1994) compared penetration resistance and bulk density between two grid sample areas, one under forest and another under pasture field, in the Colombian Amazonian. The fitting of the semi-variogram model was unsatisfactory because of the scattering of the sample data pairs, showing weak spatial dependence. In general, they concluded that there are large nugget effects, indicating that penetration resistance and bulk density values vary at distances smaller than the selected sampling intervals, especially in the pasture sample area. Leopold (1995) investigated the spatial variability of soil properties. In this thesis geostatistical techniques are applied for spatial analysis of the total contents of Cd, Cu, Ni, Pb and Zn in soil. Calculating the ‘traditional’ experimental semi-variogram function, which is related to the covariance function, mainly carries out the spatial analysis. Ordinary Kriging was performed for prediction of all 5 heavy metals. Jennifer (1996) reported that detecting soil properties are today of major interest due to various reasons such as preventing acidification of certain areas, detecting contaminated land areas, and optimizing agriculture and forestry. The problem associated with examining soil is the spatial variability of soil properties. Hence, a good interpolation method is needed to minimize the number of sampling points in a specified area. 45
Krivoruchko (1998) highlighted the advantages of using geostatistical methods for processing environmental data.
A large amount of data
concerning the ecological state of Belarus after the Chernobyl accident was analyzed using geostatistics. This paper has attempted to justify the use of geostatistical approaches for environmental monitoring and policy planning. The techniques presented can have a profound impact on decision making and policy development. Bourgaul, et al., (1999) reported that, most individuals think of soil as being homogeneous, but actually it is very heterogeneous. When the physical and chemical properties of soil are characterized, it is found that they are spatially variable, which is to say that the properties of soil vary considerably from one point to the next even within as small a distance as a few inches. This report presents a step by step case study of Geostatistics applied to a soil salinity data handled through a GIS of multivariate, spatially distributed data, where sparse hard (reliable) data coexist with abundant but softer (less reliable) information this approach provides a potential tool useful for modeling nonpoint source pollutants. Erian, et al., (1999) studied the effective soil depth including the hardpans, and available moisture content of 58 soil observation have been interpolated by using Ordinary Kriging technique to improve the quality of the soil map and to obtain geo-information products, so the efficiency and effectiveness of the soil survey interpretation can be improved. Erian and Yacoub (1999) showed that the effective depths of 317 observations were interpolated by using Ordinary Kriging. Analysis of variance (ANOVA) was used as a different approach to analyze the relation between the effective depth data and the different soil map units. The result of the interpolated map was compared with the satellite image visually to see how much it is acceptable.
46
Jönsson (1999) investigated the spatial statistical analysis of geochemical data in the soil of Asa experimental forest. The Kriging technique uses a weighted linear combination of known points to predict unknown points by minimizing the estimation error. The result suggests that the sampling grid used for detecting Ca should have minimum spacing of less than 2000 m when using the complete data set, whereas Ca data of excluded outliers suggests that minimum spacing should be less than 200 m. Furthermore minimum spacing for detecting Al should be less than 500 m and 200 m for K, Mg and Ti. The elements Fe, Mn, Na, Si and Zr have shown to need very high sampling densities. Renduo, et al, (1999) found that, using specific statistical techniques called Geostatistics, enabled them to reduce the error of estimating the soil nitrate distribution in large fields. They found also that, taking into account the correlation among nitrate contents at different depths further reduced the estimation errors. Serre (1999) reported that Classical Geostatistics methods have been designed to use mainly statistical knowledge about natural variables and they lack the ability to incorporate important forms of knowledge like physical laws and scientific theories into the mapping process. The hydraulic map thus obtained is physically meaningful as well as numerically more accurate than that obtained using classical methods (e.g., Kriging). Moreover, taking advantage of the Darcy law the Bayesian Maximum Entropy hydraulic head mapping can involve other related soil properties, like hydraulic conductivity. The approach leads to very accurate hydraulic head solutions, and may be also applied to study the inverse problem, in which one seeks to estimate hydraulic conductivity from hydraulic head measurements. Yacoub (1999) selected some soil properties for assessing land degradation in the newly reclaimed area in villages 20 and 21, the Sugar Beet Zone, Nubariya district, Alexandria, Egypt. The analysis of variance (ANOVA) was
47
carried out to test which soil properties differentiate better between the soil types. Geostatistical analysis was carried out to test the spatial structure of the soil properties. Selected soil properties were interpolated by Kriging method. Zhang, et al., (1999) stated that, nitrate-nitrogen is one of the most prevalent pollutants in the environment. Farmers to increase yields and profits and can be find its way into groundwater and surface water sources use it. They found that using specific statistical techniques, called Geostatistics, enabled them to reduce the error of estimating the soil nitrate distribution in large fields. They also found that taking into account the correlation among nitrate contents at different depths further reduced the estimation errors. Afifi, et al., (2000) evaluated the spatial variability of infiltration rate and sorptivity of calcareous soil. The tests were taken of grid system. Three transects starting from the same point, were laid down. The first, 185 m long, was sampled from W-E direction at 10 m intervals. The second transect extended from N-S direction for 220 m and sampled at 10-m distances. The third transect, 350 m long was laid down on the diagonal direction, i.e. from NW-SE and sampled and tested for infiltration rates at 14-m intervals. Meanwhile sorptivity tests were carried out at 5 m along the 1 st and 2nd transects and at 7 m along the 3rd one. From 12 auto-correlation and semivariogram for infiltration rate, and sorptivity, 4 relationships were highly significant (Spatial dependent), while the rest 8 ones were found to pure nugget effect (i.e. random behavior). The minimum number of samples required determining infiltration rate was 8. Apparently, these numbers are appreciably less than those obtained upon using the classical statistical technique, while in case of sorptivity the number of such were tests zero (i.e. pure nugget effect). Erian (2000) studied the impact of land quality limitations on community stabilization in the villages of El Hammam. The geostatistical analysis was used for mapping land qualities.
48
Erian, et al., (2000a) identified the current and potential land suitability for the most recommended forage crops in Sugar Bet Zone, Nubariya region. The accurate boundaries for the different land qualities such as the effective soil depths, soil salinity, and drought were first delineated - using the geostatistical analysis and than used for identifying the current suitability. Erian, et al., (2000b) applied geostatistical analysis to allocate relatively homogenous mapping units for the soils with Salic, Calcic, Petrocalcic, and Petrogypsic horizons in Sugar Beet and El Hammam areas. The models were applied on 526 soil observations in a grid system with spacing distance of 1000 meters. Also, presenting the crossing results between the different maps, which helped in obtaining the major taxonomic classes. Erian and Yacoub (2000) used the effective soil depth, soil salinity, and available moisture content data of the different villages of 526 observations for interpolated by using Ordinary Kriging. Correlation and regression analyses were performed, using the “SPSS” software. Analysis of variance (ANOVA) was used as different approach to analyze the relation between the different soil quality data and the different soil map units. The analysis of the above-mentioned aspects has been used to interpret the rate of stability in the different villages and identify factors promoting or suppressing the sustainability of these communities. Finke (2000) studied the spatial variability of soil structure and its impact on transport processes and some associated land qualities. This thesis treats the impact of soil spatial variability on spatial variability of simulated land quality. It was concluded, that different soil units within one agricultural field showed a different leaching response and crop yield response to identical fertilizer treatments, and that yield variability will increase when fertilizer levels approach the level for maximal production. A survey was undertaken to evaluate the safe use of low quality water for irrigation of highly calcareous soils at sewage waste station farm- New Burg 49
El Arab city, North West Coast (NWC), Egypt. The geo-statistical analysis showed that three semi-variogram models fitted the individual soil properties. The fitted models were Exponential for DTPA, Fe and Cl-; Spherical for DTPA (Zn, Ni, Mn) and Na+ while DTPA (Cu, Pb), EC and SAR were Gaussian. Semi-variogram model parameters showed that EC and heavy metals have the highest nugget variance. The Kriging map showed the spatial and temporal variability of heavy metals in the studied area, (Ramadan and El-Fayoumy, 2000). Whisler et al. (2000) illustrated that soil physical, hydrological, and chemical properties vary spatially in alluvial soils, especially as one moves from close to the stream bank to further away. The Kriging predicted soil and yield data may be used to differentiate between different soil types and to reduce the number of soil profiles needed to parameterize a variable field compared to the regular spacing grid sampling method. 2.4 Evaluation of Land Degradation 2.4.1 Effects of Management on Land degradation Land management evaluation can be useful for improving soil characteristics and in turn achieving the agriculture sustainability. Therefore, better soil management and conservation are essential to improve soil production, reduce soil degradation, and pollution (Beshay and Sallam, 2001). Numerous studies have demonstrated the importance of soil management and its effect on soil characteristics. Agbamu (1995) determined the adoption level of 11 soil management practices and the factors affecting them. The studies of Nagarajarao and Jayasree (1994) and Edwards et al. (1992) demonstrated that long-term soil management practices affect soil pH, organic matter, bulk density, and nutrient availability. Kobkiet et al. (1993) stated that the soil productivity and fertility degradations are mainly related to specific
soil
characteristics
and
applied
mismanagement
practices.
Panyachart (1986) studied the vital soil characteristics affecting cropping practices and concluded that the fertility should not considered as a major 50
factor affecting cropping practices in the studied area. However, he concluded that soil characteristics affecting cropping practices were soil texture and characteristics derived from soil development responding to topography. Several investigations in Egypt studied the effect of land management on some chemical and physical properties (El-Shinnawy et al. 1986 and Omar et al. 1990). Agro-management practices developed by the local farmers for sand dunes cultivated at the northern coast of Egypt were described by Beltagy et al. (1990). Rabie et al. (1988) studied the changes in sandy soil properties as a result of man’s activity. They reported that, the changes included the distinction of weak surface horizons with relatively high percentages of fine particles, increase in soil organic matter content, increase in CEC and a decrease in soil salinity. Noaman and Sheta (1988) found in their study on irrigated dried lake soils that the surface soil salinity decreased after two years of cultivation and no clear changes in either texture or the contents of amorphous Si and Al, occurred. In conclusion we can said that the effects of management on land degradation come through the disturbance of the water and air balance. To study area under a certain irrigation system, therefore, needs to know the effectiveness and efficiency of the irrigation and drainage systems, which will affect the water and air balance. Climate, crop types, irrigation and drainage systems, soil types and soil topography are the main factors, which affected the water and air balance and in turn lead to land degradation. Moreover, the idea of land degradation can not be separated from the sustainability. Therefore, it depends on the properties of both the resource and the way it is managed. The quality of the resources that renders its use sustainable is its resilience. But resilience can also defined for a particular form of use. Damaged resilience can of course be recovered; even the most degraded soil could be rehabilitated if large amount of capital technology were available.
51
2.4.2 Global Assessment of Desertification (GLASOD) Assessing and monitoring desertification has to take practical as well as scientific factors into consideration (David and Nicholas, 1996). There are five principal processes of land degradation: vegetation degradation, water erosion, wind erosion, salinization, Waterlogging, soil crusting and compaction. Depletion of soil organic matter is a type of degradation that affects most rain-feed croplands and many rangelands in the arid regions (Lal and Stewart, 1998). To quantitatively determine the land degradation process, the two inter connected parameters, (a) degree of aridization of vegetation and (b) degree of aridization of soils should be taken as the basis for the determination. Two different methods may be used: (a) Comparison of the state of the same area at different time and (b) Comparison of the state of two different areas at same time (Balba, 1995). Better assessment of land degradation can be made by monitoring small sample areas within the major ecosystems of the world, then extrapolating the results to the broader area (Lal and Stewart, 1998). Since the 1970s there has been an international recognition for the need to a global assessment of land degradation. Although statements that soil erosion is undermining the future prosperity of mankind hold an element of truth, these statements do not help planners to know where the problem is serious and where it is not (Dregne et al, 1986). The immediate objective of the GLASOD (Global Assessment of Desertification) project was; “Strengthening the awareness of decision makers and policy makers on the dangers resulting from inappropriate land and soil management to the global well being, and leading to a basis for the establishment of priorities for action programs” (Oldeman, 1994). General guidelines were prepared for the assessment of soil degradation in order to ensure a certain degree of uniformity in reporting (Oldeman, 1988). The final list of recognized soil degradation types to be included in the world map was restricted to twelve types (see Table 2-6).
52
Table (2-6) list of recognized soil degradation types and codes. Type Water erosion Wind erosion
Chemical deterioration
Physical deterioration
Cause
Code
Loss of top soil Terrain deformation Loss of top soil Terrain deformation Over-blowing Loss of nutrients and/or organic matter Pollution Salinization Alklinization Acidification Compaction, sealing and crusting Waterlogging Subsidence of organic soils
Wt Wd Et Ed Eo Cn Cp Cs Ck Ca Pc Pw Ps
2.4.2.1 Soil Degradation Status (FAO)
The status of the degradation process is characterized by the degree of soil degradation. This qualitative expert estimate was related to observed changes in the agricultural suitability, declined productivity, possibilities for restoration and in some cases related to the biotic functions. FAO, (1978) determined classes to measure the status of degradation severity and it will be recorded in the chapter of Material and methods. 2.4.2.2 Extent of Soil Degradation (GLASOD)
For each soil degradation type, the relative frequency of occurrence within the delineated mapping unit is given in GLASOD according to the following five classes: Infrequent: up to 5% of the mapping unit is affected, Common: 6 to 10% of the mapping unit is affected, Frequent: 11 to 25% of the mapping unit is affected, Very frequent: 26 to 50 % of the mapping unit is affected, Dominant: over 50% of the mapping unit is affected.
2.4.2.3 Overall Severity Level of Land Degradation (GLASOD)
The severity level of soil degradation in GLASOD is by cartographic necessity an aggregation of the degree and relative extent of the soil
53
degradation process. Table (2-7) shows the severity of soil degradation according to the GLASOD approach. Table (2-7) Severity of soil degradation, GLASOD approach Degree of Soil Degradation
Frequency of Soil Degradation Infrequent
Common
Frequent
Very frequent
Dominant
Slight
Slight
Slight
Medium
Medium
High
Moderate
Slight
Medium
High
High
Very high
High
Medium
High
High
Very high
Very high
Very High
Medium
High
Very high
Very high
Very high
2.5 Agriculture Drainage Systems According to Oosterbaan (1994) agricultural drainage systems are systems which make it easier for water to flow over the land, so that agriculture can benefit from the subsequently reduces water levels. The system can be made to ease the flow of water over the soil surface or through the underground, which leads to a distinction between surface and subsurface drainage system. ICID (1982) defined the surface drainage as the diversion or orderly removal of excess water from the surface of land by means of improved natural or constructed channels, supplemented when necessary by shaping and grading of the land surface to such channels. Subsurface drainage aims at by controlling the water table, a control that can be achieved by tubewell drainage, open drains or subsurface drains (Cavelaars et al. 1994). Both surface and subsurface drainage systems need an internal or field drainage system, and an external or main drainage system. The function of the field system is to control the water-table, where as the function of the main drainage system is to collect, transport, and dispose of the water through and out-fall or outlet (Oosterbaan, 1994). 2.5.1 Ground water flow into drains 2.5.1.1Steady state equations.
54
This is the typical situation in area with a humid climate and prolonged periods of fairly uniform medium-intensity rainfall. The steady-state theory based on the assumption that the rate of recharge to the groundwater is uniform and steady and that it equals the discharge through the drainage system. Thus the water table remains at the same height as long as the recharge continues. Lovell and Youngs (1984) reported that the best drainage equation to describe the flow of groundwater to the drains in the steady state was the Hooghoudt equation. The equations are also used to calculate the drain spacing. Ritzema (1994) reported that the Hooghoudt equation considers a steady-state flow to vertically walled open drains reaching an impervious layer. The Hooghoudt equation could be summarized as the following: Q = (8KDH + 4KH2)/L2 Where: Q = drain discharge (m2/day) L = drain spacing (m) K = hydraulic conductivity of the soil (m/day) D = elevation of the water level in the drain (m) H = elevation of the water level midway between the drains (m)
If the soil profile consists of two layers with different hydraulic conductivity, and if the drain level is at the interface between the soil layers, the equation could be rewritten as: Q = (8KbDH + 4KtH2)/L2 Where: K b = hydraulic conductivity of the soil layer below the drain level (m/d) K t = hydraulic conductivity of the soil layer above the drain level (m/d)
This situation is quiet common; the soil above the drain level is often being more permeable than below drain level. Because the soil structure above the drain level has been improved by the periodic wetting and drying of the soil, resulting in the formation of cracks and by the presence of roots, microorganism, micro fauna, etc.
55
Hooghoudt (1940) reported that if the pipe or open drains do not reach the impervious layer, the flow lines would converge towards the drain and will thus no longer be horizontal. Consequently, the flow lines are longer and extra head loss is required to have the same volume of water flowing into the drains. This extra head loss results in higher water table. Therefore he introduced two simplifications to be able to use the concept of horizontal flow (Figure 2-6). He assumed an imaginary impervious layer above the real one, which decreases thickness of the layer through which the water flows towards the drains and replaced the drains by imaginary ditches with their bottoms on the imaginary impervious layer. Based on these assumptions, he was able to use the previously mentioned equation to express the flow towards the drains, simply by replacing the actual depth to the impervious layer (D) with a smaller equivalent depth (d). This equivalent depth (d) represents the imaginary thinner soil layer through which the same amount of water will flow per unit time as the actual situation.
Figure (2-6): The Concept of The Equivalent Depth, D, To Transform A Combination of Horizontal and Radial Flow (A) Into an Equivalent Horizontal Flow (B)
This higher flow per unit area introduces an extra head loss which accounts for the head loss caused by the converging flow lines. Hence the Hooghoudt equation could be rewritten as:
56
Q = (8KbDdH + 4KtH2)/L2
To calculate the equivalent depth Hooghoudt derived a relationship between equivalent depth (d) and. respectively, the spacing (L), the depth to the impervious layer (D), and the radius of the drain (r0). He prepared tables for the most on sizes of drainpipes from which the equivalent depth (d) can be read directly. 2.5.2 The Ernst Equation According to Ritzema (1994) the Ernst equation has an advantage over the Hooghoudt equation because it could be applicable to any type of twolayered soil profile not just if the soil profile was homogenous or if the interface between the two layered soil profile coincides with the drain level. He also added that the Ernst Equation is especially useful when the top layer has a considerably lower hydraulic conductivity than the bottom layer. Ernst (1956, 1962) presented his equation to obtain a generally applicable solution for soil profile consisting of layers with different hydraulic conductivities. He divided the flow to the drains into a vertical, a horizontal, and a radial component (Figure 2-7). Consequently the total available head (h) can be divided into a head loss caused by the vertical flow (hv). The horizontal flow (hh), and the radial flow (hr). h= hv + hh + hr
57
Figure (2-7): Geometry of Two-Dimensional Flow Towards Drains
2.5.3 Field Drains and Field Laterals Sevenhuijsen (1994) indicated that to prevent pounding in low spots, surface runoff from fields needs to be collected and orated through field drains and field laterals towards the drainage outlet of the area. 2.5.3.1Field Drains
According to ICID (1982) a field surface drain is a shallow graded channel, usually with a relatively flat slope, which collects water within a field. Field drains for a surface drainage system have to allow farm equipment to cross them and are easy to maintain with ordinary mowers. Field drains are shallow and have flat side slopes. They can often be constructed with land planes as used in land forming. Smedema and Rycroft (1983) reported that simple field drains are V shaped or W shaped and the recommended dimensions of such drains. Dimensions for V-shaped drains also apply for the W-shaped drain Sevenhuijsen (1994) added that the dimensions of V-shaped field drains are determined by the construction equipment, maintenance needs, and cross ability for farm equipment. Side slopes not be steeper than 6 to I. He also
58
mentioned that the W-shaped field drain is applicable where a farm road is required between the drains. These ditches are generally farmed through and upper slopes may well be planted. They should be cleaned before the drainage (e.g. with a shovel or a V-drag). A small furrow drain is often installed in the center to ensure that the ditch is dry in sufficient time for tractors to pass through. All field drains should be graded towards the lateral drain with grades between 1 and 0.30. 2.5.3.2Field Laterals
According to ICID (1982) field lateral is the principle ditch for field or farm areas adjacent to it. Field laterals receive water from row drains, field drains and in some areas from field surfaces. Sevenhuijsen (1994) stated that Field laterals collect water from field drains and transport it to the main drainage system. In contrast to the field drain, the cross-section of field laterals should be designed to meet the required discharge capacity. Besides the discharge capacity, the design should take into consideration that in some cases surface runoff from adjacent fields also collects directly in the lateral, requiring a more gentle side slope. He also added that field laterals are usually constructed by different machinery than field drains (i.e. excavators instead of land planes). Field laterals less than 1 m deep is usually constructed with motor graders or dozers. The soil is placed near either side of the lateral. Scrapers are needed when the excavated soil is to be transported some distance away. Under wet conditions, excavators are used. Maintenance requirements should be considered during design; for example, if the field laterals are to be maintained by mowing, side slopes should not be steeper than 3 to I. Special attention should be given to the transition between field drains and laterals because differences in depth might cause erosion at those places. For discharges below 0.03 m3/s, pipes are suitable means of protecting those places. For higher discharges open drop structures are recommended.
59
The recommended dimensions for field laterals according to the ASAE (1980) are shown in Table (2-8) Table (2-8) the recommended dimensions for field laterals Type of drain
Depth (m)
V-shaped
0.3
to
V-shaped
>
0.6
Trapezoidal
0.3
to
Trapezoidal
>
1.0
0.6
1.0
Recommended side slope (horz:vert) 6 : 1
Maximum side slope (horz:vert) 3 : 1
4 : 1
3 : 1
4 : 1
2 : 1
1.5 : 1
1 : 1
2.5.4 Lay-out of Field Drains and Laterals Two typical systems of layout are applied in distinct situations: The random field drainage system; and the parallel field drainage system. 2.5.4.1Random Field Drainage System
This drainage system is applied where a number of depressions are distributed at random over a field. Often these depressions are large but shallow, and a complete land-forming operation is not (yet) considered economically feasible. The random field drainage system connects the depressions by means of a field drain and evacuates the stagnant water into a field lateral. To allow mechanized farming operations, the drains are shaped as described in the previous sub-sections. The system is often applied in situations where farm operations are limited (e.g. on pastureland) or where mechanization is realized by means of small equipment. It is important that the spoil from the field drains does not hamper the surface flow from the areas between the connected depressions. The spoil can be used to fill up low areas further away from the field drain. In conditions where the permeability of the soil allows subsurface drainage, the random field drainage system can also be useful in improving the root zone condition in low pockets that would otherwise require additional measures. In general, a random field drainage system is not expensive and suits extensive
60
land use. If intensive farming develops, however, the system needs to be replaced by a parallel field drainage system. 2.5.4.2Parallel Field Drainage System
The parallel field drainage system, in combination with proper land forming, is the most effective method of surface drainage. The system is applicable in flat areas with an irregular micro-topography and where farm operations require regular shaped fields. The parallel, but not necessarily equidistant, field drains collect the surface runoff and discharges it into the field lateral, through which the water flows towards the main drainage system. The spacing of the field drains depends on the size of lands that can be prepared and harvested economically, on the water tolerance of crops, and on the amount and the cost of land forming.
61
3
AREA DESCRIPTION
3.1 Location The study area is located in the northwestern part of the Nile delta in Nubariya District in Egypt (Figure 3-1). It is bounded to the west by the Alexandria-Cairo desert road between 75 and 85 km from Alexandria city, to the east by El Nubariya canal, El Nasr canal from the northern part, and Gabel Naaum from southern part. The area is divided into two settlement stages; El Bustan one is sub-divided into groups of 6 villages and El Bustan two is subdivided into groups of 5 villages, with total areas about 48,500 feddans. The villages of El Bustan I were Adbas al Aqqad, Tawfiq el Hakim, Ali Bin Abi Talib, Hafiz Ibrahium, Abdel Megiad Slime, and Asheakh el Shishai. The villages of El Bustan II were Muhamed Rifaat, Abdel Munim Riyad, Al Immam al Hussayn, Al Immam al Ghazaly, and Amed Rami. The area is located approximately between latitudes 30 11' 36" N and 30 43' 12" N, and longitudes between 30 23' 19" E and 30 40' 23" E. Land elevation of the studied area ranged between 5 meters above sea level (asl) in the east and 35 meters (asl) in the west, with an average east-west slope of 0.17%. The northwestern and the central parts are almost flat since the slope does not exceed than 0.05%. 3.2 Climate 3.2.1 Atmosphere Climate The area has a Mediterranean climate, characterized by rainy winter and prolonged hot and dry summer. According to Koppen's classification, the climate of the region is the hot desert type. The mean annual temperature is 19.2 C. The maximum monthly temperature is 30.3 C in August and the minimum temperature is 6.3 C in January.Annual rainfall is low (104 mm) and most of the precipitation falls in winter (between October and March). Figure (3-2) shows the relation between precipitation, temperature and evapotranspiration.
62
Figure (3-1) The General Location of the Studied Area
Precipitation, Temperature and Evapotranspiration diagrams of Sugar Beet Zone. Precipitation 35.00
200.00 180.00
30.00 160.00 140.00 120.00
20.00
100.00 15.00
80.00 60.00
10.00
40.00 5.00 20.00 0.00
0.00 JAN
FEB
MAR
APR
MAY
JUN
JUL
AUG
SEP
OCT
NOV
Months Temperature Average
Precipitation
Evapotranspiration.
Figure 3.2 shows the relation between precipitation, temperature and evapotranspiration.
63
DEC
Evapotranspiration
Temperature
25.00
The relative humidity ranges between 59% and 81%, within average of 69%. The lowest values were recorded in April and June, while the highest values were recorded in January, July, August and September. In summer the north trade wind comes from the Mediterranean Sea bringing moisture with it. During the period from February to July the Khamaseen wind, coming from the southwest direction, from the vast area of Western Desert, prevails. The maximum evapotranspiration is noticed in the warmer and dryer months, where it reaches up to 183 mm per month in June and July. The lowest value was recorded in January with an evapotranspiration rate of 39 mm per month. The growing period is from the middle of November till end of January. The Meteorological data of El Bustan station, which is located at 30 54` N, 29 33` E and elevation 25m A.S.L. The meteorological data of El Bustan area are shown in Table (3-1). Table (3-1) The Average Climatic Data of the Study Area (Source: CNE, 1990). Month January February March April May June July August September October November December Annual average
Temperature mean
Soil Temp. 50 cm depth
Precipitation mm
Relative Humidity
Evapotransp iration mm
Aridity Index (ID)
12 13 14 18 21 24 25 26 25 22 18 14
15 16 19 23 27 31 32 32 31 27 22 18
33 9 17 0 0 0 0 0 0 1 28 16
81 68 63 59 64 61 71 70 66 64 65 61
39 64 102 146 157 182 183 176 145 112 66 58
0.85 0.14 0.17 0.00 0.00 0.00 0.00 0.00 0.00 0.01 0.42 0.28
19
24
104
69
1430
0.07
Mean winter of soil temperature=17.85, Mean summer of soil temperature=31.26, Difference=13.41.
3.2.2 Soil Climate Soil moisture regime and soil temperature regimes are based on the meteorological data of Borg El Arab station. The soil moisture regime in study area is Torric or Aridic. According to Soil Taxonomy 1999 definition of the Torric or Aridic soil moisture regime through the moisture control section is as follows: 64
1- Is dry in all parts for more than half the cumulative days per year when the soil temperature at depth of 50 cm from the soil surface is above 5º C. 2- Is moist in some or all parts for less than 90 consecutive days when the soil temperature at a depth of 50 cm is above 8ºC.
The soil temperature regime in study area is Hyperthermic. The Hyperthermic soil temperature regime has the following: 1- The mean annual soil temperature is 22ºC or higher. 2- The difference between mean summer and mean winter soil temperatures is more than 5ºC at a depth of 50 cm from the soil surface.
3.3 Geology and Geomorphology Many workers have intensively studied the geological history of this region. The present land forms has been developed on an old sea floor of early Pleistocene age during a succession of high and low sea levels. Offshore sandbanks developed during the period of high sea level and subsequently become coastal barriers during the following low sea level period. In the next rise of sea level, which, however did not come as high as the former one, Li Horal deposits accumulated over this sandbank and behind his barriers. These sediments consisted mainly of carbonate rocks and marl to calcareous sandstone. The Recent and Holocene eolian sand and fluviatile loams were most noticeable in the southern part of the area. Late Pleistocene marine deposits were exemplified by the oolitic limestone distributed along the coast of the Mediterranean, west of Alexandria. These formations occur in chains extending parallel to the coast. Pleistocene limestone ridges are probably marine coastal beach ridges formed by successive high sea level. According to the geological map (EGPC, 1988), El Bustan I &II were fall in two geologic units in the Quaternary age, which are, stabilized dunes (Qds) covered most of the studied area and undifferentiated Quaternary deposits, alluvial fan, wadi deposits, sand, gravel, resent coastal deposits. Figure 3-3 shows the geologic units of the studied area (source: geological map of Egypt, EGPC, 1988).
65
Figure 3-3 The Geological Units of the Studied Area
The Western Desert, stretching over an extensive area of about 681, 000 km2, is a plateau desert with flat expanses of rocky ground and numerous extensive and deep closed-in depressions (Ball, 1939, and Said, 1962). The plateau of Eocene limestone rises in places over 500 meters above sea level. The Western Desert is composed of number of erosion surfaces, some of which are barren and appear as level surfaces of solid rocks and others, which are buried under blow sand (Said 1962). FAO (1964) showed that the region northwest of the Nile Delta could be geomorphologicaly subdivided into two main units: medium high to low dunes and plains The medium high to low dunes The dunes have been formed by wind action where there was not enough gravel to protect the loose sands from wind erosion and transport. The development of Wind-Blown sand to the north and northwest of deltaic soils of the various terraces indicate that the original landscape is deltaic. It has been recognized that loamy soils occurring in the low parts of the Valleys between individual dunes and in several cases these loamy deposits do not occur under dune sands.
66
Plains The plain extending almost to the sea, is divided into two parts by the presence of rocky ridge, which represents the long-shore bank of an old coast line, formed during period of marine transgressing and probably at the same time as oldest terraces. The formation of long-shore banks was repeated several times during alternating periods of marine transgression and regression during the Pleistocene and new coastal barriers were formed successively further north and with a tendency to extend progressively further to the east. No doubt, the estuary behind the oldest ridge would have been more subjected to marine influence than the narrower areas between successive ridges. Conditions in the latter situations must have promoted the deposition of heavier textured sediments during aggregation stage and at the same time protected earlier deposits better against erosion during subsequent degradation stages. This would explain why the loamy soils south-east of the oldest ridge are more sandy, the sand fraction coarser and with numerous sheets of wind-blown sand, than the soils to the north-west of this ridge, which are fine sandy to silty and of heavier texture. Abu El-Izz (1971) noticed that the erosion is able to form pediment alluvial plains along the margins of the three rocky plateaus, which constitute the Western Desert. These are the plains known as "bajadas" in arid and semi-arid regions. The pediments merge together and blend as well into the cuesta wells. 3.4 General Characterization of the Soils 3.4.1 Soil according Master plan For the most part of the soils, consist of sands at the surface underlain by sands with a compacted calcium carbonate layer 20 – 30 cm thick at 60 – 70 cm below the surface. Sand and sandy textured soils having a hydraulic conductivity of 0.2 m/d or greater underlie the compacted layer. The 1985 reconnaissance soil and land capability survey at a scale of 1:250,000 under taken from the land master plan shows soils mapping units Du18/4, Ds/4 and
67
Ds11/3 in El Bustan area and Du18/4 in the adjacent west El Nubariya area. A description of the mapping units is given below according Euroconsult, 1992 (see Table 3-2). In 1995, a number of water-table observations have been made in open auger holes through the area at a density of around 1 observation per 1,500 feddan in El Bustan area. The investigation shows a high water table across much of the area, it show the percentages of given water-table depth in El Bustan 60% of the observed water-tables depth were at 0.8 meter depth or less in the area of Bustan surveyed (EX3305, 1995). Table (3-2) The description of the mapping units according Euroconsult, 1992 Soil mapping unit
Land capability classes
Description
Ds
4
Loose sand soils, medium and low dunes
Ds11
3
Coarse sandy loam to clay loam soils on subsoil, low and medium dunes to 30-40% of the area
Ds25
6
Predominantly medium to high dunes
4
Loose sandy soils of undifferentiated sheets of windblown sand predominantly moderately deep over clay loam subsoil, with CaCO3 cemented layer in parts over coarse sand loamy-clay loam subsoil.
Du18
Source land master plan, reconnaissance soil and land capability map of west of delta, drawing 2A, sheet 2 of 3, Euroconsult, October 1985.
3.4.2 Initial Soil Characteristics of Year 1986 During January 1984 to June 1986, the Ministry of Land Reclamation, Authority for Rehabilitation Projects and Agriculture Development were done the semi-detail soil survey of El-Bustan area using topographic maps scale 1:25,000 and dug profiles in grid system with 500 meters intervals (ARPAD, 1986). In total 644 observation points were examined morphological, chemical, and physical analysis. The results of all reports can be concluded in the coming points (GARDAP, 1986a&b). 3.4.2.1 The Morphological Features
The general information were described the studied area, such as surface topography, slope, gravel, stone, nature vegetation, and the present of sand
68
dunes and its height. Also they studied the morphological characteristics of the profiles and described it from their colors, texture, structure, plasticity, gravel and stone percent, gypsum and calcium accumulation, mottling and profiles depth. The result of create geomorphic mapping units from the DTM’s show that, the area was classified under two main units and subdivided to 6 units. The first group was the flat areas and subdivided to flat cover by thick sand sheet (PL211), flat cover by thin sand sheet (PL212), and depression areas (PL213). The second unit was sand dunes areas and subdivided to longitudinal sand dunes (PL311), pyramidal sand dunes (PL312), and depression areas (PL313). The results of the morphological studies of the two main units as following: Flat areas (PL211, PL212, and PL213) This soil was flat to almost flat with some little nature-deserted vegetation on the surface. The gravel percent is few and fine in the surface, in addition to the presence of some seashells. These soils were coarse or fine sandy along the soil profile. The effective soil depth was very deep (more than 150 cm from the surface) and there is no hard pan or compacted layers until this depth (150 cm). Soil texture was sandy from surface to depth ranged from 50 – 100 cm and then loam sandy texture was up to 150 cm. Soil colors were ranged between yellow, yellowish brown, up to grayish. The plasticity of these soils were generally low in the surface layers and higher in the loam sandy layers. These soils were well drained and the water holding capacity was low, but it is higher in the loam sandy layers. Sand dunes areas (PL311, PL312, and PL313) These soils were similar to the flat sandy soil (S), but it was different in the surface topography. The sloping percent was 2% - 5% from the south direction to the north direction. The surface layers were coarse sandy soils and there is relatively high percent of the grass and small trees in these types of soils. The gravel percent is few and fine in the surface, with some naturedeserted grass on the surface. The effective soil depth was very deep (more
69
than 150 cm from the surface) and there is no hard pan or compacted layers until this depth (150 cm). Soil colors were ranged between yellow, yellowish brown, up to brown. Calcium carbonate was low in the soils and there is no gypsum accumulation in the profile layers. The plasticity of these soils were generally low, but in the layers which have some calcium carbonate soft or hard, the plasticity was increased. These soils were well-drained condition and the water holding capacity was low. 3.4.2.2The Chemical Analyses
The pH value was determined in the saturated paste soil sample and it ranged between 7.45 up to 8.95, but the coarse soil texture prevent the effect alkalinity with the lower EC value. The total soluble salts were determined in dS/m at 25 ˚C. these soils classified as non-saline soil where the EC was less than 4 dS/m, but there small areas classified as moderate saline soil and the EC was ranged between 7 – 13 dS/m. The soluble cations were determined in the extracted saturated past soil sample, such as Ca++, Mg++, Na+, and K+. The calcium cation was the dominant cation compared by the Na. The soluble anions were determined in the extracted saturated past soil sample, such as CO3--, HCO3-, Cl-, and SO4--. The Cl- anion was the dominant anion compared by the HCO3- and the SO4--, the carbonate was disappeared. The total calcium carbonate were determined using the Calcimeter. The results show that the soil content less than 5%, but there was some areas the total calcium carbonate were ranged from 5% up to 12%. 3.4.2.3The Physical Analysis
The water holding capacity was determined to the representative profiles and it was ranged between 15% up to 23% in sandy soils and between 26% up to 32% in the loam sandy soils. The particle size distribution was done to determine clay, silt, and sand % using the hydrometer method. The results show that: In the sand dune soils, the sand percent was ranged between 87.5% up to 99%, the silt percent was ranged from 2% up to 12.5%, and the clay percent
70
was up to 5%. In the flat soils, the sand percent was ranged between 77.5% up to 85%, the silt percent was ranged from 5% up to 15%, and the clay percent was up to 10%. The field capacity, available water content, and wilting point were studied to the representative profiles. The results show that, the field capacity was ranged between 13.8% to 15.9%, the available water content was ranged between 10.5% up to 12.3%, and the wilting point was ranged from 3.3% up to 4.2%. The bulk density was from 1.66 up to 1.82 m/cm3. From the previous studies, all these soils were coarse textural soils and the coarse and fine sand was the dominant particle size distribution. According to the Soil Taxonomy (1999), these soils were classified as Entisols order and Typic Torripsamments as sub great group. 3.5 Hydrology According to Ezzat et al., (1978), groundwater occurs in an aquifer of Pleistocene and recent deposits. The aquifer is underlain by a thick layer of Pleistocene clay. The salinity of groundwater differs widely according to location. It reaches 1,000 PPM near Kom Hamada and the eastern part of Wadi EL-Natrun , 2,500 PPM along the Cairo Alexandria desert road, 4,000 PPM west Wadi EL-Natrun
and 20,000 ppm at Alam Shaltut. The
hydrogeological map of Egypt (RIGW, 1992), shows groundwater salinity in west Nubariya up to a maximum value of about 5,000 PPM, higher than in the surrounding areas. Therefore, the aquifer can be considered as a ground water basin retaining any water flowing into it, so that after a period of time, excess water lost by deep percolation would cause the water table eventually to rise to the surface. The ministry of agricultural of land reclamation tries to prevent the use of poor quality of groundwater by farmers on canal water in available in reasonable amounts. Some wells constructed south of El-Bustan area yield a discharge of up to 100 Vs with a water quality of about 1,000 PPM, comparable to the maximum salinity of the canal water.
71
3.6 Irrigation and Drainage El Nubariya canal provides irrigation water for all the areas west of the canal. The water is brought from the river Nile. El Nasr canal is a concrete lined branch from the Nubariya, which provided water for El Nubariya, Sugar Beet and El Bustan areas. The salinity of the Nile water ranges between 1,100 ppm and 1,165 ppm. Sprinkler and drip irrigation systems were assumed in the original and also in the recent system designs for irrigated El Bustan I & II. However, systems are performing inefficiently owing to defective equipment and farmers lack of knowledge concerning crop water needs. Some small settlers have changed from modern irrigation methods to flood irrigation, the traditional method of the old lands, reportedly because of maintenance problems with modern equipment. El Bustan I & II were design without drainage network due to the sandy soils which covers the area. The present secondary and minor drainage network is in poor condition in many parts of the area. The water table has risen to within 150 cm of the surface in some parts of the area causing water logging and secondary salinization. The salinity of the drainage water ranges between 2,176 ppm and 4,288 ppm and drainage network is now urgently needed in these areas. 3.7 Vegetation and Land Use The presence of vegetation and density are more or less related to amount of rainfall received. Locations, which receive more than 20mm rainfall per year, are occupied with Artemisia monosperma, Pityranthus tortuous, Thymeleae hirsuta and Convolvulus lavatus. Hanna (1969) noted that the natural vegetation in desertic Fayoum-Alexandria areas mainly consists of Xerophytes. Crysanthemum ceronaricum seems to be the most common plant (Erian, 1990). The main field crops in the area are wheat, maize, Egyptian clover, and sunflower. The most important fruit crops in the area are grapes, pears, citrus, and apple. Vegetables, i.e., Tomato and Pepper, are also cultivated. In Table (3-6) shows the field crops in summer and winter seasons of the studied area. 72
Table (3-6) the typical cropping pattern for the studied area Season Summer
Winter
Crop Groundnuts Maize Vegetables Wheat, Barley Berseem Beans Vegetables
Proportion total area % 60 30 10 70 20 10
Source: Report EX3305, 1995.
3.8 Previous Studies Osman, Ramadan, Gomaa, and Khalifa (2000) studied during the 1998/99 winter season to determine the status of water table and its quality for reuse in irrigation, morphological features of the impermeable layer in some areas in West Nubaria sector, and to evaluate the zone of water logging in three villages (Abou Bakr, Al-Adl and Taha Hussain) at the East-Desert Road area. Networks of eight observation wells were installed in a grid system (300 x 300 m) to cover the study area. Soil samples were collected on a 0.5 m interval down to the impermeable layer to determine soil texture, pH, ECe, CaCO3, and cations and anion contents. Field maps using Kriging technique were produced for the soil surface, depth of the impermeable layer, and water table depth. The maps were used to locate the proper sites for the installation of field drainage network in the area to solve the Waterlogging problem. Abdel_Kader et al. (1998), reported that the soil classification of west Nubaria and El-Bustan 1&2 according soil survey staff (1966), were Typic Torripsamments and Typic Aquisalids. Atef et al., (1998a) reported that in some areas of El-Bustan 1&2, drainage problems could be caused by a perched water table. The water table may be relatively deep, but a hard pan in the soil profile creates a local water table above that layer. The existed water table at El-Bustan 1&2 west Nubariya is considered a perched water table.
73
Atef et al., (1998b) reported that the impermeable layer at the waterlogged areas is ranged between 1.5 to 4 meters deep from the land surface. Sayed et al. (1998) studied the risk assessment of waterlogging problem at El-Bustan 1&2 areas, Egypt. They concluded that the main causes of shallow water table and waterlogging problems were identified to be the presence of impermeable layer close to the soil surface, seepage from irrigation canals, use of surface irrigation system and inadequate drainage system in the area. Abdel Samiaa, (1996) reported that in 1996 waterlogging areas and salt crust appear in some area in El Bustan 1&2 due to some problems in the area, which force some farmers and graduated holders to change the modern irrigation systems to flooding irrigation system. He reported also that, some farmers and graduated people takeoff the sub ground pipes out and made a small canal for irrigating there land especial which is far from branch 12. He attached the drainage systems map of the department or drain in Damanhour City for el Bustan areas.
74
4
MATERIALS AND METHODS
4.1 Materials The materials used for this research are the following: 1- Topographic maps: a- Topographic maps of An-Nubariyyah (sheet NH36-I4a), Jabal Na’um (sheet NH36-I4b), Abu alMatamir (sheet NH36-I4c), and Hawsh Isa (sheet NH36-I4d) at scale 1: 50,000, edition by Egyptian General Survey Authority 1996, based on aerial photographs of 1990-91(EGSA, 1996). b- Topographic map of Jabal Na’um at, sheet NH36.I4b scale 1: 50,000, edition by military survey authority 1984, based on soil survey 1970 (MSA, 1984). c- Topographic map of Abu al-Matamir, sheet NH36-I4 at scale 1: 100,000, edition by military survey authority 1988, based on soil survey 1970, 1976 and aerial photographs of 1975 (MSA, 1988). 2- Semi-detail soil survey reports of El-Bustan area, west Nubariya, done by the General Authority for Reclamation and Development Agricultural Projects, the General Department of Soil Studies (GARDAP, 1986a). The first stage was done during December 1984 to April 1986, which were distributed for Mousahma El Bihara company (6500 feddans), Wadi Komombo company (5000 feddans), the General company (6500 feddans), and El-Arabiya company (6500 feddans). 3- Semi-detail soil survey reports of El-Bustan area, west Nubariya, done by the General Authority for Reclamation and Development Agricultural Projects, the General Department of Soil studies (GARDAP, 1986b). Second stage was done during January 1984 to June 1986, which were distributed for Mousahma El Bihara company (6650 feddans), Wadi Komombo company (3600 feddans), El-Aakariya company (5100 feddans), and El-Arabiya company (4400 feddans). 4- Landsat TM data: a- Landsat TM data acquired in July 1990, True color of Bands, 7,4,2. b- Landsat TM data acquired in August 1997, Bands (1- 7). c- Landsat TM data acquired in December 1999, Bands (1- 7). 5- Data on climate and natural resources from reports. 6- Other information:
a- Land cover Map of Egypt at scale 1: 100,000 of sheet Abu El-Matamir, produced by SYSAME with the participation of the SWRI, in the framework of the ALIS Project (Agricultural Land Information System of Egypt), financed by the French government, based on SPOT Image and topographic maps at scale 1: 100,000 (1991) b- Geological map of Egypt at, sheet NH36NW Cairo scale 1: 500, 000, printed in Germany1988, with cooperation of the Egyptian General Petroleum Corporation (EGPC, 1988). c- Hydrogeological Map of Egypt at scale 1: 500, 000, Nile Delta, first edition 1992, published by Research Institute for Groundwater (RIGW, 1992). d- Reconnaissance Soil Map of the area Alexandria-Cairo, U.A.R. sheet VII, at scale 1: 200,000, U.A.R. High Dam Soil Survey Project in cooperation with the united nations special fund 1964, based on aerial photographs and field survey (FAO, 1964).
7- Computer Software’s: ILWIS 3.11, Microsoft Excel, Microsoft Word, power point and SPSS-10.
75
4.2 Methods Applied Methods followed in research include data collection including literature review and fieldwork, processing and analyzing the data and interpretation of some selected soil properties indicating land degradation in El-Bustan I & II areas in Egypt. 4.2.1 Pre-Field Work The grid samples of year 1986, was located according to the location maps of the General Authority for Reclamation and Development Agricultural Projects. The grid samples of the fieldwork in 2001 were located according to the location of the existing samples in years 1984 - 1986. The geomorphic mapping units were created based on the result of digital terrain model, then the Geopedological soil map was create for the two years 1986 and 2001. 4.2.1.1Terrain Analysis (DTM) 1- The contour lines of the topographic maps of the studied area, scale 1:50,000 (1996), scale 1:50,000 (1984) and scale 1:100,000 (1988) were digitized on screen using ILWIS 3.11 after scanned it with contour intervals 5 meter height. 2- Digitized contour lines map were transferred to a point contour map based on grid system with distance 500 meter through overlying grid system on the digitized contour lines map and edit the value of each contour line intercepted with the grid system. 3- The control elevation points which are on the topographic maps were added to the contour points map. 4- The DTM was created using the geostatistical analyses of the final contour points map of the studied area.
4.2.1.2Create soil mapping units
Figure (4-1) shows the methodological approach of create Geopedological mapping units, which is resulted from overlying classified DTM, and geological map, using the slicing operation. Also the ancillary information and existed soil maps information were used to create the Geopedological mapping units. From the histogram operation the contour intervals were obtain. Then using the slicing operation the boundaries of the geomorphic mapping units were created. Finally follow the Geopedological approach
76
with the help of other created maps and other information the Geopedological mapping units were created. 4.2.1.3Spectral Analysis
Digital processing is increasingly used for identification and mapping of surface features. High spectral resolutions allow for improving soil cartography, especially regarding the boundary precision of map unit delineation (Zinck, 1998). The Landsat TM, computer tape of September 1990, August 1997, and December 1999 were used to get CCT’s which are geometrically corrected at the Fucino receiving station, Telespazio, Italy. The best false color composite obtained from the TM bands 7, 4, and 2. This combination produced the best color-coding alternative for soils, vegetation Field work
Topographic maps
Knowledge Base (Reference Data)
Laboratory analyses Contour point map
*field Data (Determination of Soil properties)
Soil properties point map
*Local Knowledge (SocioEconomical Data)
ANOVA
Geostatistical analysis
Geostatistical analysis
Applying kriging method Ancillary Information
Digital terrain model
Soil feature value maps
*Thematic Maps *Available Maps and Information
Histogram
Ratting
Other Information Geomorphic mapping units
Classified soil feature maps
* Lithology, Soils, Slope and Geomorphology * Hydrology and Climate
Crossing
*Land use
Geopedological mapping units Map production
Processing Step
77
Step Flow
Figure (4-1) The Methodological Approaches Have Creates Geopedological Mapping Units of the Studied Area
Set of Operation
and water information for the studied area.
The Maximum Likelihood classifier was used to classified the color composite of the satellite image of TM create of September 1990, August 1997, and December 1999, after using the unsupervised classification to create the expected waterlogging areas in the studied area. Then the cross operation was used between the three classified maps to determine the location of waterlogging areas in the studied area. 4.2.1.4 Sampling Design
Three types of observations based on profiles, mini-pits and augers descriptions were covered the studied area using grid samples system with distance of 1000 meter. In total 12 profiles (150 cm) and 33 mini-pits (0-60 cm) were fully described and followed by auger hole up to 150 cm depth. In total 147 auger observations were described in regular depth, 0-30, 30-60, and 60-150. The profiles and mini-pits were distributed in five lines according to the slope direction from western south direction to eastern north direction. The auger holes were distributed in the other location of the grid sample system after located the mini-pits observations. 4.2.2 Fieldwork During fieldwork on September 2001, some relevant information and literatures were also collected from the organization. The fieldwork has been planned to cover the studied area using grid samples system, with intervals of 1000 meter. Soil data was collected in the field based on full description of profiles, mini-pits and Augers. The soil samples of the profiles and mini-pits were collected according to the differences between the layers. Detailed macro-morphological descriptions were recorded following the guidelines edited by FAO group (1990). 4.2.3
Laboratory Work
78
Samples were air dried, gently crushed, and then sieved through a 2-mm sieve. Fraction blew 2 mm were subjected to soil analysis. 4.2.3.1Soil Physical Analyses
Soil color for both moist and dry samples using Munsell color charts, U.S.D.A., soil survey staff (1975) were examined. Particle size distribution was analyzed by Hydrometer method for all the profiles, mini-pits and some augers (Richards, 1954). Saturated hydraulic conductivity was carried out on undisturbed soil samples as described by USSL staff (1954). Total calcium carbonate was determined by Collin’s Calcimeter (Nelson, 1982). Saturated hydraulic conductivity, soil moisture retention curves, and wilting point were determined according to (Stakman and Van der Harst, 1962), using pressure membrane apparatus of undisturbed soil samples in cores of 2.5 cm height and 5 cm wide. 4.2.3.2Soil Chemical Analyses
The electrical conductivity of the saturated soil paste extract was carried out according to Rhoades (1982). Soil reaction (pH) was determined in (1:2.5) soil: water suspension using Beckman pH meter, Mclean (1982). The water extract components were determined in the soil extract, and the following determination was carried out: -
The carbonates and bicarbonates by titration using Phenolphthalien and Bromocresol green as indicators, Jackson (1967).
-
The chlorides using Mohr’s method, Jackson (1967). The sulphates were determined using barium chlorides.
-
Calcium and Magnesium were determined by versenate method using ammonium perpiorate as an indicator for calcium and Magnesium, Jackson (1967).
-
Sodium and potassium were determined photometrically using perkin elmer flame photometer, Jackson (1967).
-
The sulphates were calculated by subtracting the summation of the soluble anions from total soluble cations.
4.2.4 Data Processing and Analysis 4.2.4.1 Data input
The integrated land and watershed management system (ILWIS) developed in ITC, (version 3.11) has been used as the main software for this study. The
79
system provides users with state of the art data gathering, data input, data storage, data manipulation, data analysis, and data output capability by integrating conventional GIS. The locations of profiles, mini-pits and the auger observations were digitized in order to know the geographic coordinates and later to carry out interpolation of soil properties. Soil properties (Effective soil depth, EC, CaCO3% etc.) were entered in tabular database. In addition, settlements, roads, irrigation and drainage network were also digitized. 4.2.4.2 Analysis of Variance (ANOVA)
ANOVA analysis was performed in order to investigate how the measurements of soil properties are related to different geopedological mapping units, using the software “SPSS version: 10”. Analysis of variance (ANOVA) was used as a different approach to analyze the relation between the soil properties with different soil unit maps, and it was used to select the most soil properties are differentiate groups for the soil mapping units. 4.2.4.3 Geostatistical Analysis
Geostatistics take into account both the structured and random characteristics of spatially distributed variables, thus providing tools for their description and optimal estimation. The principal difference between geostatistics and conventional statistics is that in geostatistics the variables are linked to locations. The spatial dependence function of observations is defined by the second part of the intrinsic hypothesis, which is termed the semi-variogram (h). The semi-variogram is defined as a function of the distance h between locations in the observation space. The semi-variogram, which can be calculated from the data needs to be modeled using one of the following models in order to find the ‘best’ model and the ‘best’ parameters for the nugget, sill and range. Geostatistical analysis is a two step procedure: (a) the calculation of the experimental semi-variogram and fitting a model; and (b) interpolation through some sort of Kriging, which uses the semivariogram parameters (Stein, 1998). 4.2.4.4 Interpolation of the Soil Properties 80
The parameters of the best fitting model for the variables were used to use Ordinary Kriging. The variables, which were not spatially related and gave total nugget, were interpolated by using the moving average method, which is the same as simple kriging method with total nugget. 4.2.5 Data Interpretation (Land Degradation Assessment)
81
Figure (4-2) shows methods and techniques were used to create the severity degree of the land degradation of the studied area. Soil feature point maps of year 2001 Soil properties in grid sample system
Geopedological mapping units
ANOVA
Attribute Table
Soil feature point maps of year 1986 Soil properties in grid sample system
Knowledge Base (Reference Data) *field Data (Determination of Soil properties) *Local Knowledge (SocioEconomical Data)
Attribute Table Ancillary Information
Attribute Table
Attribute Table
Selected soil properties which are differentiated groups 2001
Selected soil properties which are differentiated groups 1986 Spatial correlation
*Thematic Maps *Available Maps and Information Other Information * Lithology, Soils, Slope and Geomorphology * Hydrology and Climate *Land use
Table of semi-virograms Modeling of semi-virograms
Management
Goodness of Fitting Curve & S elect Model Parameters
* Type of Land use * Irrigation System
Applying Ordinary Kriging Method S oil feature maps of year 2001
S oil feature maps of year 1991 Calculate the differences by MapCalc
Land Degradation Indicators * Effective Soil Depth * Soil Salinity * CaCO 3 % contain Degree of Degradation
Difference maps of years 1991 & 2001
* FAO 1987 *GLASOD
Rating & Crossing Land degradation map Villages Boundaries Map
M ap production
Processing Step
Set of Operation
Step Flow
Figure (4-2) The Methodological Approach of Create Land Degradation Map
82
Tables
4.2.5.1Calculation of the differences between the two years 1986 & 2001
MapCalc. Operation was used to calculate the differences of the selected soil properties of the two years 1986 and 2001. The differences of each soil properties were negative or positive values depend on the type of the indicators. The positive values of the effective soil depth indicate that there is degradation in this area. But the positive values of the soil salinity, calcium carbonates, and bulk density indicates that there is improvement in these areas and the negative value indicates that there is degradation. 4.2.5.2 Soil degradation status
According to FAO (1978) a common units of measurement for different processes could be the loss of soil production, in tone/ha/year or loss of benefit in monetary terms. The list of land degradation classes is shown in Table (4-1). El Bustan I&II areas were started to cultivate in the winter of year 1990- 1991, therefore, the total difference consider as a result of management effects of 10 years. Areas are degraded was calculated for the total 10 years and also for each year. The selected soil properties value maps of the two years (1986 & 2001) were rated by land degradation classes, then thematic maps were created and were used to create land degradation severity level according the GLASOD approach.
Table (4-1) List of Land Degradation Status Classes, After FAO (1978) Status classes Indicators Non Slight Moderate High Decreased in effective soil depth mm/year 0.0 0.0- 10.6 10.6 - 13.3 13.3 - 23.3 Increased in soil salinity (0-60 cm) dS/m/year 0.0 0.0 - 1 1-3 3-5 Increased in bulk density (0-60 cm) g/cm3/year 0.0 0.0 – 0.1 0.1 – 0.2 0.2 – 0.3
4.2.5.3Extent of soil degradation 83
Very high
> 23.3
>5
> 0.3
The slicing operation was used to classify the differences and calculate the degradation status for the total 10 years and for each year. The extent area % was calculated by subtracted the status of each year from the status of the total 10 years, then get % from each mapping unit. 4.2.5.4Severity of land degradation
From two diminution tables of land degradation status and extent land degradation % the overall severity of land degradation were created. Using the cross operation between the Geopedological mapping units and the observation points of year 1986, the soil map of year 1986 was created. Also using the cross operation between the Geopedological mapping units and the observation points of year 2001, the soil map of year 2001 was created. From the two results the changes in the soil map can be known.
84
5
RESULTS AND DISCUSSION
5.1 Geomorphic Analysis 5.1.1 Terrain Analysis: Geostatistical Technique 5.1.1.1Contour Point’s Map
The point editor in ILWIS.3.11 (2001) was used to create a contour point’s map, by digitizing the contour values, which are intercepted with the grid system of intervals of 500 meters. The altitude control points, which are located in the available topographic maps, were digitized with the contour point’s map. Figure (5-1) shows the distribution of the contour points values map.
Figure (5-1) The Distribution of the Contour Points Values Map of the Studied Area.
In total 2,075 contour points covers area of 155,400 feddans, was larger than the studied area to avoid the error in the edge of the calculated map. The values of the contour point’s map were ranged between 1 to 61 meters A.S.L. and the average was 18.93 meters A.SL. The stander deviation was 12.0 meters A.S.L.
85
5.1.1.2Spatial correlation and empirical Semi-variogram
The point statistics get impression of the nature of the contour point values map for instance prior to a point interpolation, and to find necessary input parameters for Kriging method. Kriging assumes a certain degree of spatial correlation between the input point values map. To investigate whether the contour point values are spatially correlated and until which distance from any point this correlation occurs, the dependent output table will be defined and calculated. The output of the omnidirectional spatial correlation operation is a table consisting of six columns: Distance, Nr-Pairs, I, c, AvgLag, and SemiVar. The results of the first 10 lags were shown in the Table (5-1). The results of out put table shows that there are 95 lags and from lag 80 there is dramatic drop in the number of the pairs. Table (5-1) The Results of Applying the Spatial Correlation Operation to the Contour Point Values Map for the First 10 Lags. Number
Distance
NrPairs
I
C
AvgLag
SemiVar
1
0.0
229
0.907
0.03
232.6
4.08
2 3 4 5 6 7 8 9 10
600.0 1200.0 1800.0 2400.0 3000.0 3600.0 4200.0 4800.0 5400.0
4376 7732 10663 13393 16020 18390 21010 22568 24186
1.049 1.036 1.041 1.019 1.004 0.981 0.948 0.921 0.898
0.04 0.05 0.05 0.06 0.07 0.08 0.09 0.11 0.12
655.8 1218.4 1818.3 2411.6 3007.3 3605.0 4201.8 4802.7 5403.0
5.57 6.59 7.89 8.90 10.38 12.07 13.52 15.60 17.74
“Distance”: lists the middle values of the distance intervals; “Nr-Pairs”: lists for each distance interval, the number of point pairs found at these distances towards each other; “I”: lists for each distance interval, the spatial autocorrelation of the point pairs in this distance interval; “C”: lists for each distance interval, a statistic for spatial variance of the point pairs in this distance interval; “AvgLag”: lists for each distance interval, the average distance between points of the point pairs in this distance interval; “SemiVar”: lists for each distance interval, the Experimental semi-variogram value of the point pairs in this distance interval.
86
Therefore, we can exclude the lags from 81 to 95 to get reliable results. All the results of the dependant output table are shown in Appendix (A). 5.1.1.3 Modeling the Semi-Variogram and Goodness of Fit
The Kriging process is to model the discrete values of the experimental semi-variogram, which gives the expected value for any desired distance. From the results of the spatial correlation operation, the semi-variogram was made. In the semi-variogram, the discrete experimental semi-variogram values that are the outcome of spatial correlation were modeled by a continuous function so that a semi-variogram value “g” will be available for any desired distance “h” for the Kriging operation. A semi-variogram model describes the relation between squared differences of pairs of point values and distance. According to the specified semi-variogram model and parameters, a line was drawn in the graph window that displays experimental semi-variogram values. The model's parameters: nugget, sill, and range of five models (Spherical, Exponential, Gaussian, Power, and Wave) were determined to select the best model parameters were fitted with the experimental semi-variogram values Figure (5-2).
300.00
SemiVar : OmniDirectional SemiVariogram
250.00
200.00
Spherical 150.00
Exponential 100.00
Gaussian Power
50.00
Wave 0.00 0.0
10000.0
20000.0
30000.0
Distance : Point dis tance
87
40000.0
Figure (5-2) The Five Models, Spherical, Exponential, Gaussian, Power, and Wave for the Semi-Variogram of the Contour Points Map.
From the semi-variogram operation we could define which models fits the experimental semi-variogram values best. By calculate the Goodness of fit (R2), we could choose the most fitted model and use the model parameters to apply Kriging method. The formula of calculating the (R2) is as following: R2 = 1 – [Σ(ŷ(hi) –(y(hi))]2/ [Σ(ŷ(hi) - Σŷ(hi)/N)2] Where ŷ: The experimental semi-variogram values calculated by the spatial correlation operation; y: the semi-variogram values calculated by the column Semi-variogram operation; h: the distance between points; N: the total number of distance classes/intervals.
The model parameters of the five models and their goodness of fitting were shows in Table (5-2). Table (5-2) The Model Parameters of the Five Models and Their Goodness of Fitting. Parameters Goodness of fitting semiModels variogram (R2) Nugget Sill or slope Range Spherical 0.0 250 45,500 0.99* Exponential 0.0 305 26,500 0.92 Gaussian 5.0 255 21,500 0.94 Power 10.0 0.007 1.00 0.75 Wave 5.0 210 8,550 0.93
5.1.1.4 Kriging Value and Error Maps
The parameters of the best fitting model were used to calculate the interpolation of the contour point values map. Map Kriging Ordinary (contour, subtm3, Spherical (0.0, 250, 45500), 45000, 1, 8, 14, average, 0.0, 1000).
The resulted raster value map of applying Kriging is show in Figure (5-3). The values of the rater map of the studied area ranged from 2.9 to 47.4 m ASL. The mean, the median, and the dominant values were 24.08, 24.10 and 15.0 meters ASL respectively. Dependent raster of the estimated Kriging error map was created directly when applying Kriging estimation and presented in Figure (5-4). The results illustrate that the values of the rater error map ranged from 0.81 to 5.57 meters ASL. The mean, the median, and dominant values were 2.69, 2.27 and 2.01 meters ASL respectively. Notes the big difference between the estimated error of Kriging and the standard deviation of the contour point’s map (12 m asl). 88
5.1.1.5 Determination of Geomorphic Mapping Units
The DTM value map was used to delineate the boundaries of the geomorphic mapping units after using the histograms operation. The stretched operation was used to separate between the peaks of the histogram graph. The result of the stretched histogram graph shows that, there are different peaks representing the interval values, which were used to determine the different classes. Using the slicing operation with the interval values, we can transfer the DTM value map to a classified map. Figure (5-5) shows the result of the stretched histogram graph.
Figure (5-3) The Resulted Raster Value Map of the Contour Points Map
89
The landscape was classified as plain and subdivided to 3 main relief types, which are Low land, Flat area, and Sand dunes. According to the geological map the Low land derived from Quaternary Nile Silt, the Flat areas derived from undifferentiated Quaternary deposits, and the Sand dunes derived from Quaternary Aolian deposits. Table (5-3), and Map (5-1) shows the geomorphic mapping units and the legend.
Map (5-1) The Geomorphic Mapping Units of the Studied Area
90
Table 5-3 The Legend of the Geomorphic Mapping Units Morphogenetic Environment
Landscape
Area Relief
Low Quaternary Nile Land Silt (PL1)
Alluvial depositional
Flat (PL2)
ColluvialEolian Depositional
Lithology
Undifferentiated Quaternary deposits
Landform
Unit
Phase
Terrace 1
PL111
-------
-----
-----
-----
Terrace 2
PL112
--------
-----
-----
-----
PL211
-------
-----
8410
17.35
PL212
-------
-----
9565
19.72
PL213
-------
-----
1415
2.91
Summit
PL3111
2305
4.75
Back slope PL3112
1080
2.23
Foot slope
PL3113
8160
16.83
Toe slope
PL3114
15,080
31.10
Top
PL3121
1150
2.37
Slope
PL3122
1295
2.67
------
PLl313
25
0.05
Flat cover by thick sand sheet Flat cover by thin sand sheet Depression
Plain (PL) Longitudinal dune Sand Dunes (PL3)
PL311
Quaternary sand dunes Pyramidal dune Depression
PL312 PL313
Unit
Feddans
%
5.2 Field work During the fieldwork on September 2001, three types of observations based on profiles, mini-pits, and augers descriptions were covered the studied area using grid samples system with distance of 1000 meters intervals, which is based on the location points of the survey year 1986. Figure (5-6) shows the location of the observation points for the two years (1986 and 2001). In total 192 observation points (12 profiles, 23 Mini-pits, and 147 Augur holes) were surveyed during the fieldwork (August 2001).
Figure (5-6) The Location of the Observation Points for the Two Years 1986 & 2001
91
5.3 Soils characteristics of year 2001 5.3.1 Morphological Description The morphological description of the studied soil observations was carried out following the guideline of soil description of FAO 1990. This area distinguishes with a flat to slightly slopping surface, and it may reach to 5% in some area. All the observations were cultivated areas and only 7 observations were uncultivated areas, cover by some natural grasses. About 29 observations out of 192 were used surface irrigation system in furrow system and all the other observation was used drip and movable sprinkler irrigation systems. The vegetation covers were fruit trees (Citrus, Banana, Apricot, Grapes, Apples, Gouph, Mango, Olive, and Peach), field crops (Groundnuts, and Maize), and Vegetable (Marrow, Tomato, and Green Beans). There is two-water pond in the studied area, and layer of sand covered about six areas and the thickness of this layer was ranged between 50 cm to 100 cm. there is no evidence for water or wind erosion in the studied area. The results of the morphological studies of the two main units as following: Flat areas (PL211, PL212, and PL213) The soils of the examined area exhibit mostly their lighter textural grade (Coarse Sandy, Fine Sandy, Loamy Sand and Sandy Clay Loam in the depression PL213) in addition to the presence of the sea shells as well as shell fragments -in the most observations- with the Eolian deposits. The coarse textural was on the top surface layer and the fine textural was in subsurface layers. Most of the observations were well-drained condition, but there is 27 observations were effected by shallow water table. The gravel percent is few and fine in the surface, in addition to the presence of some seashells. These soils were coarse or fine sandy along the soil profile. The effective soil depths were effected by water table level. 163 observations were very deep soil and there is no hard pans or compacted layer. 17 observations were deep soil and the water table level ranged between 90 cm up to 110 cm depth from the 92
surface. 8 observations were moderate deep soil and the water table level ranged between 70 cm up to 85 cm depth from the surface. Only two observations were shallow deep soil and the water table level were 45 cm depth from the surface. These two observations were located near the water logging area. The structure of the surface layer was single grain when it dries and subs angular blocky, very weak, and fine size when it was wet. In the sub surface layers were massive in most observations but few observation which content high percent of calcium carbonates, the structure become sub angular blocky, weak, and medium to coarse size. Calcium carbonates were few to many, fine to medium size, and hard, soft or both, especial in the subsurface layers and there is no accumulation of gypsum. Soil texture was sandy from surface to depth ranged from 50 – 100 cm and then loam sandy or sandy clay loam texture were up to 150 cm. Soil colors were ranged between yellow, yellowish brown, up to grayish. The plasticity of these soils was generally low in the surface layers and higher in the loamy sand layers. The water holding capacity was low, but it is higher in the loam sandy and sandy clay loam layers. Sand dunes areas (PL311, PL312, and PL313)
These soils were mostly lighter textural grade (Coarse Sandy, Fine Sandy and Loamy Sand) in addition to the presence of the seashells as well as shell fragments-in the most observations- with the Eolian deposits. The coarse textural was on the top surface layer and the fine textural was in subsurface layers. Most of the observations were well-drained condition and have very deep ground water table. The sloping percent was 2% - 5% from the south direction to the north direction. The gravel percent is few and fine in the surface, with some nature-deserted grass on the surface. The effective soil depth was very deep (more than 150 cm from the surface) and there is no hard pan or compacted layers until this depth (150 cm). Also the structure of the surface layer was single grain when it dries and sub angular blocky, very weak, and fine size when it was wet and in the sub surface layers were massive in most observations. Soil colors were ranged between yellow,
93
yellowish brown, up to brown. Calcium carbonate was low in the soils and there is no gypsum accumulation in the profile layers. The plasticity of these soils were generally low, but in the layers which have some calcium carbonate soft or hard, the plasticity was increased. These soils were high darinable and the water holding capacity was low. 5.3.2 The Chemical Analysis The pH value was determined in the saturated paste soil sample and it ranged between 7.51 up to 8.39, and its increased from the surface layer down word to sub surface layers. The total soluble salts were determined in dS/m at 25 ˚C. the EC value was low in the surface layer and increased by depth. In the flat areas the EC value was higher than the sand dune areas. The EC value was ranged between 0.35 up to 34.1 dS/m. In the sand dune areas the EC values were ranged between 0.35 up to 7.19 dS/m and classified as none saline soil (150 cm). Presence of rock outcrops : - few fine to medium gravels. Presence of salt or alkali : - Non. Erosion : - No evidence of erosion. Human influence : - Agriculture. Horizon Symbol Depth Description Ap 0 -25 Dark yellowish brown (10 YR 4/6) wet, Yellowish brown (10 YR 5/6) dry; sandy; very week fine to medium sub-angular blocky structure ; non sticky, non plastic; many medium to coarse pores; no calcium carbonate; few fine roots ; clear wavy boundary . Cu1 25 -60 Yellowish brown (10 YR 5/8) wet, Yellow (10 YR 7/8) dry; sandy; massive structure ; non sticky, non plastic many medium to coarse pores ; no calcium carbonate; few very fine roots; gradual and irregular boundary. Cu2
60-150 Yellowish brown (10 YR 5/6) wet, Brownish yellow (10 YR 6/6) dry; loamy sand; massive structure; slightly sticky, slightly plastic; many fine to medium pores; few calcium carbonate; no roots; gradual and irregular boundary.
109
Table (5-7a):- Chemical Analysis for Profile No. P2 Depth
pH
Cm
EC
Cations (meq/L)
Anions (meq/L)
SP. CaCO3 O.M.
ds/m
Ca++
Mg++
K+
Na+
Cl-
SO4--
CO3-- HCO3-
%
%
%
0-25
8.09
0.63
3.12
1.68
0.1
2.5
3.65
2.25
0.00
1.5
22
7.9
0.48
25-60
8.14
1.85
8.55
3.79
0.1
7.0
10.65
6.29
0.00
2.5
22
8.3
0.34
60-150
8.17
2.11
9.06
4.11
0.2
8.5
15.20
4.17
0.00
2.5
24
10.4
Nil
Table (5-7b):- Particle size distribution for Profile No. P2 Depth
Coarse Sand
Fine Sand Total Sand
Silt
Clay
Silt+Clay
Cm
%
%
%
%
%
%
0-25
67.9
25.60
93.50
4.10
2.40
25-60
67.9
25.50
93.4
4.60
60-150
50.1
36.50
86.6
7.60
Texture
Hydraulic conductivity
6.50
Sandy
3.79*10-3
2.00
6.60
3.47*10-3
5.80
13.40
Sandy Loamy Sand
2.57*10-3
Table (5-7c):- Soil Moisture Retention for Profile No. P2 Depth
Retained Moisture ( % weight) 5.0 bar
NonBulk useful Density pores 30 30-9 9-0.2 Micron Micron Micron
PL212, Typic Torripsamments:
The soils are flat and the parent material is undifferentiated Quaternary deposits, which are mixed from Nile silt, eolian deposits, and marine lacustrine deposit. The surface is covered with few, medium to coarse gravels. The groundwater is very deep. The color varies from yellow, yellowish brown, brownish yellow, and very pale brown, when dry and from yellowish brown, dark yellowish brown,and pale prown when wet. The texture was sandy in the all surface layers and
110
loamy sand to sandy loam in the
subsurface layers. The structure is very week to week, fine to medium subangular blocky in the surface layer and massive in the subsurface layers. The structure in the sandy loam layers was week to moderate, medium to cource subangular blocky. The soil had many fine, medium, and coarse pores. The calcium carbonate and gypsum were low, but in the loamy sand and sandy loam layers, the calcium carbonate was increased. The pH ranged from 7.91 to 8.35 and the EC ranged from 0.66 to 4.91 ds/m. Soluble Ca represented the major cation and ranged from 3.01 to 19.52 meq/l while Mg ranged from 1.58 to 5.95 meq/m and Na ranged from 2.5 to 7.3 meq/L. The major anion was chlorid and ranged 3.48 to 27.4 meq/L. CaCO3 ranged from 6.2 to 10.4 % and increasing downwards. The organic matter from 0.01 to 0.47 % increasing upwards (see Table 5-8a). The sand ranged from 75.2 to 93.60 %, silt was 4.40 to 19.10 % and clay from 2.00 to 7.40%. The results of the soil moisture retention revled that the saturation ranged from 24.46 to 34.40 % and the field capacity ranged from 18.32 to 25.78 % , at the permanent wilting point it ranged from 1.94 to 3.52 %. The volum of the quickly drainalbe pores ranged from 17.91 to 30.15 %, the slowly drainable pores ranged from 30.20 to 50.54 % and the volum of water holding pores ranged from 18.05 to 32.96 %, and the unusful pores ranged from 7.58 to 15.15%.The bulk density ranged from 1.39 to 1.64 gm/cm3 (see Tables5-8b&C). These soils are covered by observation points number P4, M7, M27, M28, M38 and M39. Observation No. P4 take as representive profile of this unit.
111
Observation No.
: - P4
Date of examination Location Latitude Longitude Topography Elevation Land use Parent material Landscape
: - 27 /9/2001 : - Tawfiq El-Hakim Village : - 30 o 46 \ 38 \\ N :- 30 o 13 \ 55 \\ E : - Flat cover with thin sand sheet : - 15 m A.S.L. : - Citrus trees : - Mixed sand, Nile silt, and Marine deposits : - Plain
Soil classification : - Typic Torripsamments Irrigation : - El-Bustan El-Gddiedah canal Drainage : - No drainage Soil moisture condition : - Moist below 60 cm. Depth of ground water : - Very deep (>150 cm). Presence of rock outcrops : - few fine to medium gravels. Presence of salt or alkali : - Non. Erosion : - No evidence of erosion. Human influence : - Agriculture. Horizon Symbol Depth Description Ap 0 -25, Dark yellowish brown (10 YR 3/4) wet, Yellowish brown (10 YR 5/6) dry; sandy; very week fine to medium sub-angular blocky structure ; non sticky, non plastic; many medium to coarse pores; no calcium carbonate; few fine roots ; clear wavy boundary . Cu1 25 -60 Dark yellowish brown (10 YR 4/6) wet, Brownish yellow (10 YR 6/6) dry; sandy; massive structure; non-sticky, non plastic many medium to coarse pores; no calcium carbonate; few very Cu2
fine roots; gradual and irregular boundary. 60-150 Yellowish brown (10 YR 5/8) wet, Brownish yellow (10 YR 6/6) dry; loamy sand; week fine to medium sub-angular blocky structure; slightly sticky, slightly plastic; many fine to medium pores; few calcium carbonate; no roots; gradual and irregular boundary.
112
Table (5-8a):- Chemical Analysis for Profile No. P4 Depth
pH
Cm
EC
Cations (meq/L)
Anions (meq/L)
ds/m
Ca++
Mg++
K+
Na+
Cl-
SO4--
SP. CaCO3 O.M.
CO3-- HCO3-
%
%
%
0-25
8.08
0.66
3.01
1.48
0.1
2.4
3.48
2.01
0.0
1.5
22
7.0
0.21
25-60
8.25
0.98
5.93
1.66
0.1
2.5
4.26
3.93
0.0
2.0
23
9.1
0.12
60-150
8.25
1.23
7.06
3.11
0.2
2.5
8.46
2.41
0.0
2.0
24
9.1
0.07
Table (5-8b):- Particle size distribution for Profile No. P4 Depth
Coarse Sand
Fine Sand Total Sand
Silt
Clay
Silt+Clay
Cm
%
%
%
%
%
%
0-25
71.20
22.4
93.60
4.40
2.00
25-60
70.00
23.4
93.40
4.40
60-150
67.10
26.2
93.30
4.70
Texture
Hydraulic conductivity
6.40
Sandy
2.05*10-3
2.20
6.60
Sandy
2.75*10-3
2.00
6.70
Sandy
2.37*10-3
Table (5-8c):- Soil Moisture Retention for Profile No. P4 Depth
Retained Moisture ( % weight) 0.10 bar
0.33 bar
1.0 bar
5.0 bar
NonBulk useful Density pores 30 30-9 9-0.2 Micron Micron Micron
PL213, Typic Torripsamments:
The soils are flat and the parent material is undifferentiated Quaternary deposits, which are mixed from Nile silt, eolian deposits, and marine lacustrine deposit. The surface is covered with few, medium to coarse gravels. The groundwater is very deep. The color varies from brownish yellow to very pale brown, when dry and from yellowish brown to pale prown when wet. The texture was sandy and loamy sand in the all surface layers and loamy sand to sandy loam in the subsurface layers. The structure is very week to
113
week, fine to medium subangular blocky in the surface layer and week to moderate, medium to cource subangular blocky in the subsurface layers. The soil had many fine, medium, and coarse pores. The calcium carbonate and gypsum were low, but in the loamy sand and sandy loam layers, the calcium carbonate was increased. The pH ranged from 8.04 to 8.26 and the EC ranged from 1.66 to 5.52 ds/m. Soluble Ca represented the major cation and ranged from 8.92 to 18.68 meq/l while Mg ranged from 3.52 to 4.46 meq/l and Na ranged from 4.5 to 6.5 meq/l. The major anion was chlorid and ranged 8.92 to 19.10 meq/L. CaCO3 ranged from 4.6 to 7.9 % and increasing downwards. The organic matter from 0.03 to 0.45 % increasing upwards (see Table 5-9a). The sand ranged from 71.70 to 88.8 %, silt was 5.4 to 20.4 % and clay from 5.0 to 7.9%. The results of the soil moisture retention revled that the saturation ranged from 20.93 to 28.55 % and the field capacity ranged from 13.23 to 21.06 % , at the permanent wilting point it ranged from 1.33 to 4.31%. The volum of the quickly drainalbe pores ranged from 11.75 to 29.74 %, the slowly drainable pores ranged from 38.05 to 50.83% and the volum of water holding pores ranged from 14.10 to 25.82 %, and the non-usful pores ranged from 6.35 to 23.36%.The bulk density ranged from 1.51 to 1.64 gm/cm3 (see Tables5-9b&C). These soils are covered by observation points number P6 and M37. Observation No. P6 take as representive profile of this unit.
114
Observation No. Date of examination Location Latitude Longitude Topography Elevation Land use Parent material Landscape Soil classification Irrigation Drainage Soil moisture condition Depth of ground water Presence of rock outcrops Presence of salt or alkali Erosion Human influence Horizon Symbol Depth Ap 0 -20
Cu1
20 -60
: - P6 : - 28 /9/2001 : - Ali Abn Abo Talab Village : - 30 o 45 \ 02 \\ N :- 30 o 15 \ 56 \\ E : - Depression : - 15 m A.S.L. : - Citrus trees : - Mixed sand, Nile silt, and Marine deposits : - Plain : - Typic Torripsamments : - El-Bustan El-Gddiedah canal : - No drainage : - Moist below 30 cm. : - Very deep (>150 cm). : - few fine to medium gravels. : - Non. : - No evidence of erosion. : - Agriculture.
Description Yellowish brown (10 YR 5/8) wet, Brownish yellow (10 YR 6/6) dry; sandy; very week fine to medium sub-angular blocky structure ; non sticky, non plastic; many medium to coarse pores; no calcium carbonate; few fine roots ; clear wavy boundary . Yellowish brown (10 YR 5/6) wet, Yellow (10 YR 7/6) dry; few distinct fine to medium pinkish white (7.5 YR 8/3) wet; loamy sand; week fine to medium sub-angular blocky structure; slightly sticky, slightly plastic; many fine to medium pores; no calcium carbonate; few very fine roots; gradual and irregular boundary.
115
Cu2
60-150
Pale brown (10 YR 6/3) wet, Very pale brown (10 YR 7/4) dry; many distinct fine to medium pinkish white (7.5 YR 8/3) wet; loamy sand; week fine to medium sub-angular blocky structure; slightly sticky, slightly plastic; many fine to medium pores; few calcium carbonate; no roots; gradual and irregular boundary.
Table (5-9a):- Chemical Analysis for Profile No. P6 Depth
pH
Cm
EC
Cations (meq/L)
Anions (meq/L)
ds/m
Ca++
Mg++
K+
Na+
Cl-
SO4--
SP. CaCO3 O.M.
CO3-- HCO3-
%
%
%
0-20
8.04
1.66
8.92
3.52
0.1
4.5
8.92
5.62
0.0
2.5
22
6.6
0.25
20-60
8.21
2.76
18.68
4.45
0.2
6.5
18.9
7.93
0.0
3.0
23
7.6
0.20
60-150
8.26
2.76
18.65
4.46
0.2
6.5
19.1
7.71
0.0
3.0
25
7.9
0.03
Table (5-9b):- Particle size distribution for Profile No. P6 Depth
Coarse Sand
Fine Sand Total Sand
Silt
Clay
Silt+Clay
Cm
%
%
%
%
%
%
0-20
62.5
18.1
80.6
14.4
5.0
20-60
58.6
19.3
77.9
16.5
60-150
49.6
22.1
71.7
20.4
Texture
Hydraulic conductivity
19.4
Loamy Sand
3.16*10-3
5.6
22.1
Loamy Sand
2.53*10-3
7.9
28.3
Sandy Loam
1.89*10-3
Table (5-9c):- Soil Moisture Retention for Profile No. P6 Depth
Retained Moisture ( % weight) 5.0 bar
NonBulk useful Density pores 30 30-9 9-0.2 Micron Micron Micron
PL213, Aquic Torripsamments:
The soils are flat and the parent material is undifferentiated Quaternary deposits, which are mixed from Nile silt, eolian deposits, and marine lacustrine deposit. The surface is covered with few, medium to coarse gravels. 116
The groundwater is very deep. The color varies from brownish yellow to very pale brown, when dry and from yellowish brown to pale prown when wet. The texture was sandy in the all surface layers and
loamy sand in the
subsurface layers. The structure is very week to week, fine to medium subangular blocky in the surface layer and week to moderate, medium to cource subangular blocky in the subsurface layers. The soil had many fine, medium, and coarse pores. The calcium carbonate and gypsum were low, but in the loamy sand and sandy loam layers, the calcium carbonate was increased. The pH ranged from 7.79 to 8.35 and the EC ranged from 2.05 to 10.15 ds/m. Soluble Ca represented the major cation and ranged from 8.8 to 78.15 meq/l while Mg ranged from 1.74 to 6.85 meq/l and Na ranged from 4.11 to 18.5 meq/l. The major anion was chlorid and ranged 15.9 to 73.25 meq/L. CaCO3 ranged from 7.6 to 19.3 % and increasing downwards. The organic matter from 0.03 to 0.69 % increasing upwards (see Table 5-10a). The sand ranged from 64.26 to 88.8 %, silt was 8.3 to 29.46 % and clay from 2.8 to 9.35%. The results of the soil moisture retention revled that the saturation ranged from 19.47 to 35.90 % and the field capacity ranged from 14.69 to 25.50 % , at the permanent wilting point it ranged from 1.20 to 4.79 %. The volum of the quickly drainalbe pores ranged from 17.19 to 26.76 %, the slowly drainable pores ranged from 38.05 to 50.83% and the volum of water holding pores ranged from 15.76 to 25.82 %, and the non-usful pores ranged from 6.65 to 18.94%.The bulk density ranged from 1.36 to 1.74 gm/cm3 (see Tables5-10b&C). These soils are covered by observation points number P3, A25, and A25‘. Observation No. P3 take as representive profile of this unit.
117
Observation No.
: - P3
Date of examination Location Latitude
: - 28 /9/2001 : - Tawfik El-Hakiem Village : - 30 o 45 \ 34 \\ N
Longitude Topography Elevation Land use Parent material Landscape Soil classification Irrigation Drainage Soil moisture condition Depth of ground water Presence of rock outcrops Presence of salt or alkali Erosion Human influence Horizon
:- 30 o 15 \ 11 \\ E : - Depression : - 14 m A.S.L. : - Citrus trees : - Mixed sand, Nile silt, and Marine deposits : - Plain : - Aquic Torripsamments : - El-Bustan El-Gddiedah canal : - No drainage : - Moist below 60 cm. : - Very deep (>150 cm). : - few fine to medium gravels. : - Non. : - No evidence of erosion. : - Agriculture.
Symbol Ap
Cu1
Depth 0 -25
25 -60
Description Yellowish brown (10 YR 5/8) wet, Brownish yellow (10 YR 6/6) dry; sandy; very week fine to medium sub-angular blocky structure ; non sticky, non plastic; many medium to coarse pores; no calcium carbonate; few fine roots ; clear wavy boundary . Yellowish brown (10 YR 5/6) wet, Yellow (10 YR 7/6) dry; few distinct fine to medium pinkish white (7.5 YR 8/3) wet; loamy sand; week fine to medium sub-angular blocky structure; slightly sticky, slightly plastic; many fine to medium pores; no calcium carbonate; few very fine roots; gradual and irregular boundary.
118
Ckc2
60-85
Pale brown (10 YR 6/3) wet, Very pale brown (10 YR 7/4) dry; many distinct fine to medium pinkish white (7.5 YR 8/3) wet; loamy sand; week fine to medium sub-angular blocky structure; slightly sticky, slightly plastic; many fine to medium pores; few calcium carbonate; no roots; gradual and irregular boundary.
Table (5-10a):- Chemical Analysis for Profile No. P3 Depth
pH
Cm
EC
Cations (meq/L)
Anions (meq/L)
ds/m
Ca++
Mg++
K+
Na+
Cl-
SO4--
SP. CaCO3 O.M.
CO3-- HCO3-
%
%
%
0-25
7.79
4.11
22.12
7.88
0.2
11.6
30.5
8.30
0.0
3.0
22
8.3
0.51
25-60
8.23
6.54
36.18
16.52
0.3
14.5
48.24
14.76
0.0
4.5
25
9.9
0.21
60-85
8.29
9.55
56.12
24.04
0.3
18.5
76.13
18.33
0.0
4.5
25
16.8
0.08
Table (5-10b):- Particle size distribution for Profile No. P3 Silt
Clay
%
%
%
Silt+Cla y %
22.22
77.39
17.64
4.97
22.61
54.07
15.74
69.81
23.28
6.91
30.19
47.81
16.45
64.26
27.76
7.98
35.74
Depth
Coarse Sand
Fine Sand Total Sand
Cm
%
%
0-25
55.17
25-60 60-85
Texture Loamy Sand Sandy Loam Sandy Loam
Hydraulic conductivity 2.53*10-3 1.88*10-3 1.52*10-3
Table (5-10c):- Soil Moisture Retention for Profile No. P3 Depth
Retained Moisture ( % weight) 5.0 bar
NonBulk useful Density pores 30 30-9 9-0.2 Micron Micron Micron
PL213, Typic Aquisalids:
The soils are flat and the parent material is undifferentiated Quaternary deposits, which are mixed from Nile silt, eolian deposits, and marine
119
lacustrine deposit. The surface is covered with very few, medium to coarse gravels. The groundwater is found in the depth ranged from 45 to 50 cm. The color is very pale brown, when dry and pale prown when wet. The texture was sandy loam in the all surface and subsurface layers. The structure is week to moderate, medium to coarse subangular blocky. The soil had many fine and medium pores. The calcium carbonate and gypsum were low, but in the sandy loam layers, the calcium carbonate was increased. The pH ranged from 8.29 to 8.35 and the EC ranged from 19.2 to 34.1 ds/m. Soluble Ca ranged from 121.18 to 134.25 meq/l while Mg ranged from 31.82 to 43.75 meq/m and Na represented the major cation and ranged from 36.2 to 225.22 meq/l. The major anion was chlorid and ranged 27.5 to 86.6 meq/L. CaCO3 ranged from 7.5 to 9.9 % and increasing downwards. The organic matter from 0.2 to 1.24 % increasing upwards (see Table 5-11a). The sand ranged from 57.24 to 70.51 %, silt was 21.96 to 32.26 % and clay from 7.53 to 10.5%. The results of the soil moisture retention revled that the saturation ranged from 19.84 to 21.51 % and the field capacity ranged from 15.64 to 8.42% , at the permanent wilting point it ranged from 3.00 to 10.28%. The volum of the quickly drainalbe pores ranged from 10.04 to 22.08 %, the slowly drainable pores ranged from 13.83 to 39.75 % and the volum of water holding pores ranged from 23.05 to 37.13 %, and the unusful pores ranged from 15.20 to 39.19%.The bulk density ranged from 1.166 to 1.75 gm/cm3 .(see Tables5-131&C). These soils are covered by observation points number P10, and M36.. Observation No. P10 take as representive profile of this unit. Observation No.
: - P10
Date of examination Location Latitude Longitude
: - 29 /9/2001 : - Mohamad Refeat Village : - 30 o 43 \ 16 \\ N :- 30 o 18 \ 40 \\ E
Topography Elevation
: - Depression : - 13 m A.S.L.
120
Land use Parent material Landscape Soil classification Irrigation Drainage Soil moisture condition Depth of ground water Presence of rock outcrops Presence of salt or alkali
: - Grass and pare soils : - Mixed sand, Nile silt, and Marine deposits : - Plain : - Typic Aquisalids : - El-Bustan El-Gddiedah canal : - No drainage : - Moist below 5 cm. : - Shallow (45 cm). : - few fine to medium gravels. : - Non.
Erosion Human influence Horizon
: - No evidence of erosion. : - not cultivated.
Symbol Depth Description Ap 0 -15 Pale brown (10 YR 6/3) wet, Very pale brown (10 YR 8/3) dry; many distinct fine to medium pinkish white (7.5 YR 8/3) wet sandy loam; week medium to coarse sub-angular blocky structure ; slightly sticky, slightly plastic; many fine to medium
Bz
15–45
pores; few calcium carbonate; no roots; gradual and irregular boundary. Pale brown (10 YR 6/3) wet, Very pale brown (10 YR 8/3) dry; many distinct fine to medium pinkish white (7.5 YR 8/3) wet sandy loam; week medium to coarse sub-angular blocky structure; slightly sticky, slightly plastic; many fine to medium pores; few calcium carbonate; no roots; gradual and irregular boundary.
Table (11a):- Chemical Analysis for Profile No. P10 Depth
pH
Cm
EC ds/m
Cations (meq/L) Ca++
Mg++
K+
Anions (meq/L) Na+
Cl-
SO4--
SP. CaCO3 O.M.
CO3-- HCO3-
%
%
%
0-15
8.34
19.2
121.18 31.82
2.53
71.03 127.5
95.56
0.0
3.5
34
7.5
1.18
15-45
8.29
32.8
134.25 43.75
3.5
225.22 235.5 166.22
0.0
5.0
38
9.5
0.2
Table (11b):- Particle size distribution for Profile No. P10 Depth
Coarse Sand
Cm
%
Fine Sand Total Sand %
%
Silt
Clay
%
%
121
Silt+Cla y %
Texture
Hydraulic conductivity
0-15
50.07
18.12
68.19
23.28
8.53
31.81
15-45
44.32
16.16
60.48
30.54
8.98
39.52
Sandy Loam Sandy Loam
2.84*10-3 1.89*10-3
Table (11c):- Soil Moisture Retention for Profile No. P10 Depth
Retained Moisture ( % weight)
5.0 bar
NonBulk useful Density pores 30 30-9 9-0.2 Micron Micron Micron
PL3111, Typic Torripsamments:
The soils are sand dunes and the parent material is colluvial eolian deposits (Quaternary deposits), which is manly from eolian sand deposits. The surface is covered with few, fine to medium gravels. The groundwater is very deep. The color varies from yellow, light yellowish browen, yellowish brown, and brownish yellow, when dry and from yellowish brown to dark yellowish brown when wet. The texture was sandy in the all surface and subsurface layers. The structure is very week, fine subangular blocky in the surface layer and massive in the subsurface layers. The soil had many medium and coarse pores. The calcium carbonate and gypsum were low. The pH ranged from 7.91 to 8.01 and the EC ranged from 0.49 to 0.55 ds/m. Soluble Ca represented the major cation and ranged from 2.65 to 2.73 meq/l while Mg ranged from 1.11 to 1.15 meq/m and Na ranged from 2.11 to 2.53 meq/l. The major anion was chlorid and ranged 1.79 to 2.63 meq/L. CaCO3 ranged from 4.2 to 7.6 % and increasing downwards. The organic matter from 0.01 to 0.20 % increasing upwards (see Table 5-12a).
122
The sand ranged from 89.3 to 91.50 %, silt was 6.7 to 8.1 % and clay from 1.80 to 2.8%. The results of the soil moisture retention revled that the saturation ranged from 19.19 to 23.68 % and the field capacity ranged from 13.37 to 18.72 %, at the permanent wilting point it ranged from 1.72 to 3.06%. The volum of the quickly drainalbe pores ranged from 22.19 to 30.15 %, the slowly drainable pores ranged from 37.37 to 54.39 % and the volum of water holding pores ranged from 12.34 to 25.15 %, and the unusful pores ranged from 7.33 to 11.21 %.The bulk density ranged from 1.57 to 1.64 gm/cm3 (see Tables5-12b&C). These soils are covered by observation point number P11 which is take as representive profile of this unit. Observation No.
: - P11
Date of examination Location Latitude Longitude Topography Elevation Land use Parent material Landscape Soil classification Irrigation Drainage Soil moisture condition
: - 30 /9/2001 : - Abd El Munium Ryiad Village : - 30 o 45 \ 12 \\ N :- 30 o 19 \ 37 \\ E : - Summit of Longitudinal sand dune : - 29 m A.S.L. : - Apples trees : - Colluvial-Eolian sand deposits : - Plain : - Typic Torripsamments : - El-Bustan El-Gddiedah canal : - No drainage : - Moist below 90 cm.
Depth of ground water : - Very deep (>150 cm). Presence of rock outcrops : - few fine to medium gravels. Presence of salt or alkali : - Non. Erosion : - No evidence of erosion. Human influence : - Agriculture. Horizon Symbol Depth Description Ap 0 -25, Yellowish brown (10 YR 5/8) wet, Yellow (10 YR 7/8) dry; sandy; very week fine to medium sub-angular blocky structure ; non sticky, non plastic; many medium to coarse pores; no calcium carbonate; few fine roots ; clear wavy boundary .
123
Cu1
25 -60 Yellowish brown (10 YR 5/8) wet, Yellow (10 YR 7/8) dry; sandy; massive structure ; non sticky, non plastic many medium to coarse pores ; no calcium carbonate; few very fine roots; gradual and irregular boundary. Cu2 60-150 Yellowish brown (10 YR 5/6) wet, Brownish yellow (10 YR 6/6) dry; sandy; massive structure; non sticky, non plastic; many fine to medium pores; few calcium carbonate; no roots; gradual and irregular boundary. Table (5-12a):- Chemical Analysis for Profile No. P11 Depth
pH
Cm
EC
Cations (meq/L)
Anions (meq/L)
ds/m
Ca++
Mg++
K+
Na+
Cl-
SO4--
SP. CaCO3 O.M.
CO3-- HCO3-
%
%
%
0-25
8.01
0.55
2.73
1.14
0.1
1.86
2.63
1.70
0.0
1.5
20
4.2
0.20
25-60
7.91
0.48
2.65
1.15
0.1
1.09
1.79
1.70
0.0
1.5
20
7.5
0.11
60-150
7.95
0.49
2.73
1.11
0.1
1.16
1.99
1.61
0.0
1.5
21
7.5
0.01
Table (5-12b):- Particle size distribution for Profile No. P11 Depth
Coarse Sand
Cm
%
%
0-25
77.1
25-60 60-150
Texture
%
Silt+Cla y %
Hydraulic conductivity
6.7
1.8
8.5
Sandy
8.47*10-3
90.5
6.7
2.8
9.5
Sandy
3.15*10-3
89.3
8.1
2.6
10.7
Sandy
2.57*10-3
Fine Sand Total Sand
Silt
Clay
%
%
14.4
91.5
77.3
13.2
74.3
15.0
Table (5-12c):- Soil Moisture Retention for Profile No. P11 Depth
Retained Moisture ( % weight)
5.0 bar
NonBulk useful Density pores 30 30-9 9-0.2 Micron Micron Micron
124
PL3112, Typic Torripsamments:
The soils are sand dunes and the parent material is colluvial eolian deposits (Quaternary deposits), which is manly from eolian sand deposits. The surface is covered with few, fine to medium gravels. The groundwater is very deep. The color varies from yellow, light yellowish browen, yellowish brown, and brownish yellow, when dry and from yellowish brown to dark yellowish brown when wet. The texture was sandy in the all surface and subsurface layers. The structure is very week, fine subangular blocky in the surface layer and massive in the subsurface layers. The soil had many medium and coarse pores. The calcium carbonate and gypsum were low. The pH ranged from 8.00 to 8.03 and the EC ranged from 0.35 to 0.56 ds/m. Soluble Ca represented the major cation and ranged from 2.69 to 2.95 meq/l while Mg ranged from 1.19 to 1.21 meq/m and Na ranged from 2.01 to 2.33 meq/l. The major anion was chlorid and ranged 1.89 to 2.75 meq/L. CaCO3 ranged from 4.2 to 7.5 % and increasing downwards. The organic matter from 0.01 to 0.31 % increasing upwards (see Table 5-13a). The sand ranged from 90.3 to 92.5 %, silt was 5.9 to 8.1 % and clay from 1.60 to 1.80%. The results of the soil moisture retention revled that the saturation ranged from 17.92 to 26.68 % and the field capacity ranged from 13.57 to 21.04 %, at the permanent wilting point it ranged from 2.35 to 3.86%. The volum of the quickly drainalbe pores ranged from 21.73 to 24.18 %, the slowly drainable pores ranged from 51.38 to 52.53 % and the volum of water holding pores ranged from 14.16 to 16.37 %, and the unusful pores ranged from 9.54 to 10.25 %.The bulk density ranged from 1.41 to 1.83 gm/cm3 (see Tables5-13b&C). These soils are covered by observation point number P12 which is take as representive profile of this unit. Observation No.
: - P12
Date of examination
: - 30 /9/2001
Location Latitude
: - El Imam El Ghazaly Village : - 30 o 41 \ 19 \\ N
125
Longitude Topography Elevation Land use Parent material Landscape Soil classification Irrigation Drainage Soil moisture condition
:- 30 o 22 \ 06 \\ E : - Back slope of Longitudinal sand dune : - 27 m A.S.L. : - Citrus trees : - Colluvial-Eolian sand deposits : - Plain : - Typic Torripsamments : - El-Bustan El-Gddiedah canal : - No drainage : - Moist below 90 cm.
Depth of ground water : - Very deep (>150 cm). Presence of rock outcrops : - few fine to medium gravels. Presence of salt or alkali : - Non. Erosion : - No evidence of erosion. Human influence : - Agriculture. Horizon Symbol Depth Description Ap 0 -25, Yellowish brown (10 YR 5/8) wet, Yellow (10 YR 7/8) dry; sandy; very week fine to medium sub-angular blocky structure ; non sticky, non plastic; many medium to coarse pores; no calcium carbonate; few fine roots ; clear wavy boundary . Cu1 25 -60 Yellowish brown (10 YR 5/8) wet, Yellow (10 YR 7/8) dry; sandy; massive structure ; non sticky, non plastic many medium to coarse pores ; no calcium carbonate; few very fine roots; gradual and irregular boundary. Cu2 60-150 Yellowish brown (10 YR 5/6) wet, Brownish yellow (10 YR 6/6) dry; sandy; massive structure; non sticky, non plastic; many fine to medium pores; few calcium carbonate; no roots; gradual and irregular boundary. Table (5-13a):- Chemical Analysis for Profile No. P12 Depth
pH
Cm
EC
Cations (meq/L)
Anions (meq/L)
ds/m
Ca++
Mg++
K+
Na+
Cl-
SO4--
SP. CaCO3 O.M.
CO3-- HCO3-
%
%
%
0-20
8.01
0.45
2.21
1.00
0.1
1.33
2.50
1.14
0.0
1.0
20
4.2
0.31
20-60
8.00
0.47
2.05
1.19
0.1
1.50
2.13
1.71
0.0
1.0
19
7.5
0.18
60-150
8.03
0.56
2.91
1.21
0.1
1.72
2.03
2.91
0.0
1.0
19
7.5
0.01
126
Table (5-13b):- Particle size distribution for Profile No. P12 Depth
Coarse Sand
Cm
%
%
0-20
79.1
20-60 60-150
Texture
%
Silt+Cla y %
Hydraulic conductivity
5.9
1.6
7.5
Sandy
5.05*10-3
91.5
6.7
1.8
8.5
Sandy
4.74*10-3
90.2
8.1
1.7
9.8
Sandy
3.79*10-3
Fine Sand Total Sand
Silt
Clay
%
%
13.4
92.5
77.3
14.2
75.1
15.1
Table (5-13c):- Soil Moisture Retention for Profile No. P12 Depth
Retained Moisture ( % weight)
NonBulk useful Density pores 30 30-9 9-0.2 Micron Micron Micron
PL3113, Typic Torripsamments:
The soils are sand dunes and the parent material is colluvial eolian deposits (Quaternary deposits), which is manly from eolian sand deposits. The surface is covered with few, fine to medium gravels. The groundwater is very deep. The color varies from yellow, light yellowish browen, yellowish brown, and brownish yellow, when dry and from yellowish brown to dark yellowish brown when wet. The texture was sandy in the all surface and subsurface layers. The structure is very week, fine subangular blocky in the surface layer and massive in the subsurface layers. The soil had many medium and coarse pores. The calcium carbonate and gypsum were low. The pH ranged from 7.7 to 8.39 and the EC ranged from 0.68 to 7.19 dS/m. Soluble Ca represented the major cation and ranged from 3.6 to 35.67 meq/l while Mg ranged from 1.6 to 13.41 meq/m and Na ranged from 1.34 to 14.6 meq/l. The major anion was chlorid and ranged 3.55 to 39.94 meq/L. CaCO3
127
ranged from 5.4 to 8.0 % and increasing downwards. The organic matter from 0.01 to 0.31 % increasing upwards (see Table 5-14a). The sand ranged from 89.3 to 91.8 %, silt was 6.6 to 8.9 % and clay from 1.60 to 1.80%. The results of the soil moisture retention revled that the saturation ranged from 19.47 to 35.90 % and the field capacity ranged from 19.69 to 26.5 %, at the permanent wilting point it ranged from 1.20 to 4.79 %. The volum of the quickly drainalbe pores ranged from 12.85 to 30.14 %, the slowly drainable pores ranged from 41.37 to 52.93 % and the volum of water holding pores ranged from 10.98 to 25.62 %, and the unusful pores ranged from 5.45 to 16.76 %.The bulk density ranged from 1.28 to 1.86 gm/cm3 (see Tables5-14b&C). These soils are covered by observation points number P7, M16, M19, M20, M21, M30, and M31. The obsevation P7 is taken as representive profile of this unit. Observation No.
: - P7
Date of examination Location Latitude Longitude Topography Elevation Land use Parent material Landscape
: - 30 /9/2001 : - Ali Bin Abi Talib Village : - 30 o 42 \ 52 \\ N :- 30 o 13 \ 57 \\ E : - Foot slope of Longitudinal sand dune : - 23 m A.S.L. : - Citrus trees : - Colluvial-Eolian sand deposits : - Plain
Soil classification Irrigation Drainage Soil moisture condition Depth of ground water Presence of rock outcrops Presence of salt or alkali Erosion Human influence Horizon Symbol Depth
: - Typic Torripsamments : - El-Bustan El-Gddiedah canal : - No drainage : - Moist below 70 cm. : - Very deep (>150 cm). : - few fine to medium gravels. : - Non. : - No evidence of erosion. : - Agriculture. Description
128
Ap
Cu1
Cu2
0 –25
Yellowish brown (10 YR 5/8) wet, Yellow (10 YR 7/8) dry; sandy; very week fine to medium sub-angular blocky structure ; non sticky, non plastic; many medium to coarse pores; no calcium carbonate; few fine roots ; clear wavy boundary . 25 -60 Yellowish brown (10 YR 5/8) wet, Yellow (10 YR 7/8) dry; sandy; massive structure ; non sticky, non plastic many medium to coarse pores ; no calcium carbonate; few very fine roots; gradual and irregular boundary. 60-150 Yellowish brown (10 YR 5/8) wet, Yellow (10 YR 7/8) dry; sandy; massive structure; non-sticky, non-plastic; many fine to medium pores; few calcium carbonate; no roots; gradual and irregular boundary.
Table (5-14a):- Chemical Analysis for Profile No. P7 Depth
pH
Cm
EC
Cations (meq/L)
Anions (meq/L)
dS/m
Ca++
Mg++
K+
Na+
Cl-
SO4--
SP. CaCO3 O.M.
CO3-- HCO3-
%
%
%
0-25
7.77
0.99
5.14
2.44
0.1
2.61
6.04
1.85
0.0
2.4
22
6.6
0.34
25-60
8.39
2.10
9.21
4.14
0.2
8.3
15.44
3.41
0.0
3.0
22
6.6
0.15
60-150
8.38
6.14
35.13
13.35
0.2
14.2
42.12
17.76
0.0
3.0
24
7.0
0.07
Table (5-14b):- Particle size distribution for Profile No. P7 Depth
Coarse Sand
Fine Sand
Cm
%
%
Total Sand %
Texture
%
Silt+Cla y %
Hydraulic conductivity
0-25
79.0
12.8
6.6
1.6
8.2
Sandy
4.78*10-3
25-60
73.9
90.5
7.9
1.6
9.5
Sandy
3.16*10-3
60-150
72.9
89.3
8.9
1.8
10.7
Sandy
2.84*10-3
Silt
Clay
%
91.8
16.6 16.4
Table (5-14c):- Soil Moisture Retention for Profile No. P7 Depth
Retained Moisture ( % weight) 0.0 bar
0.10 bar
0.33 bar
10.0 bar
15.0 bar
0-25
35.90
26.5
17.83 11.73 8.24 6.53
4.79
28.97
41.37
16.32
13.34
1.28
25-60
19.47 14.69
3.39
2.21 1.51 1.39
1.20
24.55
58.02
11.27
6.16
1.86
3.35
2.80 1.50 1.32
1.28
24.33
51.93
11.28
12.54
1.85
15.5
5.0 bar
NonBulk useful Density pores 30 30-9 9-0.2 Micron Micron Micron
PL3114, Typic Torripsamments:
129
The soils are sand dunes and the parent material is colluvial eolian deposits (Quaternary deposits), which is manly from eolian sand deposits. The surface is covered with few, fine to medium gravels. The groundwater is very deep. The color varies from yellow, light yellowish browen, yellowish brown, and brownish yellow, when dry and from yellowish brown to dark yellowish brown when wet. The texture was sandy in the all surface and subsurface layers. The structure is very week, fine subangular blocky in the surface layer and massive in the subsurface layers. The soil had many medium and coarse pores. The calcium carbonate and gypsum were low. The pH ranged from 7.78 to 8.38 and the EC ranged from 0.60 to 7.33 dS/m. Soluble Ca represented the major cation and ranged from 3.02 to 35.58 meq/l while Mg ranged from 1.68 to 13.25 meq/m and Na ranged from 2.5 to 14.3 meq/l. The major anion was chlorid and ranged 3.55 to 39.84 meq/L. CaCO3 ranged from 4.1 to 10.8 % and increasing downwards. The organic matter from 0.01 to 0.31 % increasing upwards (see Table 5-15a). The sand ranged from 91.1 to 94.2 %, silt was 4.1 to 7.4 % and clay from 1.50 to 2.10%. The results of the soil moisture retention revled that the saturation ranged from 20.85 to 23.68 % and the field capacity ranged from 16.67 to 18.43 %, at the permanent wilting point it ranged from 1.72 to 3.06 %. The volum of the quickly drainalbe pores ranged from 12.22 to 31.69 %, the slowly drainable pores ranged from 39.15 to 55.03 % and the volum of water holding pores ranged from 11.24 to 28.03 %, and the unusful pores ranged from 5.49 to 14.56 %.The bulk density ranged from 1.47 to 1.75 gm/cm3 (see Tables5-15b&C). These soils are covered by observation points number P8, M1, M2, M13, M14, M22, M23, M24, M32, M33, M43, and M44. The obsevation P8 is taken as representive profile of this unit. Observation No. Date of examination Location Latitude Longitude
: -P8 : - 28 /9/2001 : - Ali Bin Abi Talib Village : - 30 o :- 30 o
43 \ 58 \\ 15 \ 50 \\
130
N E
Topography Elevation Land use Parent material Landscape Soil classification Irrigation Drainage Soil moisture condition Depth of ground water
: - Toe slope of Longitudinal sand dune : - 19 m A.S.L. : - Citrus and Banana trees : - Colluvial-Eolian sand deposits : - Plain : - Typic Torripsamments : - El-Bustan El-Gddiedah canal : - No drainage : - Moist below 60 cm. : - Very deep (>150 cm).
Presence of rock outcrops : - few fine to medium gravels. Presence of salt or alkali : - Non. Erosion : - No evidence of erosion. Human influence : - Agriculture. Horizon Symbol Depth Description Ap 0 -25, Yellowish brown (10 YR 5/8) wet, Yellowish brown (10 YR 6/8) dry; sandy; very week fine to medium sub-angular blocky structure ; non sticky, non plastic; many medium to coarse pores; no calcium carbonate; few fine roots ; clear wavy boundary . Cu1 25 -60 Yellowish brown (10 YR 5/8) wet, Brownish yellow (10 YR 6/6) dry; sandy; massive structure ; non sticky, non plastic many medium to coarse pores ; no calcium carbonate; few very fine roots; gradual and irregular boundary. Cu2 60-150 Yellowish brown (10 YR 5/6) wet, Brownish yellow (10 YR 6/6) dry; sandy; massive structure; non-sticky, non-plastic; many fine to medium pores; few calcium carbonate; no roots; gradual and irregular boundary. Table (5-15a):- Chemical Analysis for Profile No. P8 Depth
pH
Cm
EC
Cations (meq/L)
Anions (meq/L)
ds/m
Ca++
Mg++
K+
Na+
Cl-
SO4--
SP. CaCO3 O.M.
CO3-- HCO3-
%
%
%
0-25
8.21
0.64
2.58
1.48
0.1
2.5
3.00
1.66
0.0
2.0
20
7.5
0.43
25-60
8.28
1.04
6.16
2.45
0.1
2.5
5.45
3.76
0.0
2.0
20
7.5
0.18
60-150
8.29
1.15
6.15
2.88
0.15
2.90
5.20
3.88
0.0
3.0
23
7.9
0.07
131
Table (5-15b):- Particle size distribution for Profile No. P8 Depth
Coarse Sand
Cm
%
%
0-25
75.0
25-60 60-150
Texture
%
Silt+Cla y %
Hydraulic conductivity
4.1
1.7
5.8
Sandy
3.99*10-3
92.4
5.5
2.1
7.6
Sandy
3.87*10-3
91.1
7.4
1.5
8.9
Sandy
3.57*10-3
Fine Sand Total Sand
Silt
Clay
%
%
19.2
94.2
72.2
20.2
71.5
19.6
Table (5-15c):- Soil Moisture Retention for Profile No. P8 Depth
Retained Moisture ( % weight) 5.0 bar
NonBulk useful Density pores 30 30-9 9-0.2 Micron Micron Micron
PL3121, Typic Torripsamments:
The soils are sand dunes and the parent material is colluvial eolian deposits (Quaternary deposits), which is manly from eolian sand deposits. The surface is covered with few, fine to medium gravels. The groundwater is very deep. The color varies from yellow, light yellowish browen, yellowish brown, and brownish yellow, when dry and from yellowish brown to dark yellowish brown when wet. The texture was sandy in the all surface and subsurface layers. The structure is very week, fine subangular blocky in the surface layer and massive in the subsurface layers. The soil had many medium and coarse pores. The calcium carbonate and gypsum were low. The pH ranged from 7.92 to 8.38 and the EC ranged from 0.51 to 3.93 dS/m. Soluble Ca represented the major cation and ranged from 1.30 to 13.16 meq/l while Mg ranged from 0.62 to 4.82 meq/m and Na ranged from 3.24 to 10.21 meq/l. The major anion was chlorid and ranged 1.40 to 30.54 meq/L. CaCO3
132
ranged from 4.0 to 10.8 % and increasing downwards. The organic matter from Nil to 0.41 % increasing upwards (see Table 5-16a). The sand ranged from 91.0 to 96.7 %, silt was 2.3 to 5.8 % and clay from 1.00 to 3.60%. The results of the soil moisture retention revled that the saturation ranged from 19.47 to 32.9 % and the field capacity ranged from 14.69 to 26.50 %, at the permanent wilting point it ranged from 1.20 to 4.79%. The volum of the quickly drainalbe pores ranged from 19.11 to 31.9 %, the slowly drainable pores ranged from 45.14 to 53.31 % and the volum of water holding pores ranged from 13.27 to 16.97 %, and the unusful pores ranged from 8.75 to 11.27 %.The bulk density ranged from 1.28 to 1.86 gm/cm3 (see Table 516b&c). These soils are covered by observation points number P9, M18, and M41. The obsevation P9 is take as representive profile of this unit. Observation No.
: - P9
Date of examination
: - 31 /9/2001
Location Latitude Longitude Topography Elevation Land use Parent material Landscape Soil classification Irrigation Drainage Soil moisture condition Depth of ground water Presence of rock outcrops Presence of salt or alkali Erosion Human influence Horizon
: - Al Sharawi Village : - 30 o 41 \ 19 \\ N :- 30 o 22 \ 06 \\ E : - Top of Pyramidal sand dune : - 32 m A.S.L. : - Citrus trees : - Colluvial-Eolian sand deposits : - Plain : - Typic Torripsamments : - El-Bustan El-Gddiedah canal : - No drainage : - Moist below 90 cm. : - Very deep (>150 cm). : - few fine to medium gravels. : - Non. : - No evidence of erosion. : - Agriculture.
Symbol
Depth
Description
133
Ap
0 -25,
Dark yellowish brown (10 YR 4/6) wet, Yellowish brown (10 YR 5/6) dry; sandy; very week fine to medium sub-angular blocky structure ; non sticky, non plastic; many medium to coarse pores; no calcium carbonate; few fine roots ; clear wavy boundary . 25 -60 Yellowish brown (10 YR 5/8) wet, Yellow (10 YR 7/8) dry; sandy; massive structure ; non sticky, non plastic many medium to coarse pores ; no calcium carbonate; few very fine roots; gradual and irregular boundary. 60-150 Yellowish brown (10 YR 5/6) wet, Brownish yellow (10 YR 6/6)
Cu1
Cu2
dry; sandy; massive structure; non-sticky, non-plastic; many fine to medium pores; few calcium carbonate; no roots; gradual and irregular boundary. Table (5-16a):- Chemical Analysis for Profile No. P9 Depth
pH
Cm
EC
Cations (meq/L)
Anions (meq/L)
ds/m
Ca++
Mg++
K+
Na+
Cl-
SO4--
SP. CaCO3 O.M.
CO3-- HCO3-
%
%
%
0-25
8.38
0.80
3.02
1.68
0.1
3.5
3.55
3.25
0.0
1.5
20
8.3
0.41
25-60
8.35
0.80
3.52
2.95
0.1
2.5
4.20
2.87
0.0
2.0
20
8.3
0.11
60-150
8.01
0.96
4.93
2.25
0.1
2.5
5.1
3.18
0.0
1.5
19
10.8
0.03
Table (5-16b):- Particle size distribution for Profile No. P9 Depth
Coarse Sand
Cm
%
%
0-25
69.5
25-60 60-150
Texture
%
Silt+Cla y %
Hydraulic conductivity
2.3
1.0
3.3
Sandy
6.47*10-3
95.4
3.4
1.2
4.6
Sandy
4.15*10-3
94.2
4.3
1.5
5.8
Sandy
3.67*10-3
Fine Sand Total Sand
Silt
Clay
%
%
27.2
96.7
68.0
27.4
64.5
29.7
Table (5-16c):- Soil Moisture Retention for Profile No. P9 Depth
Retained Moisture ( % weight) 0.0 bar
0.10 bar
0.33 bar
10.0 bar
15.0 bar
0-25
32.9
26.5
18.83 12.73 8.24 6.53
4.79
31.90
45.14
14.18
8.78
1.31
25-60
19.47 14.69
3.39
2.24 1.51 1.39
1.20
23.38
49.52
18.35
8.75
1.80
3.53
2.80 1.50 1.32
1.28
23.77
53.31
13.27
9.65
1.75
15.5
5.0 bar
NonBulk useful Density pores 30 30-9 9-0.2 Micron Micron Micron
134
PL3122, Typic Torripsamments:
The soils are sand dunes and the parent material is colluvial eolian deposits (Quaternary deposits), which is manly from eolian sand deposits. The surface is covered with few, fine to medium gravels. The groundwater is very deep. The color varies from yellow, light yellowish browen, yellowish brown, and brownish yellow, when dry and from yellowish brown to dark yellowish brown when wet. The texture was sandy in the all surface and subsurface layers. The structure is very week, fine subangular blocky in the surface layer and massive in the subsurface layers. The soil had many medium and coarse pores. The calcium carbonate and gypsum were low. The pH ranged from 7.92 to 8.11 and the EC ranged from 0.49 to 1.45 dS/m. Soluble Ca represented the major cation and ranged from 2.69 to 3.75 meq/l while Mg ranged from 1.01 to 1.32 meq/m and Na ranged from 2.00 to 4.33 meq/l. The major anion was chlorid and ranged 1.79 to 7.87 meq/L. CaCO3 ranged from 4.0 to 10.7 % and increasing downwards. The organic matter from Nil to 0.59 % increasing upwards (see Table 5-17a). The sand ranged from 87.1 to 93.3 %, silt was 5.5 to 10.9 % and clay from 1.10 to 2.80%. The results of the soil moisture retention revled that the saturation ranged from 22.99 to 26.26 % and the field capacity ranged from 7.79 to 19.13 %, at the permanent wilting point it ranged from 1.72 to 2.55 %. The volum of the quickly drainalbe pores ranged from 26.18 to 33.15 %, the slowly drainable pores ranged from 45.37 to 54.93 % and the volum of water holding pores ranged from 11.28 to 15.32 %, and the unusful pores ranged from 7.11 to 9.21 %.The bulk density ranged from 1.47 to 1.75 gm/cm3 (see Tables5-17b&C).
Observation points number P1 and M17
cover these soils. The obsevation P1 is taken as representive profile of this unit. Observation No.: - P1 Date of examination
: - 27 /9/2001
135
Location Latitude Longitude Topography Elevation Land use Parent material Landscape Soil classification Irrigation
: - Tawfiq El Hakim Village : - 30 o 44 \ 30 \\ N :- 30 o 13 \ 19 \\ E : - Slope of Pyramidal sand dune : - 20 m A.S.L. : - Citrus trees : - Colluvial-Eolian sand deposits : - Plain : - Typic Torripsamments : - El-Bustan El-Gddiedah canal
Drainage : - No drainage Soil moisture condition : - Moist below 70 cm. Depth of ground water : - Very deep (>150 cm). Presence of rock outcrops : - few fine to medium gravels. Presence of salt or alkali : - Non. Erosion : - No evidence of erosion. Human influence : - Agriculture. Horizon Symbol Depth Description Ap 0 -25 Dark yellowish brown (10 YR 4/6) wet, Yellowish brown (10 YR 5/6) dry; sandy; very week fine to medium sub-angular blocky structure ; non sticky, non plastic; many medium to coarse pores; no calcium carbonate; few fine roots ; clear wavy boundary . Cu1 25 -60 Yellowish brown (10 YR 5/8) wet, Yellow (10 YR 7/8) dry; sandy; massive structure ; non sticky, non plastic many medium to coarse pores ; no calcium carbonate; few very fine roots; gradual and irregular boundary. Cu2 60-150 Yellowish brown (10 YR 5/6) wet, Brownish yellow (10 YR 6/6) dry; sandy; massive structure; non sticky, non plastic; many fine to medium pores; few calcium carbonate; no roots; gradual and irregular boundary.
Table (5-17a):- Chemical Analysis for Profile No. P1 Depth Cm
pH
EC ds/m
Cations (meq/L) Ca++
Mg++
K+
Anions (meq/L) Na+
136
Cl-
SO4--
CO3-- HCO3-
SP. CaCO3 O.M. %
%
%
0-25
8.09
0.56
2.71
1.23
0.1
2.51
2.80
1.75
0.0
2.0
22
8.1
0.59
25-60
8.11
0.49
2.63
1.01
0.1
2.0
2.71
1.53
0.0
1.5
20
8.7
0.21
60-150
8.02
0.51
2.69
1.11
0.1
2.0
2.81
1.59
0.0
1.5
19
10.7
0.03
Table (5-17b):- Particle size distribution for Profile No. P1 Depth
Coarse Sand
Fine Sand
Cm
%
%
Total Sand %
Texture
%
Silt+Cla y %
Hydraulic conductivity
0-25
79.0
12.8
6.6
1.6
8.2
Sandy
5.35*10-3
25-60
73.9
90.5
7.9
1.6
9.5
Sandy
4.98*10-3
60-150
65.3
87.1
10.9
2.0
12.9
Sandy
4.59*10-3
Silt
Clay
%
91.8
16.6 21.8
Table (5-17c):- Soil Moisture Retention for Profile No. P1 Depth
Retained Moisture ( % weight) 0.33 bar
1.0 bar
10.0 bar
15.0 bar
0-25
26.26 19.18
6.81
4.51 3.29 2.78
2.55
30.97
45.37
15.32
8.34
1.70
25-60
22.99 15.70
4.79
3.20 2.71 2.39
1.73
28.55
52.02
12.27
7.16
1.75
5.03
2.80 1.90 1.42
1.27
28.3
54.93
11.28
7.54
1.47
60-130 23.18
7.78
5.0 bar
NonBulk useful Density pores 30 30-9 9-0.2 Micron Micron Micron
5.6 Monitoring Waterlogging Problem Waterlogging and salinity are universal problems of irrigated agriculture in arid and semi-arid regions. The risk of their occurrence has to be defined early in the planning, designing and construction processes of new system (Bourrfa and Zimmer, 1994). EL-Bustan Agricultural Development Project (BADP, 1995) concluded that many constraints in the Bustan 1&2 (e.g. poor soil fertility and low organic matter content, poor soil physical characteristics, lack of appropriate cropping pattern and farming techniques, lack of proper skills, experience and extension advice, and marketing problem) are common to small-holders throughout the new land areas. The Waterlogging problem appeared in some areas in El-Bustan 1&2 which was mainly due to seepage from irrigation canals, change from modern irrigation systems (sprinkle and 137
drip) to surface irrigation system, lack of information about crop water requirements and irrigation scheduling and insufficient drainage system. The result of applying the Maximum Likelihood classification to the map list of the TM bands 2, 4, and 7 of August 1990 shows in Figure (5-15). It shows that there is no feddans were classified as Waterlogging areas in El-Bustan 1&2 during this year, which is the started time to cultivate the studied area. The result of applying the Maximum Likelihood classification to the map list of the TM bands 1, 2, 3, 4, 5, and 7 of August 1997 shows in Figure (5-16). It shows that about 600 feddans were classified as Waterlogging areas cover 1.35% of the total area of El-Bustan 1&2.
138
Figure (5-15) The result of applying the Maximum Likelihood classification to the TM of September 1990
Figure (5-16) The result of applying the Maximum Likelihood classification to the TM of August 1997
The result of applying the Maximum Likelihood classification to the map list of the TM bands 1, 2, 3, 4, 5, and 7 of December 1999 shows in Figure (517). It shows that about 615 feddans were classified as Waterlogging areas
139
cover 1.37% of the total area of El-Bustan 1&2. The result shows that 410 feddans (61.52% of the Waterlogging areas) were find in the both two years and only 255 feddans (38.48%) were occurred in different areas each year. Using the crossing facility of ILWIS.3.11 between the Waterlogging areas in both years and then cross the result with the Geopedological mapping units were showed in Table (5-18).
Figure (5-17) The result of applying the Maximum Likelihood classification to the TM of December 1999
The results of crossing operation show that, the flat areas (PL212 and PL213) were effected by water logging in both years, but there is slightly decreased in mapping unit PL211. The sand dune areas were not effected, and only small area in mapping unit PL3114 was effected by water logging and it increased from 0.77 % in year 1997 to 1.13% in year 1999. This result is logic due to the deep seepage from higher areas (sand dune areas), seepage from irrigation canals which is high than the cultivated areas, and changing the modern irrigation systems to flooding irrigation system. Figure (5-18) shows the relation between the Geomorphic mapping units and the Waterlogging areas in the different years.
140
Table (5-20) The results of crossing the Geopedological mapping units and the Waterlogging areas in both years 1997 and 1999. Year 1990 Waterlogging area
Mapping units
Year 1997 Waterlogging area
Year 1999 Waterlogging area
feddans
%
feddans
%
feddans
%
Flat areas
PL211 PL212 PL213 Total
0 0 0 0
0.0 0.0 0.0 0.0
130 175 180 485
1.58 1.86 12.82 2.6
90 175 180 445
1.12 1.86 12.82 2.32
Sand Dunes areas
PL3111 PL3112 PL3113 PL3114 PL3121 PL3122 PL313 Total
0 0 0 0 0 0 0 0
0.0 0.0 0.0 0.0 0.0 0.0 0.0 0.0
0 0 0 115 0 0 0 115
0.0 0.0 0.0 0.77 0.0 0.0 0.0 0.46
0 0 0 170 0 0 0 170
0.0 0.0 0.0 1.13 0.0 0.0 0.0 0.68
Geomorphic mapping units and its relation w ith w aterlogging areas
160 140 120 100 80 60 40
PL313
PL3122
PL3121
PL3114
PL3113
PL3112
PL3111
PL213
0
PL212
20
PL211
waterloggingarea in feddans per each mapping units
180
Geomorphic mapping units
year 1990
year 1997
year 1999
Figure (5-18) The relation between Geomorphic mapping units and the Waterlogging areas of different years
Pores size distributions were calculated using the result of the pressure membrane apparatus of undisturbed soil samples. Table (5-19) shows the pores size distribution of each mapping unit. 141
Table (5-19) The pores size distribution of each mapping unit Mapping units
Point No. P2
M5
M9
P5 PL211 M12
M26
M34
M45
M7
P4
M27 PL212 M28
M38
M39
P6
PL213
P3 P10 M36
Depth 0-25 25-60 60-150 0-25 25-60 60-150 0-20 20-60 60-150 0-20 20-60 60-150 0-20 20-60 60-150 0-20 20-60 60-150 0-20 20-60 60-150 0-25 25-60 60-150 0-20 20-60 60-150 0-25 25-60 60-150 0-20 20-60 60-150 0-20 20-60 60-150 0-20 20-60 60-150 0-25 25-60 60-150 0-20 20-60 60-150 0-25 25-60 60-150 0-15 15-35 0-15 15-40
Distribution of pores size % of the total pores > 30 30 - 9 9 – 0.2 < 0.2 34.90 35.14 19.18 10.78 20.38 46.52 24.35 8.75 22.77 53.31 13.27 10.65 31.3 38.15 20.20 10.35 21.5 45.34 23.11 10.05 23.18 51.41 14.14 11.27 22.34 43.42 22.07 12.17 24.46 39.71 20.48 15.35 17.11 32.31 20.97 29.61 21.60 48.07 19.15 11.18 22.19 45.34 25.62 6.85 12.85 50.86 19.33 16.96 32.80 38.15 20.15 9.35 20.50 46.34 23.00 10.16 22.08 52.52 22.10 12.14 35.80 34.04 19.35 10.81 31.20 38.25 20.15 10.40 24.50 39.71 20.40 15.39 34.15 36.10 18.19 11.56 30.10 39.38 20.13 10.39 29.35 40.12 19.98 10.55 35.15 33.48 20.19 11.18 29.83 45.13 15.60 9.44 22.15 48.17 17.13 12.55 25.18 32.10 31.14 11.58 25.91 40.98 24.15 8.96 23.14 43.78 25.13 7.95 26.89 30.20 32.96 10.22 24.36 42.28 23.09 10.27 22.96 45.36 24.03 7.65 29.16 38.19 20.89 11.76 22.90 40.17 25.15 11.78 19.25 49.35 23.25 8.15 16.85 46.92 20.89 15.34 23.21 49.98 17.56 9.25 18.22 48.21 23.31 10.26 30.15 39.18 19.25 11.42 22.21 45.20 18.05 14.54 17.91 46.80 20.14 15.15 24.38 45.15 20.78 9.69 20.15 48.38 23.89 7.58 17.99 50.54 23.19 8.28 25.80 41.12 22.92 10.16 22.74 22.80 24.11 30.35 21.96 11.71 27.99 38.34 29.74 49.81 14.10 6.35 25.28 41.94 19.19 13.59 11.75 40.41 24.48 23.36 22.08 39.75 23.05 15.12 10.04 14.75 36.05 39.19 21.00 38.75 24.05 16.20 11.40 13.83 37.13 37.64
142
Table (5-19) cont. Mapping units
Point No.
PL213
M37
PL3111
P11
PL3112
P12
P7
M16
M19
PL3113
M20
M21
M30
M31
M1
M2
M13
M14 PL3114 M22
M23
P8
M32
Depth 0-25 25-60 60-150 0-25 25-60 60-150 0-25 25-60 60-150 0-25 25-60 60-150 0-25 25-60 60-150 0-20 20-60 60-150 0-25 25-60 60-150 0-25 25-60 60-150 0-20 20-60 60-150 0-20 20-60 60-150 0-25 25-60 60-150 0-25 25-60 60-150 0-25 25-60 60-150 0-20 20-60 60-150 0-25 25-60 60-150 0-20 20-60 60-150 0-25 25-60 60-150 0-25 25-60 60-150
Distribution of pores size % of the total pores > 30 30 - 9 9 – 0.2 < 0.2 26.76 50.83 15.76 6.65 19.04 42.85 21.53 16.58 17.19 38.05 25.82 18.94 30.15 37.37 25.15 7.33 24.51 51.94 12.34 11.21 22.19 54.39 15.10 8.32 22.71 51.38 16.37 9.54 24.18 51.41 14.16 10.25 21.73 52.53 15.19 10.55 28.97 41.37 16.32 13.34 24.55 58.02 11.27 6.16 24.33 51.93 11.28 12.54 24.89 49.39 17.56 8.16 22.13 50.89 19.33 7.65 21.61 48.99 20.15 9.25 31.13 48.15 13.10 7.62 26.0 48.11 16.15 9.74 24.18 51.43 16.20 8.19 22.19 45.34 25.62 6.85 21.40 48.27 19.25 11.08 12.85 50.87 19.53 16.76 28.13 45.11 16.32 10.44 24.55 58.02 11.27 6.16 24.33 58.93 11.28 5.45 31.51 48.12 13.51 6.86 26.75 47.61 19.13 6.51 23.21 55.03 16.15 5.61 30.14 48.95 10.98 9.93 21.23 54.29 11.14 13.34 14.95 58.13 16.68 10.24 26.95 47.11 16.22 9.72 31.69 47.48 13.30 7.53 23.28 55.03 16.20 5.49 28.17 45.38 16.13 10.32 24.38 51.99 11.40 12.23 24.55 54.74 13.29 7.42 30.30 39.15 19.20 11.35 22.50 44.34 22.11 11.05 22.18 52.41 14.14 11.27 23.60 46.07 19.25 11.08 22.19 45.34 21.62 10.85 14.85 50.86 19.33 14.96 25.13 50.39 12.24 12.24 22.28 50.95 12.90 13.87 18.94 55.96 16.69 8.41 21.13 54.39 11.24 13.24 24.28 48.95 12.90 13.87 14.94 59.96 16.69 8.41 29.59 36.17 22.20 12.04 12.22 45.19 28.03 14.56 16.83 59.80 15.12 8.25 24.59 40.17 20.20 14.04 17.22 44.19 22.03 14.56 19.83 55.80 15.12 9.25
143
Table (5-19) cont. Mapping units
Point No. M33
PL3114
M43
M44
M18
PL3121
M41
P9
P1 PL3122 M17
Depth 0-25 25-60 60-150 0-20 20-60 60-150 0-25 25-60 60-150 0-25 25-60 60-150 0-25 25-60 60-150 0-25 25-60 60-150 0-25 25-60 60-150 0-25 25-60 60-150
>30 Micron: Quick drainage pores. 9-0.2 Micron: Water holding pores.
Distribution of pores size % of the total pores > 30 30 - 9 9 – 0.2 < 0.2 27.17 46.38 15.13 11.32 24.38 50.99 12.40 12.23 22.55 54.74 13.29 9.42 25.95 48.11 15.22 10.72 24.69 54.48 12.30 8.53 23.28 55.03 13.20 8.49 22.17 49.38 17.13 11.32 23.38 51.99 12.40 12.23 22.55 54.74 13.29 9.42 33.15 47.37 12.15 7.33 28.51 48.94 14.34 9.21 26.19 50.39 15.10 8.32 27.71 48.38 14.37 9.54 26.18 51.41 14.16 8.25 26.73 52.53 13.19 7.55 30.97 45.37 15.32 8.34 28.55 52.02 12.27 7.16 28.33 54.93 11.28 7.54 31.90 45.14 14.18 8.78 23.38 49.52 18.35 8.75 23.77 53.31 13.27 9.65 31.15 45.30 14.20 9.35 26.50 45.34 18.11 10.05 23.18 50.41 15.14 11.27
30-9 Micron: Slow drainage pores. >0.2 Micron: Non-Useful pores.
The results show that the slow drainage pores (30-9 Micron) were the predominant size in both flat and sand dunes areas, but the mapping unit PL213 (depression). The pores size distribution of quick and slow drainage pores in the sand dunes areas were ranged between 70% to 80%, therefore, the water movement downward was easy. Also the pores size distribution of quick and slow drainage pores in the mapping units PL211 and PL212 (flat area) were ranged between 60% to 70%, therefore, the water movement downward was easy. The mapping units PL213 show less in the quick and slow drainage pores and increases in the Water holding and Non-Useful pores. The pores size distributions of quick and slow drainage pores in this mapping unit were ranged between 25% to 60%, and the Water holding and Non-Useful pores were ranged between 40% to 75%. For that the problem of Waterlogging areas occurred in the mapping units PL213 much more than the other mapping units.
144
Also to understand the reason why the Waterlogging areas were found in the flat areas, the filter operation was used to create slope % and shadow maps from the DTM value map. Figure (5-19) shows the slope % map.
Figure (5-19) The Slope Aspect Map of the Studied Area
The result shows that the slope percent were ranged between 0.0 to 2.50 % and the highest area direction (sand dune areas) were from west and southern west direction to the flat areas.
Figure (5-20) shows the result of using filter operation to create The Hill Shadow map. The result also show that there is high sand dunes (longitudinal sand dunes) in the west and the northern west direction and goes down to the flat areas. And there are some depressions in the flat areas, which received the deep seepage from the sand dunes area and the irrigation canal. Also there is pyramid sand dune in the northern west direction has the same effects of the longitudinal sand dunes.
145
Figure (5-20) The Hill Shadow Map of the Studied Area
5.7 Land Degradation Assessment Using GLASOD Methodology The holders skill different from ordinary farmers, young graduate, company’s workers and investors, therefore the management will be apply by different ways. Land degradation start to take place in the study area due to many reasons. The area was planning to use modern irrigation systems and it is not needed for building drainage systems for the area. In year 1995 the farmers change the modern irrigation system to flood irrigation systems due to lack of crop water requirement, lack of crop rotations, lack of modern irrigation systems knowledge. Also they planting Banana in the area, which has high amount of water requirement. There is also lack of pedological studies to determine the hard pan layer and deep seepage drive from the irrigation canal to low land. From all this reasons the area face the problem of Waterlogging, which effects on the soil properties (Chemical and Physical). The objective of GLASOD is: “Strengthening the awareness of policy-makers and decision-makers of the
146
dangers resulting from inappropriate land and water management, and leading to a basis for the establishment of priorities for action programms” (Oldeman, 1990). The data of the fieldwork 2001 shows that there are differences between the data of this year and year 1986 in the effective soil depth, EC values, total calcium carbonate, and the bulk density. Three degradation types were recognized in the studied area, physical deterioration (water logging Pw and compaction Pc), and chemical deterioration (salinization Cs). Therefore the indicators of effective soil depth, EC values, and bulk density were used to assess land degradation for Waterlogging, salinization, and compaction respectively. According FAO 1978 the salinity and bulk density hazard were calculated for the layer 0-60 cm. Therefore, the weighted average EC and bulk density values of the layer 0-60-cm were calculated and analyze using ANOVA and Geostatistical analyses. 5.7.1 The ANOVA of Year 1986 In this analysis, the variation among groups (between groups) corresponds to the (EC measurements, total calcium carbonate % and bulk density of the three layers and its average of layer 0-60 cm depth) and the variation within groups (within groups) corresponds to the Geomorphic mapping units. The degree of freedom of within group is 8 (9 Geomorphic mapping units – 1) and for between groups is 608 ((617 observation – 1) - (9 Geomorphic mapping units – 1)). The Sums of squares of between groups represent variation between the grouping of Geopedological mapping units. The sums of squares of the within groups represent variation between the EC, total calcium carbonate % and bulk density of the three layers and its weighted average of layer 0-60 cm depth measurements. The mean squares of between groups and within groups represent variation between the effective soil depth measurements. The mean squares of between groups and within groups are calculated by divide the corresponding sums of squares by its degrees of freedom. F-statistic (F-ratio) calculates by divide the mean square of between groups by the mean of within groups. The probability (P) value of
147
the F-test shows that the probability of the random distribution of the variables and its significant at level 0.01. In Table (5-20) the results of ANOVA table of the EC, total calcium carbonate %, bulk density of the three layers and the weighted average of this variables for layer 0-60 cm depth of year 1986. The analysis shows that, the probability (P) value of the F-test shows that the probability of the random distribution of the EC, total calcium carbonate % of the three layers and the weighted average of this variables for 60 cm depth were highly significant at level 0.01. Because the calculated value of the F-statistic (3.289, 5.426, 3.687, 3.999, 3.785, 3.497 and 3.148) are larger than the value of F-table (2.51) respectively at significant level 0.01. The data in the table indicates that the EC, total calcium carbonate % of the three layers and the weighted average of these variables for 60 cm depth are soil properties that differentiates the 9 soil map units (groups). The probability (P) value of the F-test shows that the probability of the random distribution of the bulk density of the three layers and the weighted average of this variable for layer 0-60 cm depth is not significant at level 0.01. Because the calculated value of the F-statistic (1.000, 2.526, 1.042) were smaller than the value of F-table (2.74) at significant level 0.01. But the probability of the random distribution of the bulk density of the second subsurface layer was highly significant at level 0.01. Because the calculated value of the F-statistic (3.612) were larger than the value of F-table (2.74) at significant level 0.01.The data of the bulk density in the table indicates that the surface and first subsurface layers were not soil property that differentiates the nine soil map units (groups). Only the second subsurface layer was soil property that differentiates the nine soil map units (groups).
148
Table (5-20) The Results of ANOVA Table of the Soil Properties Year 1986 Variable EC value of surface layer
EC value of first sub-surface layer EC value of second subsurface layer EC value of layer 0-60cm Calcium carbonate % of surface layer Calcium carbonate % of first sub-surface layer Calcium carbonate % of second subsurface layer Bulk density of surface layer Bulk density of first sub-surface layer Bulk density of second subsurface layer Bulk density of layer 0-60cm
Source of variation Between Groups Within Groups Total Between Groups Within Groups Total Between Groups Within Groups Total Between Groups Within Groups Total Between Groups Within Groups Total Between Groups Within Groups Total Between Groups Within Groups Total Between Groups Within Groups Total Between Groups Within Groups Total Between Groups Within Groups Total Between Groups Within Groups Total
Sum of Squares
df
555779
8
69472
12843297 13399076
608 616
21123
1280972
8
160121
17942978 19223950
608 616
29511
8
105534
17401577 18245855
608 616
28621
1101211
8
137651
20925833 22027044
608 616
34417
8
77257
608 616
20440
8
90211
608 616
25796
8
67289
608 616
21378
0.01
8
0.001
0.11 0.12
80 88
0.001
0.04
8
0.006
0.18 0.22
80 88
0.002
0.04
8
0.006
0.14 0.18
80 88
0.002
0.01
8
0.001
0.09 0.10
80 88
0.001
844578
618054 12427748 13045802 721692 15683992 16405684 538316 12998085 13536401
Mean Square
F calc.
F0.1 Sig. table
3.29
2.51 0.001
5.43
2.51 0.000
3.69
2.51 0.001
4.00
2.51 0.000
3.78
2.51 0.001
3.50
2.51 0.001
3.15
2.51 0.001
1.00
2.74 0.437
3.00
2.74 0.045
3.00
2.74 0.045
1.00
2.74 0.437
5.7.2 Geostatistical Analysis Semi-variogram models were calculated using the software “ILWIS 3.11” for the EC and bulk density of the weighted average layer (0-60cm) of the year 1986 to investigate the spatial variability of soil properties. The 149
parameters of the best-fitted curves of all the variables of year 1986 are showed in Table (5-21). The bulk density gave total nugget.
Table (5-21) The Models Parameters of the EC Value (0-60 cm) of Years 1986. Semivariogram model
Dataset
The EC average of the first 60 cm
Spherical Exponential Gaussian Wave Power (Liner)
Parameters Nugget
Sill or slope
Range
0.250 1.270 0.270 0.920 0.352
0.387 0.389 0.388 0.382 0.0001
2250 950 110 900 1.000
Total range 10000 10000 10000 10000 10000
Goodness of fitting R2 -0.751 -0.779* -0.764 -0.375 -0.698
5.7.3 Creating Effective Soil Depth, Soil Salinity and Bulk Density of Year 1986 The location maps of the observation points in the year 1986 were created and then attribute table was established using the domain of year 1986. Using the table operations, the effective soil depth, EC value and bulk density of the depth of 0-60 cm point maps were obtained. From the reports of GARDAP, 1986a-b, ANOVA and Geostatistical analyses, we can create soil future maps as following: 1- The effective soil depths were very deep in all observation points according the morphological description of GARDAP 1986a-b. The moving average technique was used to create effective soil depth value map. 2- The Kriging method was apply to get EC value point map of year 1986, because the EC point map were highly correlated with the soil mapping units and was spatially dependency. 3- The moving average method was used to create the bulk density value map of the layer of 0-60 cm depth.
5.7.3.1Create the Effective Soil Depth
The effective soil depth of year 1986 were described as very deep soil and the depth is more than 150 cm, therefore, effective soil depth point map of 150 cm was create. Then apply moving average method to obtain effective soil depth value map of year 1986, which is taken as reference of the depth condition to compare it with the resulted effective soil depth value map of year 2001. 150
5.7.3.2Create the EC Value of The Layer (0 - 60cm) of Year 1986
In total 617-observation points covers area of 10 villages (48,500 feddans) in year 1986 were surveyed. The weighted average EC point map of the layer (0-60cm) were calculated and it were ranged between 0.49 to 2.32 dS/m, the average was 1.913 dS/m and the stander deviation was 3.184 dS/m. Five models, Spherical, Exponential, Gaussian, Power, and Wave were tested to select the model parameters (Figure 5-21). The Goodness of fit (R2) was calculated to choose the most fitted model and use the model parameters to
Spherical Exponential Gaussian Power
Figure (5-21) The Five Models, Spherical, Exponential, Gaussian, Power, and Wave of the EC Value of The Layer 0-60 cm.
Wave
apply Kriging method. The Exponential model was the best-fitted models (R2 = 0.779), therefore, the parameters of this model used to apply Kriging technique. Finally the Kriging method is apply to calculate the EC values map and the estimation of errors. The parameters of the Exponential model were used to calculate the EC values map as the following definition: Output: Map Kriging Ordinary (ec60av, subtm7, Exponential (0.27, 0.389, 950.0), 10000, 1, 8, 14, average, 0.0, 1000). The resulted raster values map of applying Kriging is show in Figure (5-22)the result of the rater map shows that the EC value were ranged between 0.51 to 2.32 dS/m. It show that mean, median, and dominant value, were 2.22, 2.2, and 0.87 dS/m respectively.
151
Figure (5-23) shows the results of Kriging error estimation, which shows that the values of the rater error map ranged from 0.42 to 0.70 dS/m., the mean, the median, and dominant values were 0.56, 0.56 and 0.45 dS/m respectively.
152
Figure (5-22) The Value Map of Soil Salinity for Layer 0 - 60 cm of Year 1986
Figure (5-23) The Kriging Error Map of EC for Layer 0 - 60 cm of Year 1986
5.7.3.3Create the Bulk Density Value Map of The Layer (60cm) 1986
According FAO 1978 the compaction hazard was calculated for the first 60 cm of the observation point. Therefore, the weighted average bulk density 153
point map of the layer (0 - 60-cm) were calculated and it were ranged between 1.57 to 1.72 g/cm3, the average was 1.65 g/cm3 and the stander deviation was 0.045. The moving average method was used to create the value map of bulk density of layer 0-60 cm (Figure 5-24).
Figure (5-24) The Value Map of Bulk Density for Layer 0 - 60 Cm of Year 1986
The results of the raster map shows that the values ranged from 1.58 to 1.72 g/cm3. The mean, the median, and the dominant values were 1.65, 1.65, and 1.64 g/cm3 respectively. 5.7.4 Creating Effective Soil Depth, Soil Salinity and Bulk Density of Year 2001 The location maps of the observation points in the year 2001 were created and then attribute table was established using the domain of year 2001. Using the table operations, the effective soil depth, EC value and bulk density of the depth of layer 0-60 cm point maps were obtained. From the ANOVA and Geostatistical analyses, we can create soil future maps as following:
154
1- The Kriging method was apply to get the effective soil depths value map of year 2001, because the effective soil depth point map were highly correlated with the soil mapping units and was spatially dependency. 2- Also the Kriging method was apply to get EC value map of year 2001, because the EC point map were highly correlated with the soil mapping units and was spatially dependency. 3- The moving average method was used to create the bulk density value map of the layer of 0-60 cm depth.
5.7.4.1Create the Effective Soil Depth
This objective was done in paragraph 5.1.2.1 in page 72-74. 5.7.4.2Create the EC Value of the Layer (0-60cm) of Year 2001
According FAO 1978 the salinity hazard was calculated for the first 60 cm depth. Therefore, the weighted average EC values of the layer 0-60 cm were calculated and it were ranged between 0.49 to 32.20 dS/m, the average was 1.91 dS/m and the stander deviation was 3.465. The dependent output table will be defined and calculated for the EC values layer 0-60 cm. The five models, Spherical, Exponential, Gaussian, Power, and Wave were tested to select the model parameters (Figure 5-25).
Spherical Exponential Gaussian Power Wave
Figure (5-25) the Five models, Spherical, Exponential, Gaussian, Power, and Wave, the EC value of the layer 0-60 cm.
The Goodness of fit (R2) was calculated to choose the most fitted model and use the model parameters to apply Kriging method. Finally the Kriging method is apply to calculate the EC values map and the estimation of errors. The parameters of the Exponential model were used to calculate the EC values map as the following definition:
155
Map Kriging Ordinary (ec60av, subtm7, Exponential (0.25, 0.389, 950.0), 10000, 1, 8, 14, average, 0.0, 1000). The resulted value map of applying Kriging is show in Figure (5-26). The result shows that the values of the rater map ranged from 0.51 to 32.2 dS/m. The mean, the median, and the dominant were 13.78, 13.09, and 2.57 dS/m respectively.
Figure (5-26) the EC value map of the layer 0-60cm of year 2001
Figure (5-27) shows the result of Kriging error map. The result illustrated that the values of the rater error map ranged from 0.007 to 2.98 dS/m. The mean, the median, and dominate values were 2.03, 2.04 and 1.49 dS/m respectively.
156
Figure (5-27) The Kriging Error Map of EC for Layer 0 - 60 cm of Year 2001
5.7.4.3Create the Bulk Density Map of the Layer (60cm) of Year 2001
According FAO 1978 the compaction hazard was calculated for the first 60 cm of the observation point. Therefore, the weighted average bulk density point map of the layer (0 - 60-cm) were calculated and it were ranged between 1.46 to 1.75 g/cm3, the average was 1.61 g/cm3 and the stander deviation was 0.08. Figure (5-28) shows the result of applying the moving average method to create the value map of bulk density of layer 0-60 cm.
Figure (5-28) The Value Map of Bulk Density of Layer 0-60 cm
157
5.7.5 Calculate the Differences Between Year 1986 and 2001 Using the MapCalc operation, the differences of effective soil depth, soil salinity, and bulk density were calculated. Figure (5-29) shows the differences of the effective soil depth for the total period. The result shows that the values of the rater map were ranged from -0.5 to 108 cm. The mean, the median, and the dominant were 51.5, 52.0, and 0.0 cm respectively.
Figure (5-29) The Differences of the Effective Soil Depth for the Total Period.
Abdel-Samiaa (1996) reported that the graduates and the farmers start to change the modern irrigation systems to flooding irrigation system in year 1995. Therefore, the differences of each year were calculated based on the period of 6 years between 1995 and 2001. Figure (5-30) shows the differences of the effective soil depth per each year. The result shows that the values of the rater map were ranged from -0.83 to 18 cm. The mean, the median, and the dominant were 8.6, 8.67, and 0.0 cm respectively.
158
Figure (5-30) The Differences of the Effective Soil Depth per Each Year.
Figure (5-31) shows the differences of the soil salinity for total period. Also Figure (5-32) shows the differences of the soil salinity per each year. The result shows that the values of the rater map were ranged from –3.6 to 31.23 dS/m. The mean, the median, and the dominant were 11.95, 11.27, and 0.71 dS/m respectively.
Figure (5-31) The Differences of the EC Value for the Total Period.
159
Figure (5-32) The Differences of the EC Value per Each Year.
The result shows that the values of the rater map ranged from –0.6 to 5.21 dS/m. The mean, the median, and the dominant were 2.23, 2.23, and 0.08 dS/m respectively. Figure (5-33) shows the differences of the bulk density for total period. The result shows that the values of the rater map were ranged from –0.12 to 0.19. The mean, the median, and the dominant were 0.035, 0.04, and 0.02 respectively.
Figure (5-33) The Differences of the Bulk Density for Total Period. 160
Also Figure (5-34) shows the differences of the bulk density per each year. The result shows that the values of the rater map were ranged from –0.01 to 0.03. The mean, the median, and the dominant were 0.005, 0.006, and 0.01 respectively.
Figure (5-34) The Differences of the Bulk Density per Each Year.
5.7.6 Severity Classes of the Differences Using the rating classes of degradation severity according FAO 1978, the status severity maps of waterlogging, compaction, and soil salinity were created. Figures (5-35&5-36) show the change of effective soil depth due to decreasing the water-table level for total period and for each year. The result of severity status of the total period, there are 31,855 feddans (65.69% of the total area) were classified as non change areas, 980 feddans (2.02% of the total area) as slight severe areas, 1450 feddans (2.99% of the total area) as moderate severe areas, 3885 feddans (8.01% of the total area) as high severe areas, and 10,315 feddans (21.28 % of the total area) as very high severe areas. The result of severity status of each year, there are 31,855 feddans (65.69% of the total area) were classified as non change areas, 5130 feddans (10.58% of the total area) as slight severe areas, 2820 feddans (5.82 % of the total area) as moderate severe areas, 8375 feddans (17.27% of the total area) 161
as high severe areas, and 310 feddans (0.64 % of the total area) as very high severe areas.
Figure (5-35) The Severity Status of the Total Period of Effective Soil Depth
Figure (5-36) The Severity Status of One Year of Effective Soil Depth
162
Figures (5-37 & 5-38) show the change of soil salinity due to waterlogging for total period and for each year.
Figure (5-37) The Severity Status of soil salinity for the Total Period
The result of severity status of the soil salinity for the total period were classified as improved areas (345 feddans, 0.72% of the total area), nonsevere areas (635 feddans, 13.09% of the total area), slightly severe areas (31,250 feddans, 64.46% of the total area), moderate severe areas (8840 feddans, 18.23% of the total area), high severe areas (600 feddans, 1.24% of the total area), and very high severe areas (1110 feddans, 2.28 % of the total area).
Also the result of severity status of the soil salinity per one year were classified as improved areas (non), non-severe areas (7070 feddans, 14.58 % of the total area), slightly severe areas (40,420 feddans, 83.37 % of the total area), moderate severe areas (670 feddans, 1.38 % of the total area), high severe areas (325 feddans, 0.67 % of the total area), and very high severe (non).
163
Figure (5-38) The Severity Status of Soil Salinity for One Year
Figures (5-39 & 5-40) show the change of soil compaction due to waterlogging for total period and for each year. The result of severity status of the soil compaction for the total period were classified as improved areas (non), non-severe areas (1715 feddans, 3.54 % of the total area), slightly severe areas (39,510 feddans, 81.59% of the total area), moderate severe areas (7260 feddans, 14.97% of the total area), high severe areas (non), and very high severe areas (non).
Also the result of severity status of the soil compaction per one year were classified as improved areas (non), non-severe areas (5225 feddans, 11.81% of the total area), slightly severe areas (32,765 feddans, 88.19% of the total area), moderate severe areas (non), high severe areas (non), and very high severe (non).
164
Figures (5-39) The Status Classes of Soil Compaction for Total Period.
Figures (5-40) The status classes of soil compaction for each year.
165
5.7.7 Calculate the Degradation Severity Extent The crossing operation was used to create areas and its percentage of occurrence in each geomorphic mapping unit. 5.7.7.1 Extent Percent of the Water-Table Depth
The geomorphic mapping units was Crossed with the severity degradation of total period and each year to create the extent areas of waterlogging degradation. Then calculate the difference between the resulted crossing maps to obtain the percentage of occurrence in each geomorphic mapping unit. GLASOD classes were used to transfer the status and the extent occurrence to overall severity. Table (5-23) shows the result of crossing and the overall severity classes of the waterlogging (Pw). Figure (5-41) shows the result of overall degradation severity due to waterlogging, which is, decreased the water-table level.
Figure (5-41) The Overall Degradation Severity of Waterlogging
Table (5-23) The Overall Severity Classes Due To Waterlogging (Pw) Soil
Severity
Total
One year
166
Different
Extent
GLASOD
Unit
PL211
Classes non slight moderate high very high
Total
PL212
non slight moderate high very high
Total
PL213
Total PL3111 Total PL3112 Total PL3113 Total
PL3114
non slight moderate high very high non non non non slight moderate high very high
Total
PL3121
non slight moderate high very high
Total PL3122
non slight moderate high
Total PL313 Total
non
Feddan
%
Feddan
%
Feddan
%
Classes
Classes
3630 450 685 1855 1790 8410 575 90 350 1575 6975 9565 0 0 0 30 1385 1415 2305 2305 1080 1080 8165 8165 13875 425 380 355 40 15075 1000 0 5 20 125 1150 1200 15 30 50 1295 25 25
43.2 5.4 8.1 22.0 21.3 100.0 6.0 1.0 3.7 16.5 72.9 100.0 0.0 0.0 0.0 2.0 98.0 100.0 100.0 100.0 100.0 100.0 100.0 100.0 92.0 2.8 2.5 2.4 0.3 100.0 86.9 0.0 0.4 1.9 10.8 100.0 92.4 1.2 2.4 4.0 100.0 100.0 100.0
3630 2445 1190 1145 0 8410 575 1460 1460 5985 85 9565
43.2 29.1 14.1 13.6 0.0 100.0 6.0 15.3 15.3 62.6 0.9 100.0
0 -1995 -505 710 1790
non non non common frequent
non non non Pw3.2 Pw4.3
non non non non dominant
non non non non Pw4.5
15 40 1135 225 1415 2305 2305 1080 1080 8165 8165 13875 1105 90 5 0 15075 1000 20 30 100 0 1150 1200 85 10 0 1295 25 25
0.9 2.7 80.5 15.9 100.0 100.0 100.0 100.0 100.0 100.0 100.0 92.0 7.3 0.6 0.0 0.0 100.0 86.9 1.6 2.5 8.9 0.0 100.0 92.4 6.6 1.1 0.0 100.0 100.0 100.0
0.0 -23.7 -6.0 8.4 21.3 0.0 0.0 -14.3 -11.6 -46.1 72.0 0.0 0.0 -1.1 -2.8 -78.1 82.0 0.0 0.0 0.0 0.0 0.0 0.0 0.0 0.0 -4.5 1.9 2.3 0.3 0.0 0.0 -1.7 -2.2 -7.0 10.9 0.0 0.0 -5.4 1.5 3.9 0.0 0.0 0.0
non non non non dominant
non non non non Pw4.5
non
non
non
non
non
non
non non infrequent infrequent infrequent
non non Pw2.1 Pw3.1 Pw4.1
non non non non common
non non non non Pw4.2
non non infrequent infrequent
non non Pw2.1 Pw3.1
non
non
0 -1370 -1110 -4410 6890 0 -15 -40 -1105 1160 0 0 0 0 -680 290 350 40 0 -20 -25 -80 125 0 -70 20 50 0
The effects of management on the water-table depth show that: The nonsevere areas were 35,495 feddans (73.21% of the total area), The slight severe areas (Pw2.1) were 415 feddans (0.85 %of the total area), The medium severe areas (Pw3.1 & Pw4.1) were 445 feddans (0.88 %), The high severe areas
167
(Pw3.2 & Pw4.2) were 1980 feddans (4.08 %), and The very high severe areas were 10,150 feddans (20.93%). 5.7.7.2 Extent Percent of the Salinization
The geomorphic mapping units was Crossed with the severity degradation of total period and each year to create the extent areas of salinization degradation. Then calculate the difference between the resulted crossing maps to obtain the percentage of occurrence in each geomorphic mapping unit. GLASOD classes were used to transfer the status and the extent occurrence to overall severity. Table (5-24) shows the result of crossing and the overall severity classes of the salinization (Cs). Figure (5-42) shows the result of overall degradation severity due to salinization.
Figure (5-41) The Overall Degradation Severity of Salinization
Table (5-24) The Overall Severity Classes Due To Salinization (Cs) Soil Unit
Severity Classes
Total feddan %
Year feddan %
168
Different feddan %
Extent classes
GLASOD classes
PL211
non slight moderate high very high
Total
PL212
non slight moderate high very high
Total
PL213
non slight moderate high very high
Total PL3111 non Total PL3112 non Total non PL3113 slight moderate Total non slight moderate PL3114 high very high Total non slight PL3121 moderate high very high Total non slight PL3122 moderate high Total PL313 non Total
1500 5505 1065 130 210 8410 615 3205 4835 405 505 9565 0 105 850 70 390 1415 2305 2305 1080 1080 225 7515 420 8160 2915 10580 1580 0 0 15075 930 195 25 0 0 1150 505 750 40 0 1295 25 25
17.8 65.5 12.7 1.5 2.5 100.0 6.5 33.5 50.5 4.2 5.3 100.0 0.0 7.2 60.3 4.9 27.7 100.0 100.0 100.0 100.0 100.0 2.8 92.1 5.2 100.0 19.3 70.2 10.5 0.0 0.0 100.0 80.8 17.0 2.1 0.0 0.0 100.0 38.9 58.0 3.1 0.0 100.0 100.0 100.0
1600 6650 160 0 0 8410 650 8460 365 90 0 9565 0 1035 140 240 0 1415 2305 2305 1080 1080 260 7900 0 8160 3055 12020 0 0 0 15075 1000 20 30 100 0 1150 560 735 0 0 1295 25 25
19.0 -100 79.1 -1145 2.0 905 0.0 130 0.0 210 100.0 6.8 -35 88.4 -5255 3.8 4470 0.9 315 0.0 505 100.0 0.0 0 73.3 -930 9.7 710 17.0 -170 0.0 390 100.0 100.0 0 100.0 100.0 0 100.0 3.2 -35 96.8 -385 0.0 420 100.0 20.7 -140 79.7 -1440 0.0 1580 0.0 0 0.0 0 100.5 0 945.0 -70 205.0 175 0.0 -5 0.0 -100 0.0 0 1150.0 0 43.1 -55 56.9 15 0.0 40 0.0 0 100.0 100.0 0 100.0
-1.2 -13.6 10.8 1.5 2.5 0.0 -0.4 -54.9 46.7 3.3 5.3 0.0 0.0 -65.7 50.2 -12.0 27.6 0.0 0.0 0.0 0.0 0.0 -0.4 -4.6 5.0 0.0 -0.9 -9.6 10.5 0.0 0.0 0.0 -6.1 15.2 -0.4 -8.7 0.0 -4.2 1.2 3.1 0.0 0.0 0.0 0.0
non non frequent infrequent infrequent
non non Cs2.3 Cs3.1 Cs4.1
non non very frequent infrequent infrequent
non non Cs2.4 Cs3.1 Cs4.1
non non dominant non very frequent
non non non non Cs4.5
non
non
non
non
non non infrequent
non non Cs2.1
non non common non non
non non Cs2.2 non non
non frequent non non non
non Cs1.3 non non non
non infrequent infrequent non
non Cs1.1 Cs2.1 non
non
non
The effects of management on the salinization show that: The non-severe areas were 37,200 feddans (76.72 % of the total area), The slight severe areas (Cs1.1&Cs2.1) were 1150 feddans (2.38 %of the total area), The medium 169
severe areas (Cs2.2, Cs3.1 & Cs4.1) were 2515 feddans (5.17 % of the total area), The high severe areas (Cs2.3, Cs2.4 & Cs4.2) were 6780 feddans (12.8 % of the total area), and The very high severe areas were 895 feddans (1.85% of the total area). 5.7.7.3 Extent Percent of Soil Compaction
The geomorphic mapping units was Crossed with the severity degradation of total period and each year to create the extent areas of compaction degradation. Then calculate the difference between the resulted crossing maps to obtain the percentage of occurrence in each geomorphic mapping unit. GLASOD classes were used to transfer the status and the extent occurrence to overall severity. Table (5-25) shows the result of crossing and the overall severity classes of the soil compaction (Pc). Figure (5-43) shows the result of overall degradation severity due to compaction.
Figure (5-43) The Overall Degradation Severity of Compaction
The effects of management on soil compaction show that: The non-severe areas were 25,610 feddans (52.81 % of the total area); The slight severe areas Pc1.2&Pc2.1 were 16435 feddans (33.90 %of the total area); The medium
170
severe areas Pc1.3 were 2895 feddans (5.97 % of the total area); and The high severe areas Pc2.3& Pc2.4 were 3545 feddans (7.32% of the total area). Table (5-25) The Overall Severity Classes Due To Compaction (Pc) Soil Unit
Severity classes
PL211
non slight moderate
Total PL212
non slight moderate
Total PL213
non slight
Total PL3111
non slight
Total PL3112
non slight
Total PL3113
non slight moderate
Total PL3114
non slight moderate
total PL3121
non slight moderate
Total PL3122
non slight moderate
Total PL313 Total
non
Total Year feddan % feddan % 5 0.1 205 2.4 7210 85.7 8205 97.6 1195 14.2 0 0.0 8410 100.0 8410 100.0 35 0.4 215 2.2 9095 95.1 9350 97.8 435 4.5 0 0.0 9565 100.0 9565 100.0 255 17.9 450 31.8 1160 82.1 965 68.2 1415 100.0 1415 100.0 570 24.7 2305 100.0 1735 75.3 0 0.0 2305 100.0 2305 100.0 345 32.0 1080 100.0 735 68.0 0 0.0 1080 100.0 1080 100.0 15 0.2 1520 18.6 6365 78.0 6640 81.4 1780 21.8 0 0.0 8160 100.0 8160 100.0 1055 7.0 2585 17.1 13210 87.6 12490 82.9 810 5.4 0 0.0 15075 100.0 15075 100.0 215 18.5 265 23.0 630 54.7 885 77.0 305 26.8 0 0.0 1150 100.0 1150 100.0 135 10.5 490 37.7 900 69.5 805 62.3 260 20.0 0 0.0 1295 100.0 1295 100.0 25 100.0 25 100.0 25 100.0 25 100.0
Different feddan % -200 -2.4 -995 -11.8 1195 14.2 0.0 -180 -1.9 -255 -2.7 435 4.5 0.0 -195 -13.8 195 13.8 0.0 -1735 -20.6 1735 20.6 0.0 -735 -8.7 735 8.7 0.0 -1505 -17.9 -275 -3.3 1780 21.2 0.0 -1530 -10.1 720 4.8 810 5.4 0.0 -50 -4.3 -255 -22.2 305 26.5 0.0 -355 -27.4 95 7.3 260 20.1 0.0 0 0.0 0.0
Extent classes
GLASOD classes
non non frequent
non non Pc2.3
non non infrequent
non non Pc2.1
non frequent
non Pc1.3
non frequent
non Pc1.3
non common
non Pc1.2
non non frequent
non non Pc2.3
non infrequent infrequent
non Pc1.2 Pc2.1
non non very frequent
non non Pc2.4
non common frequent
non Pc1.2 Pc2.3
non
non
5.8 Drainage Efficiency The drainage system map of El Bustan I&II, which was done by the General Department of Drain Projects in Damanhour city (Abdel Sammiaa,
171
1996) were used to calculate the drainage efficiency of the study area. The drain spaces were calculated using Hooghoudt equation (Ritzema, 1994). The Hooghoudt equation needs five parameters: Q (m2/day) unit flow rate in Xdirection, K (m/day) hydraulic conductivity of the soil, D (m) elevation of the water level in the drain canals, L (m) drain spacing, and H (m) elevation of water-table midway between the drains. Abdel Sammiaa, 1996 reported that, according to the information of the General Department of Drain Projects in Damanhour City, the design of the flow rate (Q) of the main drain canals in the studied area was ranged between 8 and 12 m2/day with an average of 10 m2/day. The main type of agriculture in the area were fruit trees, therefore the depth of the water-table should not less than 1.20 m in the midway between the drains (H). During the fieldwork 2001, the elevations of the water (D) in the drains were ranged between 0.35 and 0.65 m with an average of 0.55 m. The hydraulic conductivity (K) values in the area were ranged between 1.52*10-3 and 8.47*10-3 cm/sec. The average value of the hydraulic conductivity (K) in the flat areas was 24052.43 m/day and it was 38294.4 m/day in the sand dune areas. The average value of the hydraulic conductivity (K) in the total area was 32321.96 m/day. Finally, from Hooghoudt equation the drain spacing was calculated for the total area, the flat areas, and the sand dune areas. Table (5-26) shows the all parameters of Hooghoudt equation and the drain spacing (L). The results show that the drain spacing of the whole area, the flat areas, and sand dune areas should not less than 317, 273, and 345 m respectively. Also the average drain spacing of each geomorphic mapping units (PL211, PL212, PL213, PL3111, PL3112, PL3113, PL3114, PL3121, PL3122) were 295, 252, 252, 343, 347, 319, 319, 319, 354, and 365 m respectively. The output of distance operation is called a distance map. All pixels with a class name, ID, or value are regarded as source pixels, and distance values will be calculated for all pixels that are undefined (ILWIS 3.11, 2001). Using the distance operation for the current drains system, the current drainage efficiency was created. Figure (5-44) shows the result of the drainage efficiency.
172
The result show that the efficiency of the drain system was covered 14,805 feddans (30.53% of the total area) only and about 33,685 feddans (69.47% of the total area) facing the risk of decreasing the water-table level. This resulted from some young graduates and small farmers whose used the surface flood irrigation systems to irrigate their fields. The result of crossing the water logging areas with the existed map show that 505 feddans (83.84%) of the waterlogging areas were found were found in the areas, which suffer from degreasing water-table level, and 95 feddans (16.16%) of the waterlogging areas found in the drain efficient areas. Therefore, the study area needed as soon as possible a new drainage system especial in the flat areas using the field drain canals.
Figure (5-44) shows the result of the drainage efficiency
Table (5-26) Hydraulic Conductivity Values and Drain Spacing of the Studied Area
173
Mapping Profile Units
No.
PL211
p2
PL212
p4
PL213
p6
PL213
p10
PL213
p3
PL3111
PL3112
PL3113
PL3114
PL3121
PL3122
p11
p12
p7
p8
p9
p1
Hydraulic
Hydraulic
Water hieght
Watertable
Flow rate
Depth
conductivity
conductivity
in Drian
Depth
cm
K (cm/sec)
K (m/day)
D (m)
H (m)
Q 2 m /day
0-25
0.00379
32745.60
0.55
1.2
3.56
101548
319
25-60
0.00347
29980.80
0.55
1.2
3.56
92974
305
60-150
0.00257
22204.80
0.55
1.2
3.56
68860
262
0-25
0.00205
17712.00
0.55
1.2
3.56
54927
234
25-60
0.00275
23760.00
0.55
1.2
3.56
73683
271
60-100
0.00237
20476.80
0.55
1.2
3.56
63501
252
0-20
0.00316
27302.40
0.55
1.2
3.56
84668
291
20-60
0.00253
21859.20
0.55
1.2
3.56
67788
260
60-150
0.00189
16329.60
0.55
1.2
3.56
50640
225
0-15
0.00284
32745.60
0.55
1.2
3.56
101548
319
15-45
0.00189
16329.60
0.55
1.2
3.56
50640
225
0-25
0.00253
21859.20
0.55
1.2
3.56
67788
260
25-60
0.00188
16243.20
0.55
1.2
3.56
50372
224
60-85
0.00152
13132.80
0.55
1.2
3.56
40726
202
0-25
0.00847
73180.80
0.55
1.2
3.56
226943
476
25-60
0.00315
27216.00
0.55
1.2
3.56
84400
291
60-150
0.00257
22204.80
0.55
1.2
3.56
68860
262
0-20
0.00505
43632.00
0.55
1.2
3.56
135308
368
20-60
0.00474
40953.60
0.55
1.2
3.56
127002
356
60-150
0.00379
32745.60
0.55
1.2
3.56
101548
319
0-25
0.00478
32745.60
0.55
1.2
3.56
101548
319
25-60
0.00316
32745.60
0.55
1.2
3.56
101548
319
60-150
0.00284
32745.60
0.55
1.2
3.56
101548
319
0-25
0.00399
34473.60
0.55
1.2
3.56
106907
327
25-60
0.00387
33436.80
0.55
1.2
3.56
103692
322
60-150
0.00357
30844.80
0.55
1.2
3.56
95654
309
0-25
0.00647
55900.80
0.55
1.2
3.56
173355
416
25-60
0.00415
35856.00
0.55
1.2
3.56
111194
333
60-150
0.00367
31708.80
0.55
1.2
3.56
98333
314
0-25
0.00535
46224.00
0.55
1.2
3.56
143346
379
25-60
0.00498
43027.20
0.55
1.2
3.56
133433
365
60-150
0.00459
39657.60
0.55
1.2
3.56
122983
351
100234.40
317
Total Flow Rate (k)
1001980.80
Mean of Flow Rate
32321.96
Total Dune Area
689299.20
Mean Dune Area
38294.40
Total Flat Area
312681.60
Mean flat Area
24052.43
174
Drain Spacing L2 L 2 m m
118755.67
345
74589.56
273
The design of the drainage system should use the drain spacing in the flat areas different than the sand dune areas. From the result of applying Hooghoudt equation, the drain spacing of the flat areas should not less than 273 m, and in the sand dune areas should not less than 345 m. The overlay operation was used to overlay the distance map, current drainage system, and geomorphic mapping units (boundary only) maps over the DTM value map to proposed the suitable drainage system for the flat areas. Figure (5-45) shows the location of the proposed main, lateral, and field drainage system.
Figure (5-45) The Location of the Proposed Collector, Lateral, and Field Drainage System.
There are many reasons, which lead to land degradation in the study area. This area was planning to use modern irrigation systems and it is not needed for building drainage systems for the area. Change from modern irrigation system by the holders to flooding surface irrigation system. The holders skill different from ordinary farmers, young graduate, company’s workers and investors. They planting Banana in the area, which has high amount of water requirement. There is lack of crop rotations in the study area. There is lack of crop water requirement for the holders there are lack of pedological studies for determined the hard pan layer. Therefore, the area needs as soon as possible drainage systems especial in the flat areas with a lateral drain canal separate between the flat areas and the sand dune areas. 175
6
SUMMARY AND CONCLUSION The study area is located in the northwestern part of the Nile delta in
Nubariya District in Egypt. It is bounded to the west by the Alexandria-Cairo desert road between 75 and 85 km from Alexandria city, to the east by El Nubariya canal, El Nasr canal from the northern part, and Gabel Naaum from southern part. The area is divided into two settlement stages; each stage is sub-divided into groups of 5 villages. The area is located approximately between latitudes 30 11' 36" N and 30 43' 12" N, and longitudes between 30 23' 19" E and 30 40' 23" E. Land elevation of the studied area ranged between 5 meters above sea level (asl) in the east and 35 meters (asl) in the west, with an average east-west slope of 0.17%. The northwestern and the central parts are almost flat since the slope does not exceed than 0.05%. The studied area is mainly irrigated by El_Bustan El_Geddidah Canal. The studied area is served by General drain number 3, which is pass through between the Bustan 1 and Bustan 2. Most of the studied area are Fruit crops including apple, pears, data palm. The field crops are wheat, Egyptian clover and scattered area cultivated with Barley in winter and in summer it is mostly cultivated with maize and scattered area cultivated with Sorghum. Sweet melon is cultivated in summer at a very large scale. Tomato and other house use vegetables are cultivated at any time of the year but at a small scale. 6.1 Soil Characteristics Most of the area is The soil moisture regime in study area is Torric or Aridic and the soil temperature regime in study area is Hyperthermic. El-Bustan 1&2 areas could be classified into two main topographic features the Flat areas and the sand dunes area. The flat areas drive from undifferentiated Quaternary deposits. The sand dunes area drives from Quaternary sand blow. The flat areas could be divided into three geomorphologic Units: flat cover with thick sand sheet (PL211, 8410 feddans = 17.35% of the total area), flat cover by thin sand sheet (PL212, 9595 feddans = 19.72 of the total area), and depression (PL213, 1415 feddans =
176
2.91 % of the total area). The sand dunes subdivided into three main units. Longitudinal sand dunes (PL3111, PL3112, PL3113, and PL3114, 2305, 1080, 8160, and 15,080 feddans = 4.75%, 2.23%, 16.83%, and 31.10% of the total area respectively). Pyramids sand dunes (PL3121, and PL3122, 1150, and 1295 feddans = 2.37 % and 2.67% of the total area respectively). Depression (PL313) covers 25 feddans = 0.05% of the total area. The ordinary Kriging was applied to delineate the most accurate boundaries for the different soil qualities (Soil salinity, and Effective soil depth) and moving average for bulk density. The result shows that 42,235 feddans (87.10% of the total area) were classified as very deep soil (d1), 5295 feddans (10.92% of the total area) as deep soil (d2), 775 feddans (1.60% of the total area) as moderate deep soil (d3), and 185 feddans (0.32% of the total area) as shallow soil (d4). The result shows that 48,270 feddans (99.50% of the total area) were classified as Non-Salic Horizon, and 220 feddans (0.50% of the total area) were Salic Horizon. According to the Soil Taxonomy (1999), these soils were classified as Entisols and Aridisols orders and Typic Torripsamments, Aquic Torripsamments, Typic Aquisalids, and Typic Haplosalids as sub great groups. 6.2 Spectral Analysis The result of applying the Maximum Likelihood classification to the map list of the TM bands 2, 4, and 7 of August 1990 shows that there is no areas were classified as Waterlogging areas in El-Bustan 1&2 during this year, which is the started time to cultivate the studied area. The result of applying the Maximum Likelihood classification to the map list of the TM bands 1, 2, 3, 4, 5, and 7 of August 1997 shows that about 600 feddans were classified as Waterlogging areas cover 1.35% of the total area of El-Bustan 1&2. The result of applying the Maximum Likelihood classification to the map list of the TM bands 1, 2, 3, 4, 5, and 7 of December 1999 shows that about 615 feddans were classified as Waterlogging areas cover 1.37% of the total area of El-Bustan 1&2. The result shows that 410 feddans (61.52% of the 177
Waterlogging areas) were find in the both two years and only 255 feddans (38.48%) were occurred in different areas each year. The results of crossing operation show that, the flat areas (PL212 and PL213) were effected by water logging in both years, but there is slightly decreased in mapping unit PL211. The sand dune areas were not effected, and only small area in mapping unit PL3114 was effected by water logging and it increased from 0.77 % in year 1997 to 1.13% in year 1999. This result is logic due to the deep seepage from higher areas (sand dune areas), seepage from irrigation canals which is high than the cultivated areas, and changing the modern irrigation systems to flooding irrigation system. 6.3 Physical Analyses The results of calculated pore size distribution shows that the slow drainage pores (30-9 Micron) were the predominant size in both flat and sand dunes areas, but the mapping unit PL213 (depression). The pores size distribution of quick and slow drainage pores in the sand dunes areas were ranged between 70% to 80%, therefore, the water movement downward was easy. Also the pores size distribution of quick and slow drainage pores in the mapping units PL211 and PL212 (flat area) were ranged between 60% to 70%, therefore, the water movement downward was easy. The mapping units PL213 show less in the quick and slow drainage pores and increases in the Water holding and Non-Useful pores. The pores size distributions of quick and slow drainage pores in this mapping unit were ranged between 25% to 60%, and the Water holding and Non-Useful pores were ranged between 40% to 75%. For that the problem of Waterlogging areas occurred in the mapping units PL213 much more than the other mapping units. 6.4 Degradation assessment The data of the fieldwork 2001 shows that there are differences between the data of this year and year 1986 in the effective soil depth, EC values, total calcium carbonate, and the bulk density. Three degradation types were recognized in the studied area, physical deterioration (water logging Pw and
178
compaction Pc), and chemical deterioration (salinization Cs). Therefore the indicators of effective soil depth, EC values, and bulk density were used to assess land degradation for Waterlogging, salinization, and compaction respectively. According FAO 1978 the salinity and bulk density hazard were calculated for the layer 0-60 cm. Therefore, the weighted average EC and bulk density values of the layer 0-60-cm were calculated and analyze using ANOVA and Geostatistical analyses. The location maps of the observation points in the year 1986 were created and then attribute table was established using the domain of year 1986. Using the table operations, the effective soil depth, EC value and bulk density of the depth of 0-60 cm point maps were obtained. From the reports of GARDAP, 1986a-b, ANOVA and Geostatistical analyses, we can create soil future maps as following: 1- The effective soil depths were very deep in all observation points according the morphological description of GARDAP 1986a-b. The moving average technique was used to create effective soil depth value map. 2- The Kriging method was apply to get EC value point map of year 1986, because the EC point map were highly correlated with the soil mapping units and was spatially dependency. 3- The moving average method was used to create the bulk density value map of the layer of 0-60 cm depth.
The location maps of the observation points in the year 2001 were created and then attribute table was established using the domain of year 2001. Using the table operations, the effective soil depth, EC value and bulk density of the depth of layer 0-60 cm point maps were obtained. From the ANOVA and Geostatistical analyses, we can create soil future maps as following: The Kriging method was apply to get the effective soil depths value map of year 2001, because the effective soil depth point map were highly correlated with the soil mapping units and was spatially dependency. Also the Kriging method was apply to get EC value map of year 2001, because the EC point map were highly correlated with the soil mapping units and was spatially dependency. The moving average method was used to create the bulk density value map of the layer of 0-60 cm depth.
179
Abdel-Sammiaa (1996) reported that the graduates and the farmers start to change the modern irrigation systems to flooding irrigation system in year 1995. Therefore, the differences of each year were calculated based on the period of 6 years between 1995 and 2001. Using the rating classes of degradation severity according FAO 1978, the status severity maps of waterlogging, compaction, and soil salinity were created. Using the rating classes of degradation severity according FAO 1978, the status severity maps of waterlogging, compaction, and salinization were created. The result of waterlogging severity status of the total period, there are 31,855 feddans (65.69% of the total area) were classified as non change areas, 980 feddans (2.02% of the total area) as slight severe areas, 1450 feddans (2.99% of the total area) as moderate severe areas, 3885 feddans (8.01% of the total area) as high severe areas, and 10,315 feddans (21.28 % of the total area) as very high severe areas. The result of severity status of each year, there are 31,855 feddans (65.69% of the total area) were classified as non change areas, 5130 feddans (10.58% of the total area) as slight severe areas, 2820 feddans (5.82 % of the total area) as moderate severe areas, 8375 feddans (17.27% of the total area) as high severe areas, and 310 feddans (0.64 % of the total area) as very high severe areas. The result of severity status of the soil salinity for the total period were classified as improved areas (345 feddans, 0.72% of the total area), nonsevere areas (635 feddans, 13.09% of the total area), slightly severe areas (31,250 feddans, 64.46% of the total area), moderate severe areas (8840 feddans, 18.23% of the total area), high severe areas (600 feddans, 1.24% of the total area), and very high severe areas (1110 feddans, 2.28 % of the total area). Also the result of severity status of the soil salinity per one year were classified as improved areas (non), non-severe areas (7070 feddans, 14.58 % of the total area), slightly severe areas (40,420 feddans, 83.37 % of the total area), moderate severe areas (670 feddans, 1.38 % of the total area), high
180
severe areas (325 feddans, 0.67 % of the total area), and very high severe (non). The result of severity status of the soil compaction for the total period were classified as improved areas (non), non-severe areas (1715 feddans, 3.54 % of the total area), slightly severe areas (39,510 feddans, 81.59% of the total area), moderate severe areas (7260 feddans, 14.97% of the total area), high severe areas (non), and very high severe areas (non). Also the result of severity status of the soil compaction per one year were classified as improved areas (non), non-severe areas (5225 feddans, 11.81% of the total area), slightly severe areas (32,765 feddans, 88.19% of the total area), moderate severe areas (non), high severe areas (non), and very high severe (non). The effects of management on the water-table depth show that: The nonsevere areas were 35,495 feddans (73.21% of the total area), The slight severe areas (Pw2.1) were 415 feddans (0.85 %of the total area), The medium severe areas (Pw3.1 & Pw4.1) were 445 feddans (0.88 %), The high severe areas (Pw3.2 & Pw4.2) were 1980 feddans (4.08 %), and The very high severe areas were 10,150 feddans (20.93%).
The effects of management on the salinization show that: The non-severe areas were 37,200 feddans (76.72 % of the total area), The slight severe areas (Cs1.1&Cs2.1) were 1150 feddans (2.38 %of the total area), The medium severe areas (Cs2.2, Cs3.1 & Cs4.1) were 2515 feddans (5.17 % of the total area), The high severe areas (Cs2.3, Cs2.4 & Cs4.2) were 6780 feddans (12.8 % of the total area), and The very high severe areas were 895 feddans (1.85% of the total area). The effects of management on soil compaction show that: The non-severe areas were 25,610 feddans (52.81 % of the total area); The slight severe areas Pc1.2&Pc2.1 were 16435 feddans (33.90 %of the total area); The medium
181
severe areas Pc1.3 were 2895 feddans (5.97 % of the total area); and The high severe areas Pc2.3& Pc2.4 were 3545 feddans (7.32% of the total area). There are many reasons, which lead to land degradation in the study area. This area was planning to use modern irrigation systems and it is not needed for building drainage systems for the area. Change from modern irrigation system by the holders to flooding surface irrigation system. The holders skill different from ordinary farmers, young graduate, company’s workers and investors. They planting Banana in the area, which has high amount of water requirement. There is lack of crop rotations in the study area. There is lack of crop water requirement for the holders there are lack of pedological studies for determined the hard pan layer. Therefore, the area needs as soon as possible drainage systems especial in the flat areas with a lateral drain canal separate between the flat areas and the sand dune areas.
7
REFERENCES
Abdel-Hady A. M. and Abdel-Kader F. H., (1999), “Remotely Sensed Mapping of waterlogged soils at west nubariya and bustan: problems and solutions”, international conference on Environmental management, health and sustainable development, 22 –25 March, 1999, Palstine hotel, Alexandria, Egypt. Abdel-Kader F. H., et al., (1998), “Risk assessment of waterlogging problem at bustan 1 and 2 areas, Egypt”, The primary study of waterlogged areas at bustan 1 and 2 and west nubariya, east desert road, funded by the bustan agricultural development project (BADP).
182
Abdel-Samiaa, H. A. M., (1996), “Problems of Irrigation and Drainage in the newly reclaimed areas, west Nubariya canal”, Ms. C. theses, faculty of engineering, Alexandria university, Alexandria, Egypt. Abu El-Izz, M. 1971, “Landforms of Egypt”, American University press, Cairo, Egypt. Afifi M. Y, M. Talha and A. M. Talaat (2000). “Spatial Variability of Sorptivity and Infiltration Rate in Some Calcareous Soils of Egypt”. Egyptian soil Science Society (ESSS), Golden Jubilee Congress, on “Soil and Sustainable Agriculture in the New Century”, October 23-25, 2000, Cairo. Agbamu J. U. 1995, “Analysis of Farmer’s Characteristics in relation to adoption of soil management practices in the Ikorodu area of Nigeria”, Japanese journal of tropical agriculture 39 (4), 213. Aronoff, S. 1993, “Geo Graphic Information Systems: A management perspective”, WDL publications, Ottawa, Canda. Atef M. et al. 1998a,”the report on the justification of the observation wells monitoring system”, especial report, El Bustan Agricultural Development Project (BADP). Atef M. et al. 1998b,”The primary study of the waterlogged areas at Bustan (1and 2) and west Nubariya east desert road”, especial report, El Bustan Agricultural Development Project (BADP). [BADP], 1997,”the preliminary groundwater investigation mission in the Bustan area”, Bustan agricultural development project, final report, project SEM/02/220/039SEM/02/220/042, funded by European commission, SOFECO, france and COBA, Portugal. [BADP], 2003,”Information on Beneficiaries Different Categories Within the Project Area”, Bustan agricultural development project, report about the numbers and the areas of the young graduates and small farmers, fax from Bustan TD, phone No. 045633269, May 12 2003, by personal contact. Balba, A. M. 1995, “Management of Problem Soils in Arid Ecosystems”, Textbook, Lewis publishers is an imprint of CRC press, New York. Ball, J. 1939, “Contribution to the geology of Egypt”, Textbook, Lewis publishers is an imprint of CRC Survey department, Government press, Cairo, Egypt. Beaumont, P. (1989), “Environmental Mangement and Development in Dry Lands”, Textbook, Routledge, London. Beltagy A. S., Shata, A. A., and Jones, R. A., 1991, “Sand dune agromanagement systems: Strategies to sustain productivity in Saline environments”, Proc. Of international cong. On desert development, 95, 102, Mexico city, Mexico.
183
Bergsma, E. (1982), “Aerial photo-interpretation for soil erosion and conservation surveys”, part II: Erosion factors, ITC, lecture notes 9/71, Enschede, the Netherlands. Beshay N. F. and Sallam A. Sh., 2001 “Effect of Land management practices on soil characteristics and sustainable productivity (East the Nile)”, Egypt J. Soil Sci., 41, No. 3, pp: 353 – 378. Bourgaul T. G., Journel A. G., Lesch S. M., Rhoades J. D., and Corwin D. L. 1999, “Geostatistical analysis of a soil salnity data set”, approved date: 1996 – 02 – 12, TRKTRAN, United States Department of Agriculture, Agricultural Research Service, USA, E-mail:
[email protected] Electronic version: http://www.nal.usda.gov/ttic/tektran/data/0000101/26/00001044/htm1 Bourrfa and Zimmer, 1994, “A GIS to investigate waterlogging and salinity hazards in the Mediterranean region”, International conference on Land and Water Resources management in the Mediterranean region, Instituto Agronomico Mediterranean, Valenzano, Bari, Italy, 4-8 Sept., 1994. Cavelaars, J.C., W. F. Vlotman, and G. Spoor (1994). Subsurface Drainage System. Drainage Principles and Applications, ILRI Puplication 16, Chapter 21,pp. 827927. CNE, 1990 “Climatological Normals for Egypt”, the normals for Egypt up to 1990, Ministry of Civil Aviation-Meteorological Authority, Cairo, Egypt. David S. and D. Thopson, 1996 “GIS as Social Practice: Considerations for a Developing Country”, paper presented in Symposium in GIS / LIS 1996 by GIS and International Development, USA, Electronic Web: http:\\www.GISdev.GIS%20/making.htm. David T. and Nicholas M., 1996, “Desertification: Exploding the myth. Textbook, copyright © 1994, published and reprinted 1996, by John Wiley &Sons LTD, London, England. Davis J. C. 1998. “Introduction to the practice of statistics”, First printing, pp. 213-258, John Wiley and Sons, New York. Davis J. C. 1986. “Statistics and data analysis in geology”, Second edition. pp. 405-425, John Wiley and Sons, New York. Dregne H. and Tucker C. J., 1988, “Desert encroachment”, Desertification Control Bulletin, 16: 16 – 19. Duggin, M. and Robinove, C. J. 1990, “Assumptions implicit in remote sensing data acquisition and analysis” Int. J. of Remote Sensing, 11(10): 1669-1684. Edwards, J. H., Wood, C. W., Thurolow, D. L., and Ruf, M. E., 1992 “Tillage and crop rotation effects on fertility status of a hapludult soil”, Soil Science of American Journal (USA), 56(5), 1577.
184
EGPC, 1988, “Egyptian General Petroleum Corporation: Geological Map of Egypt”, Sheet NH36-NW, “Cairo”, Conoco Coral, printed in Germany by institute fur Angewandte Geodasie, Berlin, © Technische Fachhochschule Berlin, 1988, Scale 1:500,000. EGSA, 1996, “Egyptian General Survey Authority: Topographic Maps”, Sheets NH36-I4a “An-Nubariyyah”, NH36-I4b “Jabal Na’um”, NH36-I4c “Abu al-Matamir”, and NH36-I4d “Hawsh Isa”, Scale 1:50,000. El Ahram-Economics, (1990), “Land Reclamation Index-Maps, Locations and Needed Documents.”, No. 34, December 1990, El Ahram organization, Cairo, Egypt. El-Shinnawy, A. A., El-Hassanin, A. S., and El-Sayed, E. I., 1986, “Water conservation through selecting an appropriate irrigation method in relation to soil crop management in some desert areas in Egypt”, Egypt J. Soil Sci., 36(2), 367. Erian, W.F. 1990. “The use of Digital Image Processing in combination with a Geographic Information System for Monitoring the Development of Recently Reclaimed Calcareous Soils in Egypt” M. Sc. The International Institute for Aerospace Survey and Earth Sciences, Enschede, The Netherlands. Erian, W. F., Nasr Y.A.A and F. A.Gomaa, 1999. “The Use of GIS and Remote Sensing Techniques for studying the Potential Land Suitability Classification for the Most Recommended Land Utilization Types for the Soils of Branch No. (20)”.Bulletin Faculty of Agriculture - Cairo University, Special Edition, volume IV – Proceedings of the 1St Congress” Recent Technology in Agriculture”, 27–29 November Organized by Faculty of Agriculture - Cairo University. Erian W.F. and Yacoub R, K., 1999. “The Use of GIS to Combine Analytical and Synthetic Approaches for Obtaining Efficient and Effective Soil Survey Interpretation”. The Sixth International Conference on the Development of Dry lands, 22-27 August, organized by the International Desert Development Commission, in cooperation with ICARDA, Cairo, Egypt. Erian, W.F. 2000 “The Use of GIS and Geo-Statistical Analysis in Measuring the Sustainability in El Hamam Area, Egypt”. Bulletin Faculty of Agriculture Alexandria University –Volume III, August - Egypt. Erian W. F., Ismail S. A., Gomaa F. A., and Shendi M. M., 2000, “The Study of the Potential Land Suitability Classification for the Forage Crops in Sugar Beet Zone and El-Hammam Area, Nubariya, Egypt.”, The second international conference on “Earth Observation and Environment Information, 11 – 14 November, Organized by The National Authority for Remote Sensing and Space Sciences (NARSS), Cairo – Egypt.
185
Erian. W. F., Nasr Y.A. A and Ismail S.A.A, 2000. “The Application of Geo-Statistical analysis in the Assessment of the Diagnostic Horizons in Sugar Beet Zone and El Hammam Areas, Nubariya, Egypt.” Second International conference on “Earth Observation And Environment Information, 11-14 November, Organized by The National Authority for remote Sensing and Space Sciences (NARSS), Cairo Egypt. Erian, W.F and R, K. Yacoub, 2000 “The Use of the Ordinary Kriging Techniques in measuring the sustainability in Sugar Beet Area, Nubariya, Egypt.” Second International conference on “Earth Observation And Environment Information, 11-14 November, Organized by The National Authority for remote Sensing and Space Sciences (NARSS), Cairo - Egypt. Ernst, L.F. (1956). Calculation of the steady flow of groundwater in vertical cross-sections. Netherlands Journal of Agriculture Science 4, pp. 126-131. Ernst, L.F. (1962). Grondwaterstromingen in de verzadigde zone en hun berekening bij aanwezigheid van horizontale evenwijdige open leidingen. Versl. Landbouwk. Onderz. 67-15. Pudoc, Wageningen. 189 p. [Euroconsult], 1992, “el bustan canal lining”, mission report, euroconsult, Arnhem, the Netherlands. [EX3305], 1995, “sustainable improvements to agriculture and water use in new land”, report proposal by the ministry of agriculture and land reclamation, Egypt, to the European commission for funding, HR wallingford, November 1995. Ezzat, M.A. (1978). “Groundwater Study Project West Delta Area- Part 2”. Ministry of irrigation and land reclamation , Desert irrigation department. FAO group 1964, “High dam soil survey: the reconnaissance soil survey”, Food and Agriculture Organization of the United Nation, Vol. 2, Cairo, Egypt. FAO group 1964, “High dam soil survey: the semi-detaled soil survey”, Food and Agriculture Organization of the United Nation, Vol. 3, Cairo, Egypt. FAO group 1978, “world Assessment of Soil Degradation”, Food and Agriculture Organization of the United Nation, project No. 1106-75-05, Rome. FAO group 1990, “Guidelines to soil profile description” , Food and Agriculture Organization of the United Nation, FAO publication, Rome. FAO 1997. “The land cover classification system (LCCS)”, Food and Agriculture Organization of the United Nation, Viale delle Terme di Caracalla, 00100 Rome, Italy. Ferenc S. 1998, “GIS Functions – Interpolation”, especial issue, Periodical Polytechnics Civil Engineering, Department of Surveying, Technical University, Budapest, Romania. Electronic version: http://www.agt.bme.hu/public_e/funcint/funcint.html
186
Finke P. A., 2000, “ spatial variability of soil structure and its impact on transport processes and some associated land qualities”, Master of Science, Wageningen Agricultural University, Laboratory of soil science and geology, Wageningen, the Netherlands, http://www.dpw.wageningen-ur.nl/ssg/library/finke.htm Frugoni M. C. M. 1997. “Relationships between soil characteristics and the distribution of woody vegetation in a tropical forest of northern Thailand”, [M.Sc thesis]. Enschede, The Netherlands: International Institute for Aerospace Survey and Earth Sciences (ITC). GARDAP, 1986a, “Semi-detail soil survey reports: part 1 of El Bustan Area I”, by the Ministry of Land Reclamation, Authority for Rehabilitation Projects and Agriculture Developments, the General Department of Soil Studies, the first stage during December 1984 to April 1986, Cairo, Egypt. GARDAP, 1986b, “Semi-detail soil survey reports: part 2 of El Bustan Area II”, by the Ministry of Land Reclamation, Authority for Rehabilitation Projects and Agriculture Developments, the General Department of Soil Studies, the second stage during January 1984 to June 1986, Cairo, Egypt. Goossens, R. et al., 1994”Waterlogging and Soil salinity in the newly reclaimed areas of the western Nile Delta of Egypt.”, environmental change in dry land, biogeographical and geoorphical perspectives, pp 365-377, © John Wily and Sons, New York. Hanna F. 1969, “Pedological studies on the western desert, U.A.R. with reference to Native Vegetation”, Ph.D. Thesis, Faculty of Agriculture, Cairo Univ., Egypt. Hillel D. 1982, “ Fundamentals of soil physics”, Harcourt publishers, New York. Hooghoudt, S. B.(1940). Algemeene beschouwing van het probleem van de detailontwatering en de infiltratie door middle van parallel loopende drains, greppels, slooten, en kanalen. Versl. Landbouwk. Onderz. 46 (14) B. Algemeene Landsdrukkerij, ‘s-Gravenhage, 193 p. Hutchinson M. 2000, “Modeling Spatial and Temporal Variability of Climate and Terrain”, especial issue, Centre for Resource and Environmental Studies, Australian National University, Canberra, Australia. http://www.cres.anu.edu.au/hydweb/hutch2.htm1 ICID Committee on Irrigating and drainage Construction Techniques (1982). ICID standard 109, Construction of surface drains. ICID Bulletin, 31, 1, pp. 47-57. ILWIS 3.11, 2001, “The integrated land and watershed management system (ILWIS): User’s Guide”, using digital terrian models, text book, unit geo software development, sector remote sensing and GIS, ITC, Enschede, The Netherlands.
187
ISSS, 1996, “Terminology for Soil Erosion and Conservation”, Bergsma A., Charman P., Gibbons F., Hurni H., Mulderhauer W. G., and Panichapong S., prepared for int. commission, soil and water conservation of the International Society of Soil Science, printing: Grafisch service center, Wageningen, ISBN 90-71556-15-8, © ISSS, 1996. Jackson, M. L., 1967, “soil chemical analysis”, Prentice hall of India private ltd., New Delhi. Jennifer D. 1996 “Geostatistics and GIS”, Colorado School and Mines, Volume 8, Number 1, An interdisciplinary Geostatistics Newsletter, spring 1996., Electronic Web: http://mines.edu/academic/mining/geosta01.htm2 Jönsson M., 1999, “A spatial statistical analysis of geochemical data in the soil of Asa experimental Forest”, Special issue, Center for Mathematical Sciences, Mathematical Statistics, Lund Institute of Technology, Lund University. Jury W. A. 1991, “Soil physics”, Fifth edition. John Wiley & Sons, INC. New York. Kassas, M. (1994), “Desertification: Environmental Education”, Dosslers-All of US, 7, UNESCO, Center De Catalunia, p.1, March, 1994. Kainz W., 1999, “Principles of Geographic Information Systems”, ITC course module, Textbook, chapter 1, “data analysis”, pp 1-1: 1-19, ITC, Enschede, The Netherlands. Kobkiet, P., Chairoj, W. and Pradit, B., 1993, “Improvement of soils for field crops in the Northeast, Thailand”, workshop on research activities of ADRC contributed to Agricultural Development in Northeast Thailand, Agricultural Development Research Center in Northeast, Khon Kaen, Thailand, pp. 91. Krivoruchko K. 1998, “GIS and Geostatistics: Spatial Analysis of Chernobyl’s Consequences in Belarus”, especial issue, Environment system research institute, Inc.,New York, USA, E-mail:
[email protected] , Electronic Web: http://ncgia_ncgia_ucsb.edu/conf/sa_workshop/papers/kkrivoruchko.htm LADA, (2002), “LADA: Land Degradation Assessment in Dry Lands”, Technical Advisory Group and First Sterring Committee Meeting, Rome 23-25, January 2002. Lal, R. Hall G.F. and Miller F.P. 1989, “ Soil degradation: Basic processes, Land degradation an rehabilitation”, Vol I, 51 - 69. John Wiley and Sons; Ltda, UK. Lal, R. and Stewart B. A. 1998. “Methods for assessment of soil degradation”, Textbook, John Wiley and Sons; Ltda. UK, Library of ITC Enschede, The Netherlands. Lal, R; Stewart, B.A. 1990, “Soil degradation. Advances in soil science”, Vol II Springerverlag, New York inc. United States of America.
188
Land Master Plan, 1986, “Land Master Plane (PACER) report”, final report, volume 2, Annex A-Land resources. Lang Chao-yi 1996, “Kriging Interpolation”, especial report for the project, which is to build a ordinary kriging model for IBM data explorer 2.0 using C language, Department of Computer Science, Cornell University, electronic web: http://www.cornell/kriging.htm Leopold U., 1995. “Application of Geostatistics for Spatial Analysis of Heavy Metals in Soil”, Special issue, Soil Science Department, Faculty of Geography and Geo Sciences, University of Trier, Germany.http://www.trier.gar.Applicationof Geostatistics_for Spatial Analysis.Abstract.htm, Lillesand T. M. and Kiefer R. W. 1994, “Remote Sensing and Image Interpretation”, third edition, pp 524-647, copyright ©, by John Wiley and Sons Inc., published in Canada. Lovell, C.J. and E. G. Youngs (1984). A comparison of steady-state land drainage equations. Agriculture water Management 9, 1, pp. 1-21. Makarovic B., 1973, “Progressive sampling for digital terrain models”, ITC journal, pp: 397 – 416, Enschede, the Netherlands. Markus B., 2001, “Decision Support and Error Handling in GIS Environment”, review article, department of geoinformatics, college of surveying and land management, university of Sopron, Hungaria, Electronic Web: http:\\www.mult1.cri.teria.decision.making.in.gis.htm. Mathilde S. and Alexandra B. 2002, “Proposed Indicators for Land Degradation Assessment of Dry Lands”, Technical Advisory Group and First Sterring Committee Meeting, Rome 23-25, January 2002. Martinez L. J and Zinck J. A. 1994, “Modeling spatial variations of soil compaction in the Gaudier Colonization area, Colombian Amazonia”, ITC journal 1994-3. McBratney, A.B. I.O.A. Odeh, Bishop, T. F.A, Dunbar, M. and Shatar T. M. 2000, “An Overview of pedometric Techniques for Use in Soil Survey”, Geoderma 97 (3-4) pp 293-327. Mclean, E. O., 1982, “soil pH and lime requirement”, in page, A.L. (ed), “methods of soil analysis”, part 2, second ed., Agronomy series No. 9, ASA, SSSA, Madison, Wis., USA, p. 199-234. Mouat D A. Hutchinson C F. 1995, “Desertification in Developed Countries”, International symposium and workshop on Desertification in developed countries. Reprinted from Environmental Monitoring and Assessment, Volume 37, Nos. 1-3, 1995. MSA, 1988, “Topographic map of Abu al-Matamir, sheet NH36-I4 at scale 1: 100,000”, edition by military survey authority 1988, based on soil survey 1970, 1976 and aerial photographs of 1975.
189
MSA, 1984, “Topographic map of Jabal Na’um at, sheet NH36.I4b scale 1: 50,000”, edition by military survey authority 1984, based on soil survey 1970. Nagarajarao, Y. and Jayasree, G., 1994, “Effect of different long-term soil management practices on strength and swell-shrink characteristics, voids and microstructure”, 15th world congress of soil sciences Acapulco, Mexico, transactions, Vol. 6a: commission V: symposia 27, 308. Nelson, D. R. 1994, “Desertification: natural background and human Miss-management”, M. Maainguet, second edition - Berlin, etc. Springer-verlag. Nelson, R. E., (1982), “Carbonates and Gypusum”, in methods of soil analysis, part 2, pp. 181-198, American Society of Agronomy, Inc., Medison, Wisconsin, USA. Niemann, K. O., et al 1991, “Applicability of Digital Terrain Models for Slope Stability”, ITC journal, pp. 127-137, Enschede, the Netherlands. Noaman, K. I. And Sheta A. S., 1988, “Chemical and mineralogical studies on some deposits in north eastern Delta region, Egypt”, Egypt J. Soil Sci., 28, 247. Northwood Technologies Inc 2000, “Vertical Mapper. Key Features: Create Grids”, copyright © 2000 Northwood Technologies Inc., Electronic Web: http://www.northwood.com/verticalmapper.htm Oldeman L. R. 1994, “Global extent of soil degradation”, In: D. J. Greenland and Szabolcs I., Soil resilience and sustainable land use, pp: 99-118, CAB International, Wallingford, London.. Oldeman L. R. et al 1998, “Guidelines for general assessment of the status of humaninduced soil degradation”, ISRIC Publication, Wagningen, the Netherlands, Reprint No. 631459(100), ITC library. Omar, M. S., Hammad, S. A., and Gouda M., 1990, “infiltration charactristics of Sodium affected soils related to soil management”, Egypt J. Soil Sci., 30 (4), 579. Oosterbaan, R. J. (1994) Agricultural Drainage Criteria. Drainage Principles and Applications, ILRI Puplication 16, Chapter 17 ,pp. 635-687 . Osman, A. M., H. M. Ramadan, H. S. Gomaa, and H. E. Khalifa.Risk 2000, “Assessment of Water Logging Problem at West Nubaria (East Desert Road) Area”. Egypt. Egyptian soil Science Society (ESSS), Golden Jubilee Congress, on “Soil and Sustainable Agriculture in the New Century”, October 23-25, 2000, Cairo. Panyachart, K. 1986, “Study on vital soil charactristics affecting cropping practices in Mae Klong basin”, 4th annual conference on methodological techniques in biological sciences, Nakhon Pathom, Thailand, 78, pp. 64-65. Rabie, F., Sheta, A. S., and El-Sharif, O. 1988, “Anthorpic influnces on the properties of some sandy soils in Egypt”, Egypt J. Soil Sci., 28 (2), 153.
190
Ramadan H. M. 1992, “Soil Variability of Dabaa-Fuka Area in Egypt”. Egyptian soil Science Society (ESSS), Vol. 5, No. 2, pp 36 – 48. Ramadan H. M. and M. E. El-Fayoumy 2000, “Spatial and Temporal Soil Variability under the Safe Use of Low Quality Water for Irrigation at Burg El-Arab, NWC, Egypt”, Egyptian soil Science Society (ESSS), Golden Jubilee Congress, on “Soil and Sustainable Agriculture in the New Century”, October 23-25, Cairo. Renduo Z., Peter S. J., and Scott Y. R. 1999, “Estimates of soil Nitrate Distribution using Cokriging with Psudo-Crossvariograms.”, part of project, TRKTRAN, United States Department of Agriculture, Agricultural Research Service, USA, http://www.nal.usda.gov/ttic/tektran/data/0000101/46/000010464/htm1 Rhoades, J. D. 1982, “Soluble salts”, Methods Of Soil Analysis. Part 2, Chemical and Microbiological Properties. Agronomy series no.9, ASA, SSSA, Medison, Wisconsin, USA. Richards, L. A. 1954, “Diagnosis and improvement of saline and alkaline soils”, U.S. Dept. of Agriculture, hand book, No. 6. RIGW, (1992). “The Hydrogeological map of Egypt”, scale 1:500.000 produced by the Research Institute for groundwater. Ritzema, H. P. (1994). Subsurface Flow to Drains. Drainage Principles and Applications, ILRI Puplication 16, Chapter 8, pp. 263-303. Said, R. 1962, “The geology of Egypt”, Els-vier publishes Co., Amsterdam, New York. Sanad M. M. 1995, “Land suitability studies for proper land use in some newly reclaimed areas using Remote Sensing techniques, Egypt”, M.Sc. –thesis. Faculty of agriculture, Cairo University, Egypt. Sayed M. A. et al., 1998, “Risk assessment of waterlogging problem at bustan 1 and 2 areas, Egypt”, especial reports, soils, water, and environment research institute, agriculture research center, Nubariya agricultural research station, Egypt. Serre M. 1999, “Modeling Particulate Matter Using Uncertain Measurements: Case Study for PM-10 in North Carolina”, CSGF Conference, July 15-17, 1999, Holiday Inn, Capitol, Washington DC. , Krell Institute, Washington DC, USA. http://www.Krell.dc/99abstracts.html Sevenhuijsen, R. J. (1994). Surface Drainage System. Drainage Principles and Applications, ILRI Puplication 16, Chapter 20, pp. 799-826. Smedema, L. K. and D. W. Rycroft (1983). Land Drainage: planning and design of agriculture drainage systems. Batsford, London, 376 p. Soil Survey Manual (1981) “ Soil Survey Manual”, Soil conservation service, USDA 430v, issue 1.
191
Soil Survey Staff, (1975), “Soil Mansul Colourcharts”, USDA, soil conserve, Washington, D. C. Stakman W. P. and Van der Harst G. G., 1962, “The use of the pressure membrane apparatus to determine soil moisture contents at PF 3.0 to 4.2 inclusive”, Land and Water Management Research Institute, Hate No. 159. Soil Taxonomy, 1999, “A Basic System of Soil Classification for Making and Interpreting Soil Survey”, USDA, United States Department of Agriculture, Natural Resources Conservation Service, second edition 1999, Agriculture Handbook Number 436, Washington, DC 20402. Stein, A (1998), ” Spatial Statistics for Soil and the Environment”, soil survey course, ITC, lecture note, Enschede, The Netherlands. Tutwiler R., 1999, “ICARDA’s natural resource management research strategy for dry lands”, The Sixth International Conference on the Development of Dry lands, 2227 August, organized by the International Desert Development Commission, in cooperation with ICARDA, Cairo, Egypt. [UNEP]. United Nations Environment planning (1991) Desertification. Control bulletins No 20 UNEP, Nairobi, Kenya. [UNEP]. United Nations Environment planning. (1984) Special reports Desertification. Reprint, ITC Enschede, The Netherlands. [UNCOD] United Nations Conference of Desertification, (1977). Desertification: It’s causes and consequences, the Secretariat of the United Nations Conference on Desertification, Nairobi, Kenya, 29 August to 9 September,1977. Weibel R. and Heller M., 1991 “Digital terrain modeling: geographical information systems, principals and applications”, edited by Maguire D. J., Goodchild M. F., and Rhind D. W., longman, Scientific and Technical. Wesbter, R. (1994). The Development Of Pedometrics. In: de Gruijter, J.J., Webster, R and Myers, D.E. (Eds.), Pedometrics-92: Developments in spatial statistics for soil science. Geoderma, 62: 1-15. Wesbter, R. (1995). Quantitative Spatial Analysis of Soil in the Field. Advances in Soil Science, Volume 3, Springer- Verlag New York Inc. Whisler F. D. et al 2000, “Variability of Physical and Chemical Properties of Alluvial Soils and Their Relationship to Cotton Yield and Variable Rate Technology”, http://www.mississippi state university.projects.htm ,Special issue, Department of Plant and Soil Sciences, University of Mississippi, Mississippi State, USA. World Bank (b), 1984, “monitoring environment progress”, ESD, World Bank, Washington, p 82, USA.
192
Yacoub, R. K. (1999) “Analysis of Selected Soil Properties for Assessing Land Degradation in the Newly Reclaimed Nubariya Area, Egypt”. Master of Science in Soil Survey, International Institute for Aerospace Survey and Earth Sciences (ITC), Enschede, The Netherlands. Zhang R., Shouse P. J., and Yates S. R. 1999, “Estimates of soil Nitrate Distribution using Cokriging with Psudo-Crossvariograms.”, approved date: 1999 – 10 – 13, TRKTRAN, United States Department of Agriculture, Agricultural Research Service, USA, Email:
[email protected], Electronic version: http://www.nal.usda.gov/ttic/tektran/data/0000101/46/0000104641/htm1 Zinck, J.A. (1998). “Physiography and soils”. ITC lecture note, K6 (SOL 41), Enschede, The Netherlands.
193
1
INTRODUCTION ___________________________________________________ 1 1.1 1.2
Problem Identification ____________________________ Error! Bookmark not defined. Objective _______________________________________ Error! Bookmark not defined. 1.2.1 Main Objective ______________________________________ Error! Bookmark not defined. 1.2.2 Specific Objectives ___________________________________ Error! Bookmark not defined.
2
LITERATURE REVIEW _____________________________________________ 6 2.1
Reclamation Areas in Egypt______________________________________________ 6
2.2
Effects of Management in Dry Lands _____________________________________ 50
2.3
Concept of Land Degradation ___________________________________________ 10
2.4
Degradation By Human-Induced ___________________ Error! Bookmark not defined. 2.4.1 2.4.2 2.4.3 2.4.4
2.5
Industrial Land ______________________________________ Error! Bookmark not defined. Agricultural Land ____________________________________ Error! Bookmark not defined. Urban Land _________________________________________ Error! Bookmark not defined. Deforestation ________________________________________ Error! Bookmark not defined.
Soil Degradation Mechanisms ___________________________________________ 12 2.5.1 Degradation By External Soil Material ________________________________________ 12 2.5.2 Degradation By Internal Soil Deterioration ____________________________________ 13
2.6
Analysis and Interpolation Sequences of Data ______________________________ 30 2.6.1 2.6.2 2.6.3 2.6.4 2.6.5
Analysis Sequences of Data _________________________________________________ Point Interpolation Procedures (Gridding)_____________________________________ Analysis of Variances (ANOVA) _____________________________________________ Geostatistical Analysis (Theory of Regionalized Variables) _______________________ The Geostatistical Techniques and Soils Survey Data ____________________________
30 42 31 32 45
2.7
Terrain Analysis (Digital Terrain Model)__________________________________ 27
2.8
Spectral Analysis (Remote Sensing Imagery) _______________________________ 25
2.9
Global Assessment of Land Degradation (GLASOD) ________________________ 52 2.9.1 Soil Degradation Status ____________________________________________________ 53 2.9.2 Extent of Soil Degradation __________________________________________________ 53 2.9.3 Overall Severity Level of Land Degradation ___________________________________ 53
2.10 Agriculture Drainage Systems ___________________________________________ 54 2.10.1 2.10.2 2.10.3 2.10.4
3
Ground water flow into drains _______________________________________________ The Ernst Equation ________________________________________________________ Field Drains and Field Laterals ______________________________________________ Lay-out of Field Drains and Laterals _________________________________________
54 57 58 60
AREA DESCRIPTION ______________________________________________ 62 3.1 3.2
Location _____________________________________________________________ 62 Climate ______________________________________________________________ 62 3.2.1 Atmosphere Climate _______________________________________________________ 62 3.2.2 Soil Climate ______________________________________________________________ 64
3.3 3.4
Geology and Geomorphology ____________________________________________ 65 General Characterization of the Soils _____________________________________ 67 3.4.1 Soil according Master plan __________________________________________________ 67 3.4.2 Initial Soil Characteristics of Year 1986 _______________________________________ 68
3.5
Hydrology ___________________________________________________________ 71
194
3.6
Irrigation and Drainage ________________________________________________ 72
3.7
Vegetation and Land Use _______________________________________________ 72
3.8
Previous Studies ______________________________________________________ 73
4
materials AND METHODs __________________________________________ 75 4.1 4.2
Materials ____________________________________________________________ 75 Methods Applied ______________________________________________________ 76 4.2.1 4.2.2 4.2.3 4.2.4 4.2.5
5
Pre-Field Work ___________________________________________________________ Fieldwork ________________________________________________________________ Laboratory Work _________________________________________________________ Data Processing and Analysis ________________________________________________ Data Interpretation (Land Degradation Assessment) ____________________________
76 78 78 79 81
RESULTS AND DISCUSSION _______________________________________ 85 5.1
Geomorphic Analysis __________________________________________________ 85 5.1.1 Terrain Analysis: Geostatistical Technique ____________________________________ 85
5.2 5.3
Field work ___________________________________________________________ 91 Soils characteristics of year 2001 _________________________________________ 92 5.3.1 Morphological Description __________________________________________________ 92 5.3.2 The Chemical Analysis _____________________________________________________ 94 5.3.3 The Physical Analysis ______________________________________________________ 95
5.4 5.5
Analysis of Variance (ANOVA) __________________________________________ 95 Geostatistical Analysis _________________________________________________ 98 5.5.1 Create The Effective Soil Depth (Water-Table Depth) __________________________ 100 5.5.2 Create The Salic Horizon of Year 2001 _______________________________________ 103 5.5.3 Soil Sets Characteristics: __________________________________________________ 106
5.6 5.7
Monitoring Waterlogging Problem _____________________________________ 137 Land Degradation Assessment Using GLASOD Methodology ________________ 146 5.7.1 5.7.2 5.7.3 5.7.4 5.7.5 5.7.6 5.7.7
5.8
6
7
The ANOVA of Year 1986 _________________________________________________ Geostatistical Analysis ____________________________________________________ Creating Effective Soil Depth, Soil Salinity and Bulk Density of Year 1986 _________ Creating Effective Soil Depth, Soil Salinity and Bulk Density of Year 2001 _________ Calculate the Differences Between Year 1986 and 2001 _________________________ Severity Classes of the Differences___________________________________________ Calculate the Degradation Severity Extent ____________________________________
147 149 150 154 158 161 166
Drainage Efficiency ___________________________________________________ 171
SUMMARY AND CONCLUSION ___________________________________ 176 6.1
Soil Characteristics ___________________________________________________ 176
6.2
Spectral Analysis _____________________________________________________ 177
6.3
Physical Analyses ____________________________________________________ 178
6.4
Degradation assessment _______________________________________________ 178
REFERENCES ___________________________________________________ 182
195
196