Nov 24, 2015 - November 2015: http://onlinelibrary.wiley.com/doi/10.1111/gcb.13106/epdf > open below menue .... 9.43°E-30.3°E, and Kattegat up to the tip of.
Supporting Information
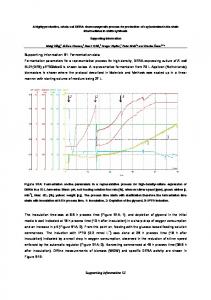
Fig. S1. Autocorrelograms (a) for observed and (b) for simulated time series: 70 highly autocorrelated time series (green) and 70 medium autocorrelated time series (blue) that correspond respectively to the maximum and medium autocorrelation observed in the real time series.
1
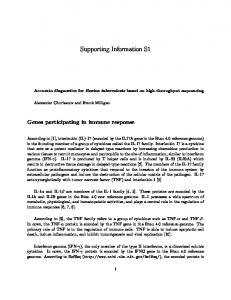
Fig. S2. Comparison of multiple STARS on real and artificial time series: shift years. Data plotted for 72 real time series (red), and 70 artificial time series (with medium – blue, and high autocorrelation - green) for the period from 1946-2012. The ‘period of interest’ (19831990) is marked by vertical lines. (a) Number of significant t-tests per year (p ≤ 0.05). (b) Number of significant shift years per year (p ≤ 0.05).
2
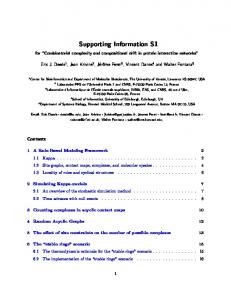
Fig. S3. Comparison of multiple STARS on real and artificial time series: shift strength. Real (a,d) and artificial (b,c,e,f) time series. Data and period analysed as in Supporting Information Fig. S2. (a-c) The length of the longest significant test-period for each shift year out of the 20 test-periods applied is between 6 to 25 years (y-axis). (d-f) The percentage of the number of significant t-tests (p ≤ 0.05) against the total number of possible t-tests for each shift year (y-axis). Results below 20% discarded.
3
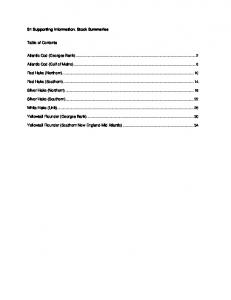
Fig. S4. Replotted figure SPM 1a from the IPCC Summary for Policy Makers (2013). Global temperature changes per decade: (a) Decadal global means of combined land and sea surface temperatures (HadCrut4.3.0.0) as anomalies relative to 1961-1990 for the period 1850 to 2009. Recalculated and re-plotted after figure SPM 1a in the IPCC Summary for Policy Makers (IPCC SPM, 2013); data courtesy Colin P. Mollis, Hadley Centre, Exeter, UK. (b) The change per decade.
4
Fig. S5. Effects of the El Chichón and Pinatubo eruptions on radiation [W m-2]. Direct and diffuse broadband radiation measurements from the Mauna Loa Observatory against years. Redrawn from (Robock, 2000) with superimposed dashed lines for both volcanic eruptions showing the extent and its value as a number of (a) the reduction of direct (red) and (b) the enhancement of diffuse (blue) radiation immediately after the eruptions of El Chichón at the end of March 1982 and Pinatubo in June 1991 (dashed lines). The lower numbers for Pinatubo are 78% (direct) and 72% (diffuse) of the change seen after the earlier eruption. The data were obtained with a tracking pyrheliometer and shade disk pyranometer on mornings with clear skies at a solar zenith angle of 60°, equivalent to two relative air masses. Data from NOAA/ESRL/GMD/GRAD Radiation Archive: ftp://aftp.cmdl.noaa.gov/data/radiation/baseline/ .
5
Table S1. Supporting Information Database Excel file containing the data for all 72 time series analysed . 24. November 2015: http://onlinelibrary.wiley.com/doi/10.1111/gcb.13106/epdf > open below menue "Supplements" > right mouse click on Table S1: Save target as …….
6
Table S2. Supporting source, background and methodology citations. The table addresses the time series presented in Figs. 2-5. Graph title
Supporting citations
Graph title
Supporting citations
Fig. 2 a b c d e f g h i j k l m n
Swiss ~26 km stratospheric temperature Swiss ~5 km tropospheric temperature Meridional wind speed 6075°N ~5 km a.s.l. Zonal wind speed 60-75°N ~5 km a.s.l. China spring dust storm frequency Global tropical hurricane/storm days NH seasonally varying Index (SV-NAM) Arctic Oscillation Index (AO) North Atlantic Oscillation (NAO DJFM) Arctic temperature (SST and LST) Arctic sea level pressure Alaska atmospheric CO2, Apr-Sep Alaska atmospheric CO2, Oct-Mar Global CO2 net land uptake
Brocard et al., 2013
w
Brocard et al., 2013
x
Xiao et al., 2012
y
Xiao et al., 2012
z
Ding et al., 2005
aa
Webster et al., 2005
ab
Ogi et al., 2004
ac
Thompson and Wallace, 1998 Hurrell, 1995
ad ae
Hansen et al., 2006
af
Compo et al., 2011
ag
Barichivich et al., 2012; Thoning et al., 1989 Barichivich et al., 2012; Thoning et al., 1989 Beaulieu et al., 2012; Sarmiento et al., 2010 Barichivich et al., 2013
ah ai aj
t
NH time-integrated temp. of thermal growing season Western Antarctica temperature (LST) Western Antarctica sea-ice extent NH spring snow extent Switzerland snow days, Dec-Mar Baltic Sea sea-ice extent
u
Arctic sea-ice volume (Sep) Lindsay et al., 2009
aq
v
NH sea-ice extent (Sep)
ar
o p q r s
ak
Bromwich et al., 2013
al
Parkinson and Cavalieri, 2008 Brown and Robinson, 2011 Marty 2008
am an ao
Axell and Lindquist, 2005
ap
Rayner et al., 2003
Western USA Wildfire duration (days) NH satellite vegetation
Westerling et al., 2006
NH start of thermal growing season NH length of thermal growing season NH end of thermal growing season Japan Kyoto cherry blossom UK sand martin arrival
Barichivich et al., 2013; Barichivich et al., 2012 Barichivich et al., 2013
Germany grape vine ripening date Baltic river Daugava winter flow Switzerland river temperature Switzerland river pH North Sea phytoplankton biomass North Sea temperature North Sea Skagerrak 50 m depth salinity Japan Sea temperature at 50 m depth North Pacific Kuroshio current flow Japan Sea deep living fish (egg numbers) Japan Sea tuna catch Germany lake algal spring bloom Switzerland groundwater temperature Switzerland Lake Zürich temperature SH annular Mode Index (SAM)
Myneni et al., 1997
Barichivich et al., 2013; Barichivich et al., 2012 Aono and Kazui, 2008 Sparks and Tryjanowski, 2007 Bock et al., 2011 Klavins et al., 2009 Hari et al., 2006; Jakob et al., 2002 Jakob et al., 2002; Sigg and Stumm, 2011 Reid et al., 1998; Raitsos et al., 2014 Ingleby and Huddleston, 2007 Danielssen et al., 1996 Tian et al., 2008 Japan Meteorological Agency 2006 Fujino et al., 2013 Tian et al., 2008 Gerten and Adrian, 2000 Figura et al., 2011 North et al., 2013 Marshall, 2003
Fig. 3 a b c
Japan Kyoto cherry blossom blooming Switzerland Liestal cherry blossom USA Washington D.C. cherry blossom
Aono and Kazui, 2008 Defila and Clot, 2001 Chung et al., 2011
Fig. 4 Continents GHCN v3 Oceans HadSST3
Lawrimore et al., 2011 Kennedy et al., 2011
Fig. 5 a-c d-f
GHCN v3 CRUTEM4
Lawrimore et al., 2011 Jones et al., 2012
g-i j-l
7
HadSST3 HadCRUT4
Kennedy et al., 2011 Morice et al., 2012
Table S3. Additional information and notes on the time series presented in Fig. 2. Dimensionless time series (i. e. NDVI, salinity, pH and indices) have no units; this is indicated with a dash ‘-’. Order as per Fig. 2: atmosphere, cryosphere, terrestrial, hydrophere (ocean and freshwater). Time series title 1 Processed by / Data Originator / Source 2 Organisation 3 Notes Latitude / Longitude Time period Units: Shift years ATMOSPHERE 46.82°N, 6.95°E 1976-2011 a Swiss ~26 km stratospheric temperature °C 1986 46.82°N, 6.95°E 1976-2011 b Swiss ~5 km tropospheric temperature °C 1988 1,2 René Stübi, from Swiss Federal Office of Meteorology and Climatology (MeteoSwiss), Payerne, Switzerland 1948-2010 m s-1 c Meridional wind speed 60-75°N ~5 km a.s.l. 360° circumglobal band 60°N1956, 1988 75°N -1 360° circumglobal band 60°N1948-2010 d Zonal wind speed 60-75°N ~5 km a.s.l. ms 1988, 1997 75°N 1,2 Dong Xiao, from Chinese Academy of Meteorological Sciences, Beijing, China 35°N-48°N, 75°E-102°E 1960-2011 No. of days e China spring dust storm frequency 1984 1 Ruiqiang Ding of dust storms 2 State Key Laboratory of Numerical Modeling for Atmospheric Sciences and Geophysical Fluid Dynamics (LASG), Beijing, China See Supp. Info. table S4 1970-2004 No. of days f Global tropical hurricane/storm days 1988 1 Peter J. Webster, Violeta E. Toma & Hai-Ru Chang per year 2 Georgia Institute of Technology, Atlanta, USA 3 Global total derived from six-hourly reports summed from six ocean basins. > 40°N 1948-2009 g NH SV−NAM Index 1987, 1994 1 http://wwwoa.ees.hokudai.ac.jp/people/yamazaki/SV-NAM/index.html 2 Hokkaido University, Japan 3 The index is the standardised score of the leading empirical orthogonal function (EOF) of the monthly and zonally averaged geopotential height fields poleward of 40°N from 1000 hPa to 200 hPa. > 20°N 1950-2012 h Arctic Oscillation Index (AO) - 1987, 1988, 1994 1 http://www.esrl.noaa.gov/psd/data/climateindices/list/#AO 2 NOAA Earth System Research Laboratory, Boulder, USA 3 Determined as the leading orthogonal empirical function at the height of the 1000 hPa surface (approximately sea level pressure) and plotted as anomalies relative to 1979-2000. 38.71-65.07°N, 9.14-22.72°W 1946-2011 i North Atlantic Oscillation (NAO, DJFM) hPa 1961, 1971, 1972, 1 https://climatedataguide.ucar.edu/sites/default/files/climate_index_files/nao_station_djfm.ascii 1995 2 Climate Analysis Section, NCAR, Boulder, USA 3 The winter (December-March) NAO index used here is the normalised sea level pressure (SLP) between Lisbon, Portugal and Stykkisholmur/Reykjavik as anomalies relative to 1864-1983. > ~64°N 1946-2012 j Arctic temperature (SST and LST) °C 1987, 1999, 2004 1 GISS Land-Ocean Temperature Index (LOTI), http://data.giss.nasa.gov/gistemp/tabledata_v3/ZonAnn.Ts+dSST.txt 2 NASA Goddard Institute for Space Studies (GISS), New York, USA > 70°N 1946-2010 k Arctic sea level pressure hPa 1987, 1995 1 http://www.esrl.noaa.gov/psd/data/gridded/data.20thC_ReanV2.monolevel.mm.html 2 NOAA Earth System Research Laboratory, Boulder, USA 71.32°N, 156.61°W 1972-2010 l Alaska atmospheric CO2, Apr−Sep ppm 1985, 1988 71.32°N, 156.61°W 1972-2010 m Alaska atmospheric CO2, Oct−Mar ppm 1986, 1988 1 Jonathan Barichivich and Renata E. Hari; ftp://ftp.cmdl.noaa.gov/ccg/co2/GLOBALVIEW 2 Cooperative Atmospheric Data Integration Project – CarbonDioxide, Boulder, USA 90°S-90°N 1966-2003 Pg C year-1 n Global CO2 net land uptake 1988 1,2 Claudie Beaulieu, from Ocean and Earth Science, University of Southampton, UK 3 The net land uptake (NLU) is calculated as a difference between annually reported global fossil fuel emissions, the growth rate of atmospheric CO2 as a mean of measurements at Mauna Loa and the South Pole and the ocean uptake as a mean calculated from four ocean biogeochemical models. The NLU, as opposed to the land uptake, does not require specification of land use sources, which have remained approximately constant from 1959 to 2006. 1950-2011 o NH integrated temperature growing season > 35°N °C 1987, 2004 1,2 Jonathan Barichivich, from University of East Anglia, UK 3 The thermal growing season is defined as the period of the year with daily mean air temperatures > 5°C. Plotted as anomalies relative to 1961-1990. 80°S, 120°W 1957-2012 p Western Antarctica temperature (LST) °C 1986 1 David H. Bromwich, http://polarmet.osu.edu/Byrd_recon/ 2 The Ohio State University, Columbus, USA
8
Time series title 1 Processed by / Data Originator / Source 2 Organisation 3 Notes Latitude / Longitude Time period Units: Shift years CRYOSPHERE 50°S-75°S, 60°W-130°W 1979-2010 q Western Antarctica sea−ice extent 106 km2 1987 1 Claire L. Parkinson or coast of Antarctica 2 NASA Goddard Space Flight Center, Greenbelt, USA 0-90°N 1946-2010 1953, 1987 r NH spring snow extent 106 km2 1 Ross Brown, see also: http://www.the-cryosphere.net/5/219/2011/tc-5-219-2011-supplement.zip 2 Climate Research Division, Environment Canada, Montreal, Canada 45.82°N-47.81°N, 5.96°E-10.49°E 1946 to 2012 s Swiss snow days, Dec−Mar snow days 1987 1,2 Christoph Marty, from WSL Institute for Snow and Avalanche Research, Davos, Switzerland and the Swiss Federal Office of Meteorology and Climatology (MeteoSwiss) 3 Mean of seven low-altitude stations (201–800 m). For this altitudinal band a snow day is when the snow depth exceeds a threshold of 5 cm. 53.91°N-65.91°N, 9.43°E-30.3°E, 1946-2012 t Baltic Sea sea−ice extent 106 km2 1987 and Kattegat up to the tip of 1 Lars B. Axell and Karin Borenäs Skagen at 57.75°N 2 Sveriges Meteorologiska och Hydrologiska Institut (SMHI), Norrköping and Gothenburg, Sweden 3 From 1957 to 2012 the time series is based on digitized hand-drawn ice charts and prior to 1957 on a least-squares method applied to observations along the Swedish coast. The total area evaluated covers 420·103 km2 with the maximum ice extent due to the methodology prior to 1957 equal to ~351·103 km2. > 65°N 1950-2012 u Arctic sea−ice volume (Sep) 103 km3 1960, 1980, 1988, 1 Ron Lindsay, from the PIOMAS ice-ocean coupled model 1992, 1994, 1997, 2 Polar Science Center, University of Washington 2004 0-90°N 1960-2011 v NH sea−ice extent (Sep) 103 km2 1978, 1989, 1998, 1 Ron Lindsay, from the Hadley Centre Global Sea Ice and Sea Surface Temperature (HadISST1) 2001, 2004 gridded dataset http://www.metoffice.gov.uk/hadobs/hadisst/ 2 Polar Science Center, University of Washington, Seattle, USA TERRESTRIAL 31°N-49°N, 102°W-125°W 1970-2003 No. of days w Western USA Wildfire duration (d) 1985 1 Anthony L. Westerling per fire 2 University of California, Merced, USA 3 The time series is based on 1166 large (> 400 ha) forest wildfires. > 45°N 1982-2010 x NH satellite vegetation 1987, 1988, 1996 1 NDVI3g (third generation Global Inventory Modeling and Mapping System (GIMMS) NDVI > 35°N 1950-2011 day of the yr y NH start thermal growing season 1972, 1988 > 35°N 1950-2011 z NH length thermal growing season days 1987, 2004 > 35°N 1950-2011 day of the yr aa NH end thermal growing season 1993, 2002 1 Jonathan Barichivich 2 University of East Anglia, UK 3 The thermal growing season is defined as the period of the year with daily mean air temperatures > 5°C. Plotted as anomalies relative to 1961-1990. 35°N, 136.67°E 1946-2012 day of the yr ab Japan Kyoto cherry blossom 1988 1 Yasuyuki Aono, data updated and revised 2 Osaka Prefecture University, Japan 50.72°N-54.19°N, 2.58°W-1.75°E 1950-2005 day of the yr 1976, 1980, 1988 ac UK sand martin arrival 1 Tim Sparks 2 Coventry University, UK 49.83° N, 9.87° E 1968-2010 day of the yr ad Germany grape vine ripening date 1987, 1991 1 Anna Bock 2 Technische Universität München, Freising, Germany 3 Harvested from the vineyards of the Landesanstalt für Weinbau und Gartenbau (the regional office for viticulture and horticulture) Veitshöchheim, Franconia, Germany.
9
Time series title Latitude / Longitude Time period Units: Shift years HYDROSPHERE (OCEAN AND FRESHWATER) 55.2°N-57.4°N, 24°E-28.2°E 1946-2010 ae Baltic river Daugava winter flow m3 s-1 1987 1 Maris Klavins 2 University of Latvia, Riga, Latvia 3 Basin area: 64'500 km2. 45.82°N-47.81°N, 5.9°E-10.49°E 1978-2011 af Swiss river temperature °C 1987 1 Renata E. Hari 2 Swiss Federal Office for the Environment (BAFU), Hydrology Division 45.82°N-47.81°N, 5.9°E-10.49°E 1977-2010 ag Swiss river pH 1991 1 Renata E. Hari 2 Swiss Federal Office for the Environment (BAFU), Hydrology Division 3 Legislation to reduce phosphate inputs to lakes and rivers was introduced in Switzerland in 1986. This would have had the opposite effect to the observed increase in pH: less phosphate → less algal growth → more CO2 →lower pH. It is more likely that the higher pH reflects increased algal growth due to higher temperatures, more sunshine and a higher CO2 concentration or increased weathering. 51°N-61°N, 3°W-10°E 1946-2011 ah North Sea phytoplankton biomass Colour 1951, 1985 1 Sir Alister Hardy Foundation for Ocean Science (SAHFOS). categories 2 SAHFOS, Plymouth, UK 3 Unit details: Four colour categories calibrated by acetone extracts and fluorescence 50°N-61°N and 3°W-9°E 1950-2011 ai North Sea temperature °C 1987, 2001 1 Simon A. Good 2 UK Met Office Hadley Centre, Exeter; EN3: quality controlled subsurface ocean temperature and salinity dataset. See: http://www.metoffice.gov.uk/hadobs/en3/ 58.13°N, 9.18°E 1965-2007 aj North Sea 50 m depth salinity 1988 1 Else Juul Green, http://ocean.ices.dk/HydChem/HydChem.aspx?plot=yes 2 International Council for the Exploration of the Seas, Copenhagen, Denmark 3 The sampling location is equivalent to the Norwegian station Z220, which is 20 miles from the Norwegian coast. Measurements have been taken approximately once a month. 33-38°N, 130-136°E 1964-2008 ak Japan Sea temperature at 50 m depth °C 1987 1 Yongjun Tian from the Japan Sea National Fisheries Research Institute. 2 Japan Sea National Fisheries Research Institute, Niigata, Japan. 3 Monthly measurements taken in the Japan Sea. to cover the path of the Tsushima Current between Wakasa Bay in Kyoto Prefecture and Yamaguchi Prefecture, Japan and averaged for the area within 33-38°N, 130-136°E. across 137°E between 3-34°N 1972-2011 al North Pacific Kuroshio current flow 1 Sv = 1987 1 Yongjun Tian from theJapan Meteorological Agency (JMA), Tokyo, Japan. 106 m3 s-1 2 Japan Sea National Fisheries Research Institute, Niigata, Japan. 3 Current flow estimated from geostrophic calculations based on temperature and salinity profiles taken twice a year (summer = Jul-Sep and winter = Jan-Mar) on a standard north to south section during research cruises of the Japan Meteorological Agency (JMA). between 34.45°N-41.17°N and 1981-2005 No. of eggs am Japan Sea deep living fish (eggs) 1988 1 Yongjun Tian from theJapan Meteorological Agency (JMA), Tokyo, Japan. per m2 2 Japan Sea National Fisheries Research Institute, Niigata, Japan. 3 Sampling stations were located within approximately 185 km of the coast of Japan. This abundant mesopelagic (1000-100 m deep) species normally swims between 150 to 250 m during the daytime and migrates to shallower depths during the night. 34°N-41.5°N, 131°E-141°E 1964-2004 an Japan Sea tuna catch 103 tons 1991 1 Yongjun Tian from theJapan Meteorological Agency (JMA), Tokyo, Japan. 2 Japan Sea National Fisheries Research Institute, Niigata, Japan. 3 Mostly comprising warm-water bluefin, albacore, and yellowfin tuna. 13.65°E, 52.43°N 1980-2010 ao Germany lake algal spring bloom Calendar 1987 1 Rita Adrian week 2 Leibniz- Institute of Freshwater Ecology and Inland Fisheries, Berlin, Germany. 3 The timing refers to the calendar week of the year when maximum total phytoplankton biomass developed after ice-off. Pump-stations: Kiesen 46.80°N, 1970-2005 ap Swiss groundwater temperature °C 1987 7.57°E;Neuhausen 47.68°N, 1 Simon Figura 8.61°E 2 Energie Wasser Bern and Städtische Werke Schaffhausen und Neuhausen am Rheinfall 47.37°N-47.20°N, 8.53°E-8.82°E 1946-2005 aq Swiss Lake Zürich temperature °C 1987 1 Ryan P. North. 2 Oliver Köster from Wasserversorgung der Stadt Zürich 40°S and 65°S 1957-2012 ar SH Annular Mode Index (SAM) 1992, 1996 1 http://www.nerc-bas.ac.uk/icd/gjma/sam.html 2 British Antarctic Survey, Cambridge, UK 3 The index used here is derived from a proxy zonal mean sea level pressure for 40°S and 65°S calculated from twelve meteorological stations that approximate to each of these latitudes, anomalies relative to 1971-2000.
10
Table S4. Coordinates for six regions of tropical hurricane/storms in Fig. 6. The six regions (A-F, outlined in Fig. 6) are averaged to give a ‘global’ total for tropical hurricane/storm days. Ocean region A B C D E F
Eastern North Pacific North Atlantic North Indian South Indian Western North Pacific Southwest Pacific
Minimum latitude 5°N 5°N 5°N 5°S 5°N 5°S
Maximum latitude 20°N 25°N 20°N 20°S 20°N 20°S
Minimum longitude 90°W 20°W 55°E 50°E 120°E 155°E
11
Maximum longitude 120°W 90°W 90°E 115°E 180°E 180°E
Table S5. Shift year of the time series from Fig. 2 included in the regions of Fig. 6. EUROPE INSET 2b Switzerland Payerne ~5 km tropospheric air temperature, atmosphere 2t Baltic Sea sea-ice extent, cryosphere 2ac UK sand martin arrival date, terrestrial biosphere 2ad Germany grape vine ripening date, terrestrial biosphere 2ae Baltic river Daugava winter flow, terrestrial hydrosphere 2af Switzerland river temperature, terrestrial hydrosphere 2ah North Sea phytoplankton biomass, marine biosphere 2ai North Sea temperature, marine hydrosphere 2ao Germany Lake Müggelsee algal bloom spring timing, terrestrial biosphere
1988 1987 1988 1987 1987 1987 1985 1987 1987
JAPAN INSET 2ak Japan Sea temperature at 50m depth, marine hydrosphere 2al Western North Pacific Kuroshio current flow, marine hydrosphere 2ab Japan Kyoto cherry blossom blooming, terrestrial biosphere
1987 1987 1988
GLOBAL MAP North America 2m Alaska Point Barrow atmospheric CO2 concentration (Apr-Sep), atmosphere 2n Alaska Point Barrow atmospheric CO2 concentration (Oct-Mar), atmosphere 2w Western USA Wildfire duration (days), terrestrial biosphere Asia 2e China dust storm frequency (March-May), atmosphere Tropics 2f Global tropical hurricane/storm days (mean areas A-F), atmosphere Antarctica 2p Western Antarctica air surface temperature Byrd station, atmosphere 2q Western Antarctica sea-ice extent, cryosphere
1985 1986 1985 1984 1988 1986 1987
GLOBAL AND HEMISPHERIC TIME SERIES Arrows left to right: 2n Global CO2 net land uptake, atmosphere 2r Northern Hemisphere spring snow extent, cryosphere 2x Northern Hemisphere vegetation from satellites, terrestrial biosphere 2j Arctic combined sea and air surface temperature, atmosphere 2k Arctic sea level pressure, atmosphere 2c Meridional wind speed 60-75°N (360°) ~5 km above sea level, atmosphere 2d Zonal wind speed 60-75°N (360°) ~5 km above sea level, atmosphere
12
1988 1987 1987 1987 1987 1988 1988
Additional References for Supporting Information table S2 Aono Y, Kazui K (2008) Phenological data series of cherry tree flowering in Kyoto, Japan, and its application to reconstruction of springtime temperatures since the 9th century. International Journal of Climatology, 28, 905-914. Axell L, Lindquist K (2005) Reconstruction of Annual Maximum Ice Extent in the Baltic Sea 1660-2005. In: Fifth Workshop on BalticSea Ice Climate. (eds Schrum C, Schmelzer N), pp. 79-80, Bundesamt für Seeschifffahrt und Hydrographie, Hamburg, Germany. Barichivich J, Briffa KR, Myneni R et al. (2013) Large-scale variations in the vegetation growing season and annual cycle of atmospheric CO2 at high northern latitudes from 1950 to 2011. Global Change Biology, 19, 3167-3183. Barichivich J, Briffa KR, Osborn TJ, Melvin TM, Caesar J (2012) Thermal growing season and timing of biospheric carbon uptake across the Northern Hemisphere. Global Biogeochemical Cycles, 26, GB4015. Beaulieu C, Sarmiento JL, Mikaloff Fletcher SE, Chen J, Medvigy D (2012) Identification and characterization of abrupt changes in the land uptake of carbon. Global Biogeochemical Cycles, 26, GB1007. Bock A, Sparks T, Estrella N, Menzel A (2011) Changes in the phenology and composition of wine from Franconia, Germany. Climate Research, 50, 69-81. Brocard E, Jeannet P, Begert M, Levrat G, Philipona R, Romanens G, Scherrer SC (2013) Upper air temperature trends above Switzerland 1959–2011. Journal of Geophysical Research: Atmospheres, 118, 4303-4317. Bromwich DH, Nicolas JP, Monaghan AJ, Lazzara MA, Keller LM, Weidner GA, Wilson AB (2013) Central West Antarctica among the most rapidly warming regions on Earth. Nature Geoscience, 6, 139-145. Brown RD, Robinson DA (2011) Northern Hemisphere spring snow cover variability and change over 1922-2010 including an assessment of uncertainty. The Cryosphere, 5, 219–229. Chung U, Mack L, Yun JI, Kim S-H (2011) Predicting the timing of cherry blossoms in Washington, DC and Mid-Atlantic states in response to climate change. PLoS One, 6, e27439. Compo GP, Whitaker JS, Sardeshmukh PD et al. (2011) The Twentieth Century Reanalysis Project. Quarterly Journal of the Royal Meteorological Society, 137, 1-28. Danielssen DS, Svendsen E, Ostrowski M (1996) Long-term hydrographic variation in the Skagerrak based on the section Torungen–Hirtshals. ICES Journal of Marine Science, 53, 917–925. Defila C, Clot B (2001) Phytophenological trends in Switzerland. International Journal of Biometeorology, 45, 203-207. Ding R, Li J, Wang S, Ren F (2005) Decadal change of the spring dust storm in northwest China and the associated atmospheric circulation. Geophysical Research Letters, 32, L02808. Figura S, Livingstone DM, Hoehn E, Kipfer R (2011) Regime shift in groundwater temperature triggered by the Arctic Oscillation. Geophysical Research Letters, 38, L23401. Fujino T, Goto T, Shimura T et al. (2013) Decadal variation in egg abundance of a mesopelagic fish, Maurolicus japonicus, in the Japan Sea during 1981-2005. Journal of Marine Science and Technology, 21, 58-62.
13
Gerten D, Adrian R (2000) Climate-driven changes in spring plankton dynamics and the sensitivity of shallow polymictic lakes to the North Atlantic Oscillation. Limnology and Oceanography, 45, 1058-1066. Hansen J, Sato M, Ruedy R, Lo K, Lea DW, Medina-Elizade M (2006) Global temperature change. Proceedings of the National Academy of Sciences of the United States of America, 103, 14288-14293. Hari RE, Livingstone DM, Siber R, Burkhardt-Holm P, Güttinger H (2006) Consequences of climatic change for water temperature and brown trout populations in Alpine rivers and streams. Global Change Biology, 12, 10-26. Hurrell JW (1995) Decadal trends in the North Atlantic Oscillation: regional temperatures and precipitation. Science, 269, 676-679. Ingleby B, Huddleston M (2007) Quality control of ocean temperature and salinity profiles — Historical and real-time data. Journal of Marine Systems, 65, 158-175. Jakob A, Binderheim-Bankay E, Davis JS (2002) National long-term surveillance of Swiss rivers. Verhandlungen Internationale Vereinigung für theoretische und angewandte Limnologie, 28, 1101-1106. Japan Meteorological Agency (2006) The Medical Examination of the Sea: a Synthetic Examination (First Edition, in Japanese), pp. 196. Jones PD, Lister DH, Osborn TJ, Harpham C, Salmon M, Morice CP (2012) Hemispheric and large-scale land-surface air temperature variations: An extensive revision and an update to 2010. Journal of Geophysical Research: Atmospheres, 117, D05127. Kennedy JJ, Rayner NA, Smith RO, Parker DE, Saunby M (2011) Reassessing biases and other uncertainties in sea surface temperature observations measured in situ since 1850: 1. Measurement and sampling uncertainties. Journal of Geophysical Research: Atmospheres, 116, D14103. Klavins M, Briede A, Rodinov V (2009) Long term changes in ice and discharge regime of rivers in the Baltic region in relation to climatic variability. Climatic Change, 95, 485498. Lawrimore JH, Menne MJ, Gleason BE, Williams CN, Wuertz DB, Vose RS, Rennie J (2011) An overview of the Global Historical Climatology Network monthly mean temperature data set, version 3. Journal of Geophysical Research: Atmospheres, 116, D19121. Lindsay RW, Zhang J, Schweiger A, Steele M, Stern H (2009) Arctic sea ice retreat in 2007 follows thinning trend. Journal of Climate, 22, 165-176. Marshall GJ (2003) Trends in the Southern Annular Mode from observations and reanalyses. Journal of Climate, 16, 4134-4143. Marty C (2008) Regime shift of snow days in Switzerland. Geophysical Research Letters, 35, L12501. Morice CP, Kennedy J.J, Rayner NA, Jones PD (2012) Quantifying uncertainties in global and regional temperature change using an ensemble of observational estimates: The HadCRUT4 dataset. Journal of Geophysical Research: Atmospheres, 117, D08101. Myneni RB, Keeling CD, Tucker CJ, Asrar G, Nemani RR (1997) Increased plant growth in the northern high latitudes from 1981 to 1991. Nature, 386, 698-702. North RP, Livingstone DM, Hari RE, Köster O, Niederhauser P, Kipfer R (2013) The physical impact of the late 1980s climate regime shift on Swiss lakes and rivers. Inland Waters, 3, 341-350. Ogi M, Yamazaki K, Tachibana Y (2004) The summertime annular mode in the Northern Hemisphere and its linkage to the winter mode. Journal of Geophysical Research: Atmospheres, 109, D20114. 14
Parkinson CL, Cavalieri DJ (2008) Arctic sea ice variability and trends, 1979–2006. Journal of Geophysical Research: Oceans, 113, C07003. Raitsos DE, Pradhan Y, Lavender SJ, Hoteit I, Mcquatters-Gollop A, Reid PC, Richardson AJ (2013) From silk to satellite: half a century of ocean colour anomalies in the Northeast Atlantic. Global Change Biology, 20 2117-23. Rayner NA, Parker DE, Horton EB et al. (2003) Global analyses of sea surface temperature, sea ice, and night marine air temperature since the late nineteenth century. Journal of Geophysical Research: Atmospheres, 108, 4407. Reid PC, Edwards M, Hunt HG, Warner AJ (1998) Phytoplankton change in the North Atlantic. Nature, 391, 546. Sarmiento JL, Gloor M, Gruber N et al. (2010) Trends and regional distributions of land and ocean carbon sinks. Biogeosciences, 7, 2351- 2367. Sigg L, Stumm W (2011) Aquatische Chemie. Einführung in die Chemie natürlicher Gewässer.Zürich, vdf Hochschulverlag AG an der ETH Zürich. Sparks T, Tryjanowski P (2007) Patterns of spring arrival dates differ in two hirundines. Climate Research, 35, 159-164. Thompson DWJ, Wallace JM (1998) The Arctic Oscillation signature in the wintertime geopotential height and temperature fields. Geophysical Research Letters, 25, 12971300. Thoning KW, Tans PP, Komhyr WD (1989) Atmospheric carbon dioxide at Mauna Loa Observatory: 2. Analysis of the NOAA GMCC data, 1974–1985. Journal of Geophysical Research: Atmospheres, 94, 8549-8565. Tian Y, Kidokoro H, Watanabe T, Iguchi N (2008) The late 1980s regime shift in the ecosystem of Tsushima warm current in the Japan/East Sea: evidence from historical data and possible mechanisms. Progress in Oceanography, 77, 127-145. Webster PJ, Holland GJ, Curry JA, Chang H-R (2005) Changes in tropical cyclone number, duration, and intensity in a warming environment. Science, 309, 1844-1846. Westerling AL, Hidalgo HG, Cayan DR, Chang H-R (2006) Warming and earlier spring increase western U.S. forest wildfire activity. Science. 313, 940-943. Xiao D, Li J, Zhao P (2012) Four-dimensional structures and physical process of the decadal abrupt changes of the northern extratropical ocean–atmosphere system in the 1980s. International Journal of Climatology, 32, 983-994.
15