Zanotti-Fregonara et al. EJNMMI Research 2013, 3:47 http://www.ejnmmires.com/content/3/1/47
ORIGINAL RESEARCH
Open Access
11
C-LY2428703, a positron emission tomographic radioligand for the metabotropic glutamate receptor 1, is unsuitable for imaging in monkey and human brains Paolo Zanotti-Fregonara1, Vanessa N Barth2, Sami S Zoghbi1, Jeih-San Liow1, Eric Nisenbaum2, Edward Siuda2, Robert L Gladding1, Denise Rallis-Frutos1, Cheryl Morse1, Johannes Tauscher2, Victor W Pike1 and Robert B Innis1*
Abstract Background: A recent study from our laboratory demonstrated that 11C-LY2428703, a new positron emission tomographic radioligand for metabotropic glutamate receptor 1 (mGluR1), has promising in vitro properties and excellent in vivo performance for imaging rat brain. The present study evaluated 11C-LY2428703 for imaging mGluR1 in monkey and human brains. Methods: Rhesus monkeys were imaged at baseline and after administration of an mGluR1 blocking agent to calculate nonspecific binding, as well as after the administration of permeability glycoprotein (P-gp) and breast cancer resistance protein (BCRP) blockers to assess whether 11C-LY2428703 is a substrate for efflux transporters at the blood–brain barrier. Human imaging was performed at baseline in three healthy volunteers, and arterial input function was measured. Results: Overall brain uptake was low in monkeys, though slightly higher in the cerebellum, where mGluR1s are concentrated. However, the uptake was not clearly displaceable in the scans after mGluR1 blockade. Brain penetration of the ligand did not increase after P-gp and BCRP blockade. Brain uptake was similarly low in all human subjects (mean VT with a two-tissue compartment model, 0.093 ± 0.012 mL/cm3) and for all regions, including the cerebellum. Conclusions: Despite promising in vitro and in vivo results in rodents, 11C-LY2428703 was unsuitable for imaging mGluR1s in monkey or human brain because of low brain uptake, which was likely caused by high binding to plasma proteins. Keywords: mGluR1, PET, Kinetic modeling, Dosimetry
Background Metabotropic glutamate receptors 1 (mGluR1s) are Gcoupled receptors that regulate several brain functions, including synaptic transmission and plasticity and cellular excitability, and are potentially interesting drug targets [1]. However, the development of mGluR1 radioligands for positron emission tomography (PET) has been challenging. Successful tracers should have * Correspondence:
[email protected] 1 Molecular Imaging Branch, National Institute of Mental Health, 10 Center Drive, Bethesda, MD 20892, USA Full list of author information is available at the end of the article
high affinity for mGluR1 but not significantly bind to other receptors, particularly the structurally similar mGluR5. Although several potential mGluR1 PET radioligands have been described [2-8], only two [8,9] have proven successful for imaging nonhuman primates, and none have been tested in humans. Our laboratory recently described a new 11C-labeled mGluR1 antagonist - 11C-LY2428703 - with very promising characteristics. From an in vitro perspective, LY2428703 has high affinity for human mGluR1s; after a competition binding assay with 3H-LSN456066, Ki was 2.7 ± 0.5 nM for males and 1.4 ± 0.4 nM for females. In
© 2013 Zanotti-Fregonara et al.; licensee Springer. This is an Open Access article distributed under the terms of the Creative Commons Attribution License (http://creativecommons.org/licenses/by/2.0), which permits unrestricted use, distribution, and reproduction in any medium, provided the original work is properly cited.
Zanotti-Fregonara et al. EJNMMI Research 2013, 3:47 http://www.ejnmmires.com/content/3/1/47
addition, LY2428703 has high specific binding to brain homogenates displaceable only by mGluR1 antagonists and no significant affinity for other human mGluRs [10]. An in vivo PET imaging study of rodents expanded this favorable profile; indeed, that study found a large specific and displaceable signal in rat cerebellum, insignificant in vivo binding to mGluR5, and negligible accumulation of radiometabolites in brain. In addition, LY2428703 was not a substrate for efflux transporters at the blood–brain barrier, as assessed in genetic knockout mice for ABCB1 (permeability glycoprotein (P-gp)) and ABCG2 (breast cancer resistance protein (BCRP)) [10]. This study sought to determine whether 11C-LY2428703 could image and quantify mGluR1s in monkey and human brains in a manner similar to its demonstrated ability to do so in rodent brain. To answer this question, we intravenously injected 11C-LY2428703 into rhesus monkeys and healthy humans and quantified brain uptake relative to the delivery of radioligand to the brain via arterial plasma (i.e., using compartmental modeling). We also examined factors known to affect the utility of radioligands for brain imaging: blockade of entry into brain by efflux transporters at the blood–brain barrier, the density of the target (mGluR1) in brain, the affinity of 11C-LY2428703 for mGluR1, and binding of the radioligand to plasma proteins.
Methods Radioligand preparation 11
C-LY2428703 was synthesized as previously described [10] and according to our Investigational New Drug Application #112,494, submitted to the US Food and Drug Administration. The radioligand was obtained in high radiochemical purity (>99%) and specific activity (specific activity at injection is reported below). Labeling was done with 11C, because it does not modify the basic structure of the molecule. Saturation binding assay
P2 membrane fractions were prepared from the cerebella of male Sprague–Dawley rats (n = 3), male rhesus monkeys (n = 3), and female humans (n = 4). For saturation analyses, 100 μg of cerebellar membrane protein and increasing concentrations of [3H]LY456066 [11] were added to quadruplicate wells in the presence of binding buffer (10 mM K2HPO4, 1.2 mM KH2PO4, 100 mM KCl, 0.1% DMSO, 0.05% ethanol and 0.1% BSA, pH 7.6). Nonspecific binding was defined by heterologous displacement of 1 μM LY480084 (mGlu1 antagonist) in select wells. Plates were incubated on ice for 75 min and membranes harvested on 0.3% polyethylenimine pretreated Wallac filter mats using a Tomtec Harvester MachII (Tomtec, Hamden, CT, USA). Dissociation constant (KD) and receptor density (Bmax) values were
Page 2 of 9
obtained in GraphPad Prism using standard nonlinear one-site binding equations. Data are presented as mean ± SEM (n = 3 to 4); one-way analysis of variance followed by Tukey's post hoc test. Radiochromatographic analyses
Plasma analyses were performed on a reverse-phase chromatography C18 column (Novapak, 4 μm, 100 × 8 mm, Waters Corp. Milford, MA, USA) using Radial-Pak® compression module RCM-100 with a sentry precolumn. Human plasma analyses were performed with a mobile phase of MeOH/H2O/Et3N, 65:15:0.1 by volume, at a flow rate of 2.5 mL/min; nonhuman primate plasma samples were analyzed with a mobile phase of MeOH/ H2O/Et3N, 72.5:27.5:0.1 by volume, at a flow rate of 1.5 mL/min. To compare the outcome from both systems, elution volume is reported rather than retention time. In vitro stability of 11C-LY2428703 in human and nonhuman primate blood
Nonradioactive anticoagulated blood was obtained on the day of study from either human or nonhuman primates. Aliquots of 11C-LY2428703 (about 150 kBq) were added to 0.5 mL of whole blood or 0.5 mL of plasma. Samples were incubated at room temperature for 30 min, after which either 450 μL of the radioactive plasma was added to 720 μL of acetonitrile or 200 μL of the radioactive whole blood was added to 300 μL of water. The tube containing the blood suspension was shaken well to mix and lyse the blood cells. Seven hundred and twenty microliters of acetonitrile was subsequently added and mixed well to precipitate the proteins, followed by 100 μL of water, which was again re-mixed. Radioactivity in the tubes was measured in a gamma counter and then centrifuged at 10,000×g for 1 min. The clear supernatant liquid was injected into the high-performance liquid chromatography (HPLC) column and the precipitate counted to calculate the recovery of radioactivity into the acetonitrile. The stability of the radioligand in whole blood or plasma was calculated as the ratio of the HPLC % composition of samples divided by the radiochemical purity of the radioligand. Radiometabolites of 11C-LY2428703 in human and nonhuman primate plasma in vivo
Arterial plasma was analyzed as previously described [12]. Briefly, after 11C-LY2428703 injection into either human or nonhuman primate, the input function was determined by periodically drawing anticoagulated blood samples. Blood aliquots were removed so that the γ-counter could provide information necessary for vascular correction. The remaining blood was then centrifuged, and plasma (450 μL) aliquots were removed
Zanotti-Fregonara et al. EJNMMI Research 2013, 3:47 http://www.ejnmmires.com/content/3/1/47
and placed in acetonitriles (720 μL/ea) spiked with carrier LY2428703. The samples were mixed well, 100 μL water aliquots were added, and then, the sample was further mixed. The samples were counted in the γ-counter and centrifuged at 10,000×g for 1 min. The clear supernatant liquids were injected onto the radio-HPLC as described above. The precipitates were then counted for radioactivity to allow the calculation of the efficiency of recovery of radioactivity in the acetonitrile. Human plasma samples were separated with a mobile phase of higher polarity (MeOH/H2O/Et3N, 65:15:0.1 by volume) to ensure that the parent radiochromatographic peak comprised a single radiochemical species. Plasma free fraction
The plasma free fraction (fp) of 11C-LY2428703 was measured by ultrafiltration through membrane filters (Centrifree; Millipore, Billerica, MA, USA) as previously described [13]. Briefly, about 740 kBq of 11C-LY2428703 (approximately 5 μL) was added to 650 μL of plasma. The mixture was incubated at room temperature for 10 min and then processed as described previously [13]. When radioactivities for the filter components were high, they were allowed to decay until they were within the optimal range of the γ-counter. Determining the free fraction during preblocking was done by drawing blood samples after the preblocking treatments were initiated but immediately before administering the radioligand.
Page 3 of 9
About 2 h before the PET scan, anesthesia was initiated with ketamine (10 mg/kg IM) and then maintained with 1% to 3% isoflurane. Electrocardiograph, body temperature, heart rate, and respiration rate were measured throughout the experiment. At baseline, the injected activity was 210 ± 51 MBq (specific activity at time of injection 43.2 ± 25.6 GBq/μmol, mass dose 6.9 ± 4.7 nmol or 0.62 ± 0.35 nmol/kg). Tissue time-activity curves were obtained from semi-automatic regions of interest encompassing the whole cerebellum and the rest of the brain. Brain uptake was expressed as standardized uptake value (SUV). Arterial input function was obtained for eight scans: four at baseline, two after blocking with nonradioactive LY2428703, one after blocking with DCPQ, and one after blocking with elacridar. Blood samples (0.5 mL each) were drawn through a port connected to the femoral artery at 15-s intervals until 2 min, followed by 1-mL samples at 3, 5, 10, 30, 60, 90, and 120 min. The plasma time-activity curve was corrected for the fraction of unchanged radioligand following the procedure detailed above. To assess the effects of blocking agents on the fP of 11 C-LY2428703, fP was measured in three monkeys both at baseline and after blockade. The first monkey was blocked with cold LY2428703 and fP was measured 2.5 min after blocker injection (which corresponds to the maximal concentration in plasma of LY2428703), and again at 40 min. The other two monkeys were blocked with DCPQ and elacridar, respectively.
Monkey studies
Four male rhesus monkeys (Macaca mulatta, 11.7 ± 2.9 kg) were imaged in 13 PET scans. Seven scans were performed at baseline, three scans were performed after receptor blocking to calculate nondisplaceable uptake (VND), and three scans were performed after blockade of the efflux transporters at the blood–brain barrier. Receptors were blocked by mixing 11C-LY2428703 with an mGluR1 antagonist - either nonradioactive LY2428703 (2.0 mg/kg) or LY2332084 (0.5 mg/kg) - in the same syringe. Efflux transporters were blocked in two scans by injecting DCPQ, which selectively blocks the efflux transporter ABCB1 (P-gp), and in one scan by injecting elacridar, which blocks both ABCB1 (P-gp) and ABCG2 (BCRP). All studies were conducted in accordance with the National Institutes of Health Guide for Care and Use of Laboratory Animals. PET scans
PET images were acquired using either the highresolution research tomograph (HRRT) or the FOCUS 220 scanner (Siemens/CPS, Knoxville, TN, USA) for 120 min in 33 frames, with frame durations ranging from 30 s to 5 min, and correcting for attenuation and scatter.
Whole-body biodistribution and radiation dosimetry
Two male rhesus monkeys (14.1 and 19.9 kg) were scanned after intravenous injection of 318 and 274 MBq of 11C-LY2428703, respectively. Dynamic two-dimensional scans were acquired on the GE Advance tomograph (GE Medical Systems, Milwaukee, WI, USA) in five bed positions of the body (head to upper thigh), with frames of increasing duration (15 s to 4 min) for a total scan time of up to 115 min. Images were analyzed by placing regions of interest on the dynamic tomographic images. Regions were drawn in identifiable source organs: brain, heart, lungs, liver, spleen, gallbladder, kidneys, lumbar vertebrae, small intestine, testes, and urinary bladder. Because the images did not include the body below mid-thigh, organ uptake was corrected for this recovery. The mean recovery of activity in the body above the thigh measured by PET was 85.6% of the injected activity measured by a dose calibrator. This recovered total activity in the body was used as the new injected activity for each scan. At each time point, the activity measured within the organs was converted into the fraction of the injected dose by dividing the organ activities by the recovered injected activity. The area under the curve (AUC) of
Zanotti-Fregonara et al. EJNMMI Research 2013, 3:47 http://www.ejnmmires.com/content/3/1/47
Page 4 of 9
each organ was calculated by the trapezoidal method until acquisition ended. The area under the curve after the acquisition of the last image (i.e., to infinity) was calculated by assuming that the decline in radioactivity after this time point occurred only via physical decay, without any further biological clearance. Residence times from the monkeys were converted into corresponding human values by multiplying with a factor to scale organ and body weights: (bm/om) × (oh/bh), where bm and bh are the body weights of monkey and human, respectively, and om and oh are the organ weights of monkey and human, respectively. Radiation absorbed doses were calculated from the residence times for each source organ. We used the model for a 70-kg adult male in the OLINDA/EXM computer program [14]. Human studies
Three healthy females participated in the study (29 ± 2-year old, 69 ± 13 kg). All were free from current medical and psychiatric illnesses, as assessed by medical history, physical examination, electrocardiogram, urinalysis including drug screening, and blood tests (complete blood count, serum chemistries, thyroid function test, and antibody screening for syphilis, HIV, and hepatitis B). The National Institutes of Health Central Nervous System Institutional Review Board approved the protocols and the consent forms. Written informed consent was obtained from all subjects. PET scans
PET images were acquired using the GE Advance scanner (GE Healthcare, Milwaukee, WI, USA) for 120 min. An 8-min 68Ge transmission scan was obtained before the injection of the radiotracer for attenuation correction. The mean injected activity was 328 ± 12 MBq. The specific activity at the time of injection was 87.2 ± 34.7 GBq/μmol, which corresponded to 5.5 ± 2.3 nmol (0.082 ± 0.037 nmol/kg) of carrier. Blood samples (1 mL each) were drawn from the radial artery at 15-s intervals until 150 s, followed by 3-mL samples at 3, 4, 6, 8, 10, 15, 20, 30, 40, and 50 min, and 4.5 mL at 60, 75, 90, and 120 min. The unchanged parent fraction in plasma and fP of 11C-LY2428703 were determined as described above.
Magnetic resonance imaging
To identify brain regions, magnetic resonance (MR) images were obtained using a 3-T GE Signa device (GE Healthcare, Milwaukee, WI, USA). T1-weighted structural images were acquired with a voxel size of 0.86 mm × 0.86 mm × 1.2 mm. The image acquisition sequences were the time of repetition (7.3 ms), echo time length (2.8 ms), and flip angle (6°).
Image analysis
The average PET image created from all frames was first coregistered to the individual MR image. Then, both MR and all PET images were spatially normalized to a standard anatomic orientation (Montreal Neurological Institute (MNI) space) based on transformation parameters from the MR images. A volume-of-interest template [15] as implemented in PMOD (PMOD Technologies Ltd, Zurich, Switzerland) was used to obtain brain timeactivity curves.
Kinetic analysis
Volumes of distribution (VT) were obtained by nonlinear compartmental analysis. Goodness-of-fit by nonlinear least squares analysis was evaluated using the Akaike Information Criterion (AIC) and Model Selection Criterion (MSC). The most appropriate model is that with the smallest AIC and the largest MSC score. Goodness-of-fit by the compartment models was compared with F statistics [16]. A value of P < 0.05 was considered significant for F statistics. The identifiability of kinetic variables was calculated as standard error obtained from the diagonal of the covariance matrix [17] and expressed as a percentage of the rate constant.
Results Saturation binding assay
Human cerebellum had a Bmax value (186 nM) higher than that of the cerebellum of rats (167 nM) and monkeys (120 nM). However, humans also had a higher KD value (11.1 nM) compared to rats and monkeys (6.6 nM for both species). Therefore, humans displayed a Bmax/KD ratio (16.9) lower than that of rats (25.3) but similar to that of monkeys (18.2) (Table 1).
Table 1 In vitro results (Bmax and KD in the cerebellar tissue and plasma free fraction) for rats, monkeys, and humans Bmax (nM)
KD (nM)
Bmax/KD
fp (%)
fp × Bmax/KD (=VS)
Rats
167 ± 24 (3)
6.6 ± 0.3 (3)
25.3
2.7a
0.683
Monkeys
120 ± 8.6 (3)
6.6 ± 0.5 (3)
18.2
0.884
0.161
Humans
186 ± 11.6 (4)*
11.0 ± 1.6 (4)
16.9
0.094
0.016
n in parentheses. *p < 0.05 monkey vs. human. Taken from [10]. a
Zanotti-Fregonara et al. EJNMMI Research 2013, 3:47 http://www.ejnmmires.com/content/3/1/47
Monkey studies Pharmacological effects 11
C-LY2428703 injection caused no significant changes in pulse, respiratory rate, or electrocardiogram. Plasma analysis
The radioligand was completely stable at room temperature in monkey whole blood and plasma. After intravenous injection, the concentration of 11C-LY2428703 peaked at 1 to 1.5 min and then declined following a curve that was well fit with a tri-exponential function. At baseline, the parent became 50% of the total plasma radioactivity between 7 and 60 min (n = 4) after injection. Two radiometabolites, less lipophilic than 11C-LY2428703, were detected with retention volume at 3.2 ± 0.7 mL and 5.2 ± 1.7 mL while the parent's retention volume was 7.2 ± 1.6 mL (n = 120). The average fp value from three baseline monkeys was 0.884 ± 0.37%. Brain images
Brain uptake was low, but the cerebellum (the region with the highest density of mGluR1s) had a visibly, though slightly, greater uptake than the rest of the brain. The peak uptake in the cerebellum was 3.1 ± 1.4 SUV at approximately 2 min and decreased to 50% of that value at about 20 min. The peak uptake in cerebellum was about 50% higher than that in forebrain (2.2 ± 0.8 SUV at approximately 2 min). However, after mGluR1 blockade, peak uptake increased, rather than decreased, both in cerebellum (4.9 ± 0.8 SUV) and in forebrain (3.6 ± 1.9 SUV). This increase was not explained by an increase in the arterial plasma input functions or by an increase of ƒp. In fact, in the monkey that underwent an mGluR1 blocked scan with nonradioactive LY2428703, fp values were lower after blockade (1.12 ± 0.18%, n = 4, at 2.5 min; and 0.89 ± 0.14%, n = 4, at 40 min) than at baseline (1.25 ± 0.12%, n = 4). Kinetic analysis
Although the receptor blocking studies showed no displaceable (i.e., no specific) binding based on peak uptake, the images were more accurately quantified using the entire scan duration and correcting for delivery of radioligand to brain, namely, compartmental modeling. Nevertheless, using a two-tissue compartment model (which showed a better goodness-of-fit than onecompartmental model), we found no evidence of specific binding based on the blockade studies. The mean VT value in the baseline scans was 3.5 ± 1.0 mL/cm3, but VND calculated from mGluR1 blocking studies was unexpectedly higher than the baseline value (4.4 ± 2.9 mL/cm3). Low brain uptake of 11C-LY2428703 was not caused by the radioligand being a substrate at the blood brain barrier for the two most prevalent ABC transporters:
Page 5 of 9
P-gp and BCRP. In fact, blocking the blood–brain barrier efflux transporters did not increase brain uptake. For DCPQ, which selectively blocks P-gp, the VT in cerebellum was 4.4 mL/cm3 at baseline and 4.2 mL/cm3 after blockade. For elacridar, which blocks both P-gp and BCRP, VT in cerebellum was 2.0 mL/cm3 at baseline and decreased to 0.8 mL/cm3 after blockade. Pharmacologic doses of these two blocking agents might have displaced radioligand bound to plasma proteins, thus indirectly increasing brain uptake, but such was not the case. In the DCPQ blocking experiments, fp was similar at baseline (1.074% ± 0.15%, n = 3) and after blockade (1.100% ± 0.04%, n = 3) scans. For the elacridar blocking experiment, where VT decreased after blocking, fp actually doubled from baseline (0.456% ± 0.05%, n = 3) to post-blockade (0.912% ± 0.05%, n = 3). Whole-body biodistribution and radiation dosimetry
Intravenous 11C-LY2428703 injection caused no significant changes in electrocardiogram, heart, or respiration rates from baseline values. 11C-LY2428703 appeared to be excreted through both urine and bile in monkey, as there was activity in the urinary bladder and transient bile in the small intestine. The liver had the highest uptake of 11C-LY2428703, with an average peak of approximately 12 SUV injected activity at about 5 min post-injection. Activity in the gallbladder progressively increased throughout the scan. The other organs exhibited a lower uptake of radioactivity, generally between 2 and 5 SUV. Radiation-absorbed doses were highest in the testes (13.7 μSv/MBq), the liver (9.9 μSv/MBq), and the heart wall (8.2 μSv/MBq). Lower doses (always less than 7 μSv/MBq) were estimated for the other organs (data not shown). The final effective dose was 5.8 μSv/MBq. Human studies Pharmacological effects
Injection of 11C-LY2428703 caused no pharmacological effects as assessed by vital signs, electrocardiogram, and laboratory testing as well as verbal reports from all three subjects. Plasma analysis
The radioligand was quite stable in vitro in whole blood at room temperature for 30 min. Tracer stability was 99.5 ± 1.1% (n = 3) in whole blood and 99.4 ± 1.4% (n = 3) in plasma. In vivo, only traces of radiometabolites were detected in plasma during the entire 2-h period of the imaging study so that the parent radioligand remained close to 99% total blood radioactivity. Human plasma samples were analyzed under chromatographic conditions where the 11C-LY2428703 was retained on the column for an even longer period of time than for
Zanotti-Fregonara et al. EJNMMI Research 2013, 3:47 http://www.ejnmmires.com/content/3/1/47
Brain images
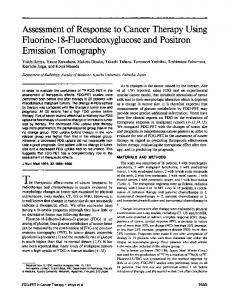
After 11C-LY2428703 injection, the brain was poorly visualized in all subjects (Figure 1), with a peak uptake of 1.14 ± 0.18 SUV that occurred at 1.3 ± 0 min after injection, followed by a gradual wash-out. Notably, the brain peak uptake occurred before the arterial peak in the radial artery, suggesting that the peak in the brain was mostly due to vascular activity. Indeed, when the brain time-activity curves were corrected for the vascular component, the peak disappeared (Figure 2). Brain activity decreased to 50% of the peak after an average of 20 min. Although a slightly higher uptake in the cerebellar cortex was observed (Figure 1), the uptake was fairly homogeneous throughout the brain. All brain activity was likely due to the parent compound, as only negligible amount of radiometabolites were detected in plasma (approximately 1% at 2 h, see above). Kinetic analysis
Although brain uptake was low, we wondered whether kinetic analysis of the brain and plasma data would suggest any specific binding in the brain. In fact, VT values
1.5
Conc radioactivity (SUV)
monkey plasma. This was done to ensure efficient separation from any potential plasma radiometabolites. This does not necessarily mean that 11C-LY2428703 was not metabolized but rather that the fate of the radiometabolites is unknown. For example, the absence of radiometabolites from human plasma might be due to organ entrapment. The concentration of 11C-LY2428703 peaked at 1.5 ± 0 min (33 ± 5 SUV) and then slowly declined following a curve that was well fit as a tri-exponential function. The parent radioactivity eluted at 6.6 ± 1.5 mL (n = 64). The ƒp levels were 0.094 ± 0.01% (n = 3).
Page 6 of 9
1.0
0.5
0.0 0
20
40
60
80
100
120
Time (min) Figure 2 Whole-brain time-activity curves without (black-filled circle, ●) and with (white-filled circle, ○) vascular correction. The measured whole blood radioactivity was used for vascular correction, assuming that blood constitutes 5% brain volume.
with 2TCM were very low (