30 International Journal of Social and Organizational Dynamics in IT, 1(1), 30-48, January-March 2011
3D Virtual Worlds:
Assessing the Experience and Informing Design Sean P. Goggins, Drexel University, USA Matthew Schmidt, University of Missouri, USA Jesus Guajardo, University of Texas Health Science Center, San Antonio, USA Joi L. Moore, University of Missouri, USA
ABSTRACT Teams meet in 3D virtual worlds more frequently than ever before, yet the tools for evaluating 3D collaboration environments are underdeveloped. To close the 3D collaboration tool evaluation gap, the authors integrate lessons from the gaming industry and distributed work research. They develop two complementary approaches. First, the individual user’s perspective using eye-tracking (ET) is addressed, and second, the collaborative experience of the group using a technique called All-Views-Qualitative-Analysis (AVQA) is evaluated. The latter integrates the points-of-view of all subjects in a small group collaborating on a creative work task in a 3 dimensional virtual world. The authors show how these techniques enable evaluation of 3D environment design from the perspective of human computer interaction theory and theories related to distributed work. The paper discusses why designers should seek ways to leverage the advantages of 3D collaboration technologies and avoid recreating mirrors of physical space in these environments. Keywords:
3D, AVQA, Collaborative Work, CSCW, Eye Tracking, IT Design, User Experience
INTRODUCTION Over one billion hours of collaborative play have been logged in the game Halo (Grossman, 2007). Put into easily understood commercial terms, that’s about 526,315 person years of work effort; or the entire population of Ljubljana, Slovenia playing Halo instead of going to work, school or anywhere else during the day for an entire year. This milestone underscores the increasDOI: 10.4018/ijsodit.2011010103
ing acceptance of virtual worlds as legitimate, compelling places for humans to interact with one another, making it likely that 3D interaction technologies will be adopted beyond the realm of play. In fact, there is evidence that 3D virtual worlds are becoming a prominent framework for human-computer interaction (HCI) to support distributed, collaborative work (Kaptelinin & Czerwinski, 2007). Much of what is known about HCI in 3D emerges from the study of video games. Qualitative studies of how gamers experience
Copyright © 2011, IGI Global. Copying or distributing in print or electronic forms without written permission of IGI Global is prohibited.
International Journal of Social and Organizational Dynamics in IT, 1(1), 30-48, January-March 2011 31
virtual worlds show that new games are adopted faster if they follow familiar interaction styles (Clarke & Duimering, 2006), and that game play sometimes leads to a new category of virtual community (Nardi & Harris, 2006). These studies provide preliminary guidance for HCI designers searching for new metaphors that might support deeper engagement in collaborative work among geographically dispersed groups (Carroll, 2003; Dyck, Pinelle, Brown, & Gutwin, 2003; Rapeepisarn, Wong, Fung, & Depickere, 2006). Designing software for distributed group work is recognized as a wicked problem with many challenging dimensions (Fitzpatrick, 1998). Grudin (1994) identified eight of the most significant challenges of designing software for collaborative work. Each of Grudin’s eight challenges takes a slightly different form as technology changes. In this paper, we specifically address one of Grudin’s eight challenges for the 3D generation of collaboration technologies: Evaluation. Before explaining how evaluation of 3D environments might be different than evaluation of other types of collaborative work systems, we need to understand how users experience 3D collaboration differently. Dyck et al.’s (2003) analyses of gaming as an interaction metaphor reveals the core dimensions of effortless community, learning by watching, deep customizability and fluid system-human interaction. These dimensions of 3D games present an opportunity for 3D collaboration software designers to transfer ideas from gaming (Rapeepisarn et al., 2006). Wrapped up with this opportunity are challenges to long accepted heuristics for interface design, including simplicity, consistency & ease of use for all users. Dyck et al (2003) describe how these accepted HCI design heuristics do not transfer to 3D interaction design. HCI convention is further undermined by evidence that gamers enjoy learning a game quickly but then wish for it to become more difficult as they advance through different stages. Gaming style interactions like those encountered in 3D environments are more compelling than conventional windowing
systems (Paiva et al., 2002; Larson, 2007) and could form the basis for more engaging and productive HCI. The evaluation heuristics that we communicate to designers of these types of systems must, then, necessarily reflect both the fundamental differences and potential advantages of 3D collaboration. First, we must make a critical distinction between 3D virtual worlds and games: In the 3D environments tuned for work, collaboration is measured by creative output and group efficacy, not by a body count or other discrete score. One of the premises underlying the work presented here is that while the HCI community might learn from the example of game developers, building worlds to support creative collaboration is distinct from the challenge of creating a really great first person shooter (FPS) game. While the gaming community knows what works (Crawford, 1982; Rollings & Adams, 2003), the development and evaluation of collaborative 3D environments are in a more formative state. There are a few aspects of 3D games that are salient to 3D interaction more generally and not tightly coupled to gaming interaction. First, interaction in 3D environments is more immersive, includes interactions with avatars and other social-emotional representations of people, and follows a set of interaction metaphors that have no corollary in traditional user interfaces. Each 3D environment embeds some combination of its own navigational scheme and existing conventions for movement, like the WASD buttons on a QWERTY keyboard (used for walking around and setting direction of a user within the world). Second, emotion is a more prevalent dimension in 3D interaction, the frequently lampooned legacy of Microsoft’s Bob in HCI notwithstanding (Linnett, Fries Duvall, & Powelson, 1997). Avatars add emotional dimension to interaction in 3D spaces that is not present in conventional user interfaces designed to support collaborative work. Our evaluation design, then, must make sense of how users adapt to new types of interactions associated with the first aspect, and new types of collaboration associated with the second aspect of 3D environments.
Copyright © 2011, IGI Global. Copying or distributing in print or electronic forms without written permission of IGI Global is prohibited.
32 International Journal of Social and Organizational Dynamics in IT, 1(1), 30-48, January-March 2011
In order to learn more about navigation and user experience in 3D environments, we set out to define an evaluation protocol for capturing and analyzing both the paths of individual user adaptation to 3D tools, and the patterns of group adoption of these kinds of tools. We choose eyetracking (ET) technology to capture the nuances of how users make sense of avatar controls and interaction strategies in 3D environments because ET captures information at the 1/16th of a second level of detail, and makes it clear what users are attending to while navigating this new world. While insightful at the individual level of interaction analysis, ET is insufficient for building a comprehensive understanding of group interactions in 3D virtual worlds. This leads us to develop a complementary method for assessing 3D virtual world interactions through the integration of remote screen recording and formal usability lab observation of subjects, which we describe as the all-views-qualitativeanalysis (AVQA) method. Next we examine the foundations of eye tracking as an HCI evaluation method. We then describe how eye-tracking data is captured and analyzed. This is followed by a description of how this type of data capture might be applied to the evaluation of user experience in a 3D environment.
EYE TRACKING TECHNOLOGY Duchowski (2002) reviews the development and application of eye-tracking technology over the past 40 years, outlining historical phases in the fields of cognitive psychology, industrial engineering, neuroscience and computer science (HCI). The central value of eye-tracking is based on what Just and Carpenter (1980) and others call the eye-mind hypothesis, which states that the location of a person’s gaze directly corresponds to the most immediate thought in a person’s mind. Early eye-tracking research is centered in cognitive psychology and neuroscience. Duchowski (2002) describes the present era in eye-tracking as interactive, with the most recent preceding era characterized as diagnostic.
The key differentiation between these two eras is how eye-tracking technology is applied. In the diagnostic era, eye tracking is focused on understanding what a user is viewing. In the interactive era, eye-tracking technology becomes an aspect of user input. In both eras, eye-tracking application in the fields of industrial engineering and HCI increases (Duchowski, 2002). In the context of interactions in windowed, 2D spaces, the sequential framing of these eras is supported in the literature. However, the use of eye-tracking to refine 3D interactions either diagnostically or interactively remains practically unexamined and potentially quite fruitful.
Capturing Eye-Tracking Data There are two primary eye-tracking technology architectures, fovea-based and non-foveabased. The fovea is a part of the eye that can be tracked to indicate where a person is looking. Fovea-based eye-tracking uses special equipment in a laboratory setting to monitor where a user is looking. Fovea tracking can be conducted with or without a head mounted device. Head mounted fovea-trackers are less expensive and more precise, but require the user to attach a cyborg-like device to their head. The drawback of both types of fovea tracking systems is that they require a laboratory environment, limiting insight into how user gaze is influenced by their natural environment. Non-fovea-based eye-tracking systems take a variety of approaches, and most have been designed with the intention of overcoming either the cost or lab-based limitations of fovea-based eye-tracking systems. Mousetracks (Arroyo, Selker, & Willy, 2006) captures mouse movement over an interface, with the expectation that user gaze follows the cursor. In a sense, this extends the eye-mind hypothesis into an eyemind-mouse hypothesis. Another non-foveabased eye-tracker is Tarasewich and Fillion’s (2004) enhanced restricted focus viewer, which achieves results similar to those of a full eyetracking apparatus by blurring most of a user interface, rendering only a small section of the screen visible. This visible section is control-
Copyright © 2011, IGI Global. Copying or distributing in print or electronic forms without written permission of IGI Global is prohibited.
International Journal of Social and Organizational Dynamics in IT, 1(1), 30-48, January-March 2011 33
lable by a user through a mouse or comparable pointing device. Li, Babcock, and Parkhurst (2006) developed a head-mounted eye-tracking apparatus from commodity hardware, in effect tackling the cost challenge of fovea-based eye tracking by open-sourcing the capture of gaze information. This accomplishment may signal the imminent commoditization of fovea-based eye-tracking technologies. It may also signal a decline in the exploration of non-fovea-based eye tracking, which is less authentic and less precise. Eye-tracking to examine windowed applications advances understanding of how systems are learned and used, especially when traditional HCI evaluation methods do not reveal important shortcomings. For example, standard HCI evaluation methods do not account for user efficiency with a system when time is of the essence (emergency response applications, for example) or adequately explain user confusion or scenario failure (Karn, Ellis, & Juliano, 1999). Users new to 3D environments often encounter difficulty (Moore, Gathman, Ducheneaut, & Nickell, 2007). We suggest that knowledge of how users adapt and learn to use 3D environments will be enhanced by the use of eye tracking as an evaluation tool.
Eye-Tracking Data Analysis There are two primary views on how to analyze eye-tracking data, and how this information may be most useful for understanding user interactions with a computer system. The first view is that fixations and saccades reveal the most compelling explanation of how a user is experiencing a system (Karn et al., 1999; Karn, 2006). A fixation is a place where the user stares for a specified period of time. A saccade occurs when a user’s gaze is moving from place to place in an interface. As might be expected, the distinction between fixation and saccade becomes more controversial with slower eye movements. The question “when does a fixation become a saccade?” continues to be a subject of debate in the eye-tracking research community (Salvucci & Goldberg,
2000). In a study of stroke patients, Müri et al. (2009) devised a taxonomy of fixation and saccade that included an intermediate concept they call foveation, which they define as rapid eye movements in a small visual field. These are distinguished from saccades in their research by the understanding that during sweeping saccades little visual input is processed by the brain, but during foveation, the brain processes significant visual input. The second view of how to interpret and apply eye-tracking information is reviewing areas of interest (AOI) in the data. The AOI approach focuses on the density of total time spent in a particular area. The distinction between a fixation and a saccade is less critical than knowing where a user spends most of their time. Almost all analysis of eye tracking data falls into one of these two camps. A number of studies argue that analyzing areas of interest provides as much insight for many tasks as analysis that distinguishes between fixations and saccades (Goldberg, Stimson, Lewenstein, Scott, & Wichansky, 2002; Santella & DeCarlo, 2004; Guan, Lee, Cuddihy, & Ramey, 2006). Other studies (West et al., 2006) find critical information present in the distinction between fixations and saccades, in some cases valuing the simpler, coarser but related concept of scanpaths, which are the heavily traveled visual roads between two points. As eye-tracking technology is applied to an increasing variety of Human Computer Interaction questions, ranging from web information usage (Cutrell & Zhiwei, 2007) to visual search (Byrne, 2001), we expect eye tracking data analysis methods to be distinguished by the types of questions they help us to answer.
EYE TRACKING AND 3D WORLDS Eye tracking is an evaluation method that will help 3D environment designers understand what parts of the rich interface a user is attending to during use. One of the key distinctions between a 3D environment and a windowed system is
Copyright © 2011, IGI Global. Copying or distributing in print or electronic forms without written permission of IGI Global is prohibited.
34 International Journal of Social and Organizational Dynamics in IT, 1(1), 30-48, January-March 2011
the presence of avatars and characters, which display emotional cues that are interpreted and acted upon by subjects. If these worlds are to be extended beyond applications focused on play, knowledge of the specific avatar characteristics attended to by subjects will aid designers. Further, consideration of how collaboration, idea sharing and innovation are best facilitated demands designer and researcher attention to what system users pay attention to during system use. Avatars and fine-grained controls are aspects of 3D interaction that eye-tracking technologies directly address. Blascovich et al. (2001) suggest that anthropomorphized avatars – those who subjects earnestly believe represent another human being – have a higher degree of social presence than agent-avatars and as a result are more likely to induce authentic social influence effects in a collaborative virtual environment. There is an interaction between the nature or importance of this belief about the avatar’s social presence, and the realism of the avatar’s representation. In general, the social presence of the avatar is positively influenced if it is identifiably a “human-avatar” (the user or subject knows the avatar is controlled by another human). As a result, the behavioral realism of the on screen representation can be low and still result in an authentic social interaction. By contrast, if the avatar is perceived as being agent driven instead of representative of a human, the behavioral realism of the representation must be higher in order for social influence effects to occur. Blascovich’s theory suggests two important ideas to 3D environment designers. First, it suggests that low quality avatars may be sufficient if the subjects know that the avatars are representations of real people. Second, realistic avatars may not require the locus of control for the avatar to be “human”. Therefore, improvements in the efficacy of virtual environments for fostering social interaction may be possible through either an increase in the identifiably human nature of the avatars, which can be established through human like dialogue or through an increase in the realism of the avatars representation of the human form.
Better graphics are not necessarily the answer to better 3D collaboration tools. Perhaps more significantly, if the attention of 3D environment designers is turned toward collaboration and knowledge creation, fine-grained study of what subjects focus on in these contexts may reveal starkly different design characteristics for collaboration and knowledge creation than for gaming. Our study experiments with, refines and extrapolates methods for examining the relative importance of social presence and avatar realism in 3D environment interaction. Human attention to others, and the choice of whom to and how to interact in the world is powerfully affected by emotions, and emotional expectations of users (Wadlinger & Isaacowitz, 2006). Facial features that people attend to when discerning the emotional state of others are well established in the literature. The importance of facially expressed emotion compels the development of a method for applying eye-tracking technology to the evaluation of 3D collaboration environments. Our protocol integrates the importance of emotion into the eye-tracking experiment. We ask subjects to distinguish emotional states in human faces and avatars while eye-tracking data is captured. Next, we integrate ideas from previous work like Mousetracks and the enhanced restricted focus viewer to discern what users are attending to in a virtual environment with traditional usability lab protocols. Knowing what individual users are attending to while participating in a 3D environment helps designers evaluate user controls. Increasing social and task oriented interactions in a 3D environment requires the study of multiple users in the environment at once. To ensure we evaluate both individual user interactions and collaborative work processes as they occur in a 3D environment, we developed a method we refer to as all-view-qualitative-analysis (AVQA). This method is distinguished by its integration of multiple user views, recorded from sessions of group work in 3D collaborative environments. The remainder of this paper is organized as follows. First, two experiments where we cap-
Copyright © 2011, IGI Global. Copying or distributing in print or electronic forms without written permission of IGI Global is prohibited.
International Journal of Social and Organizational Dynamics in IT, 1(1), 30-48, January-March 2011 35
ture eye-tracking information from subjects are described. Second, we describe the results from those experiments. Third, we discuss the results and provide a generalized method and toolset for consistently analyzing 3D environments using heat maps. Fourth, we describe the AVQA method, and insights gathered from our pilot studies. Lastly, we articulate a research agenda for the continued development of technologies for understanding human-avatar interaction in 3D environments.
EXPERIMENT Eye-Tracking Apparatus For the eye-tracking component of our method, subjects were seated in a desk chair in front of a computer screen with eye-tracking software configured. The eye tracking equipment used was an ASL R6 with VHT (video head tracking). Eye movements were recorded using this equipment, which was located in a human-computer interaction usability lab at a large university. The ASL R6 was selected over other eye-tracking technologies because it does not require a head mounted display.
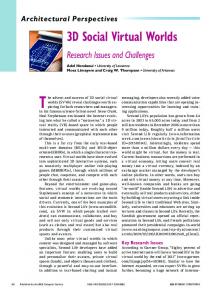
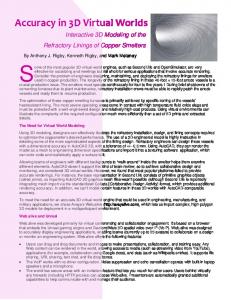
Stimulus Material The facial expressions and animated avatars used in the eye-tracking part of our study were selected because they each present distinct, emotional states. For this study, images used as stimulus material included pictures of real human faces and dynamic avatars that were obtained from http://www.dotolearn.com. To operationalize our protocol, a PowerPoint presentation was created displaying: a.) six faces of a man showing different emotional status (Figure 1), b.) six faces of a woman showing different emotional status, c.) an animated avatar exhibiting different emotions (Figure 2).
Protocol Design Subjects in this study are not provided with any incentives, time constraints or other external
motivation for performance. Working with eye-tracking lab equipment in virtual environments like those we are studying was viewed as compelling by subjects, and recruitment was based on this intrinsic interest. All subjects were provided with a description of the study context, and their role in it as outlined in the protocol. A researcher provided instructions and walked the subjects through an initial example of the first of two protocol components. The first protocol component included a set of static images that were numbered 1 to 6. Each of the pages had six individual faces with different emotions on each face. There were two sets of face-image pages, one with a male face, and the other with a female face. The male version is shown in figure one. The second part of the protocol involved interacting with an animated avatar, and the subsequent identification of the appropriate emotion being displayed by the animated avatar (the avatar we used to display fear is shown in Figure 2). The limitations of the printed page prevent our inclusion of the animated version here. There are two phases to our study. In the first phase, we are focused on refining our use of eye tracking for the study of 3D environments. In the second phase, our focus is the development of our AVQA methodology. We present our phase one results in several stages, below. Followed by phase 2 results.
PHASE ONE RESULTS Seven individuals participated in studies of our eye tracking protocol. The subjects included three females (one Caucasian, one African American and one Asian) and four males (three Caucasian and one Hispanic) ranging in age from 27 to 48. The first five yielded substantial preliminary data using a think-aloud protocol common to usability studies (Carroll, 2003). The findings from these data enable us to refine our methods for capturing further data using eye-tracking equipment. Having refined our protocols and analysis mechanisms, we
Copyright © 2011, IGI Global. Copying or distributing in print or electronic forms without written permission of IGI Global is prohibited.
36 International Journal of Social and Organizational Dynamics in IT, 1(1), 30-48, January-March 2011
Figure 1. Emotionally expressive faces
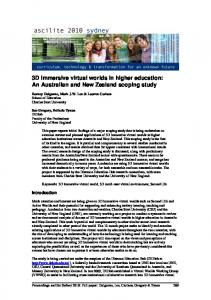
perform extended eye tracking data analysis on the final two subjects’ experiences with our virtual environment, yielding compelling results and a repeatable method. It is noteworthy that two of the seven subjects had difficulty correctly identifying the emotions present in the static images, although all subjects correctly identified emotions represented by the animated avatar. Results were gleaned from the analysis of eye tracking data captured while subjects went through the protocol. Data representing the X and Y coordinates of the subjects’ gaze on a screen were obtained from the subjects using the ASL R6 eye tracking apparatus. A simple representation of the data in graph format (scatter plot) is shown in figure three and figure four. These scatter plots show a single data point for each instance of gaze location captured by the equipment. High X, Y coordinates, for example, are representative of the subject looking in the upper right-hand corner of the screen, low X, Y coordinates are representative of the subject looking in the lower left-hand corner of the screen. Graphs were created from the two sessions for each subject. Figure 3 and Figure 4 are examples from one session using the static image protocol for two different subjects. One can quickly detect that each subject is scanning a series of equidistant objects, ultimately settling on one or two. This is notable because it represents an identifiable
pattern of gaze behavior and demonstrates that the equipment accurately captures evidence of the subjects’gaze patterns. The distinguishing nature of the gaze pattern when the subject is scanning static images is emphasized when compared to data from the animated avatar sessions, which show a clearly different scanning pattern in the case of subject B, and a nominally different scanning pattern in the case of subject A. Achieving our goal of integrating eyetracking information with virtual environments required the addition of an image overlay to the representations of data from subjects A and B. This overlay brings the context of the subjects’ gaze into focus. Noting the X, Y coordinates of the image on the screen, calibrated for each subject, and then aligning the image with those coordinates results in the overlays below. This is accomplished by placing a scatter plot graphic over a photographic image used in the study. The two graphics were calibrated to be the same size, and coordinates 0, 0 and 300,300 in perfect alignment, resulting in pixel-perfect accuracy, as shown in the overlays in Figure 5 and Figure 6. Reviewing the images side by side for each of the subjects analyzed in this manner reveals both similarity and difference in the gaze patterns among subjects. The overlays reveal which aspects of the photos were attended to, but they do not provide the fine-grained cues needed to
Copyright © 2011, IGI Global. Copying or distributing in print or electronic forms without written permission of IGI Global is prohibited.
International Journal of Social and Organizational Dynamics in IT, 1(1), 30-48, January-March 2011 37
Figure 2. Animated, 3 dimensional avatar representing fear
Figure 3. Subject A, avatar data
distinguish intensity of gaze in particular locations. To accomplish that, we analyzed the data using an open source heat mapping tool, initially intended for website usability, called “Clickheat” (http://www.labsmedia.com/clickheat/index.html). When we added the eye tracking data as heat map overlays to our static images using 640x480 resolution, the heat maps were nearly perfectly aligned with the static images, with a skewing of the data in toward the center from the edges, which we were able to correct for in Figure 7 and Figure 8.
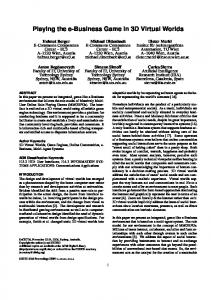
Eye-Tracking Over Moving Pictures (Avatars) For the animated avatars, we conducted similar heat map analysis, and produced an animated data analysis that allowed researchers to follow the gaze in context. Figure 9 shows a static image of that analysis tool. Note the use of the heat map discussed in the static section, combined with animated black cross-hairs played for each 1/16th second of gaze from the user in Figure nine. By dynamically illustrating AOI and fixation-saccade data
Copyright © 2011, IGI Global. Copying or distributing in print or electronic forms without written permission of IGI Global is prohibited.
38 International Journal of Social and Organizational Dynamics in IT, 1(1), 30-48, January-March 2011
Figure 4. Subject B, avatar data
in this interface, we establish a repeatable protocol for capturing, analyzing and understanding gaze behavior in 3D collaborative environments. We later apply the exact same protocol, using the avatars illustrated earlier, to perform ET data analysis in a dynamic environment. The result is a repeatable process for understanding where users look when interacting with avatars in 3D collaborative environments.
METHOD FOR HEAT MAP ANALYSIS Heat maps provide a powerful and intuitive way to graphically visualize gaze data. Typically, these visualizations are represented using the color red for drawing attention to areas that are intensely observed and the color blue for less-intensely observed areas. The longer a user gazes at a given area, the warmer the color in that area becomes. Areas that are not observed are represented using white (and sometimes black or even no color at all). To draw an analogy, just as peaks are represented in red and valleys in blue on topographical maps, so also is the intensity of gaze represented in heat maps.
Plotting eye-tracking data on a graph enables the researcher to observe all eye tracking data points simultaneously, but does not provide a context for interpreting these data. Nonetheless, because these scatter plots are derived mathematically and the results can be replicated, the researcher can have confidence that these scatter plots provide a true representation of the underlying data. A simple way to provide context to these scatter plots is to overlay them onto the images that were used in the study; however, such images do not provide as clear of an analysis as the heat maps. Our challenge, then, is to devise a method of analysis using heat maps that we can prove to be as aligned with a ground truth about focus areas as the scatterplots. Principal to meeting this challenge is our ability to pixel-perfectly align our heat maps to our mathematically proven scatter plots. First, we use linear transformations to convert the raw data provided by the eye tracking apparatus into X and Y coordinate data that correspond to a resolution of 640x480 pixels. Next, we feed the data into our heat map creation software. Third, we analyze the initial output, which shows a 35 pixel skew. Fourth, we correct for this skew using linear transformations that resize
Copyright © 2011, IGI Global. Copying or distributing in print or electronic forms without written permission of IGI Global is prohibited.
International Journal of Social and Organizational Dynamics in IT, 1(1), 30-48, January-March 2011 39
Figure 5. Participant A, static image 2 scatter plot overlay
Figure 6. Participant B, static image 1 scatter plot overlay
the output. Fifth, we have produced heat maps as semi-transparent overlays on the experiment images. Comparison of these heat maps with scatter plots show perfect correlation across all of our subjects. Finally, the production of heat maps, with integrated tracking data over dynamic avatars provide a combination of AOI analysis and saccade fixation analysis required for more focused examination of interaction in 3D virtual environments.
EYE-TRACKING ANALYSIS AND THE DAWN OF ALL VIEWS QUALITATIVE ANALYSIS The adaptation of eye-tracking technologies for the analysis of interaction in 3D environments provides analysts and researchers with evidence of what individual users in these environments attend to. As we hoped, these methods are useful for identifying where user errors in 3D
Copyright © 2011, IGI Global. Copying or distributing in print or electronic forms without written permission of IGI Global is prohibited.
40 International Journal of Social and Organizational Dynamics in IT, 1(1), 30-48, January-March 2011
collaborative environments occur, and provide important clues that inform theorizing about the range of correct design responses. However, our studies show that this data is insufficient for understanding and explaining interactions between subjects in 3D environments. To close that gap, we proceed to develop a multi-threaded approach to analyzing user interaction in 3D environments. In this method a small group of users come together to complete a simple, collaborative task while we capture the interaction from each individual’s point of view. Next, we analyze the resulting data and use it to inform our discussion of 3D environment design.
Studies of Novices in Virtual Worlds To explore how novices might adapt 3D environments for a collaborative work task, we study groups using an online environment based on Croquet (Consortium, 2007), while they perform a work task that involves the synthesis of multiple, related artifacts into a single, final version. We record the sessions from the point of view of three different subjects, observing one of the subjects in the usability lab at our university. Our method includes the installation of dynamic screen recording software on the local computers of two remote subjects. In each study, a third subject joins the group from our usability lab, which is equipped with a two monitor system, audio recording, facial expression recording, key stroke tracking and other features available in the usability evaluation software package, Morae1. We observe a total of five groups performing identical tasks in the same 3D collaboration. We stopped at the fifth group after obtaining few new insights from groups four and five, indicating saturation of our data for this study. Our method is designed to capture user navigation and interaction from the point of view of each subject in a 3D environment. We then integrate this data with field notes, interviews and participant reflections to triangulate the experience of interacting with a collabora-
tive group in a 3D environment. The data we glean from our distributed, multi-participant recordings enable us to observe where users navigate to and where they direct their avatars from the point of view of each user of the system. Next, we integrate and correlate these images with each other. In AVQA, we also look at the same session in a 3D environment from each participant’s point of view. This is conceptually similar to observing a sporting event from multiple camera angles at the same time. All of the sessions last between 1.5 and 2 hours. Our analysis includes annotation of four panels of recorded video from the 3D environment, using Anvil2. Our annotations are combined with field notes, participant reflections and interview transcripts and analyzed using line by line coding in the grounded theory tradition.
PHASE TWO RESULTS When initially introduced to the 3D environment, users interact with each other playfully, learning to jump, move around, and drag documents in and out of the environment. Our additional findings emerge from two general observations of common engagement behavior across groups. First, the chat tool, which is integrated in the 3D environment, is the primary means of communication between subjects. This is observed in the lab, and in analysis of screen recordings by distributed 3D environment collaborators in our study. Second, three out of the five group members who participated in the laboratory role during our study broke out a laptop in order to open an additional communication channel. This behavior suggests that the high degree of social presence afforded by the 3D environment supports interaction and a desire to interact which the 3D environment itself was unable to provide. The tools brought up on the second computer by users in the lab included the course management system shared by students in the class, as well as Google Documents that the groups used to share information. This use
Copyright © 2011, IGI Global. Copying or distributing in print or electronic forms without written permission of IGI Global is prohibited.
International Journal of Social and Organizational Dynamics in IT, 1(1), 30-48, January-March 2011 41
Figure 7. Participant A, static heat map 1
Figure 8. Participant B, static heat map 1
of a second computer is not something we staged; it is something we did not anticipate or guard against, but which results in a rare chance to observe authentic user behavior in a laboratory setting. Our observations of interactions between users, undertaken both ‘live’ and from the side by side comparison of simultaneous session recordings, reveal four primary patterns:
1. Group formation appears similar to that experienced in the real-world. 2. Novices bring social cues with them from the physical world. 3. 3D environment collaborators are usually engaged in multiple simultaneous activities. 4. Environment use declines following group formation.
Copyright © 2011, IGI Global. Copying or distributing in print or electronic forms without written permission of IGI Global is prohibited.
42 International Journal of Social and Organizational Dynamics in IT, 1(1), 30-48, January-March 2011
Group Formation Like groups placed together in a physical setting, the absence of clear boundaries and well understood organizational structure lead to initial group formation phases described by Tuckman (1965) as ‘storming, forming, norming’, although in the 3D virtual environment these phases are a playful type of interaction, even during the “storming” phase. Of course, theories of group development and collaboration have come a long way since Tuckman. Finholt and Sproull (1990) describe how groups emerge through email distribution lists, characterizing unique forms of influence and identity formation that take place in electronic groups. Keisler and Cummings (2002) provide a thorough review of what we know about distributed work through 40 years of research. In it, they note that people are more likely to be social, comply with and interact with people are who physically near them. These phenomena appear to generalize to shared social settings, in the tradition of ecological views of group work. Our observation of the groups in our 3D environment suggests that this environment is experienced as a shared social setting in the same sense that Keisler and Cummings described. Groups form and interact in our 3D environment as though they are in physical space. They do not experience the same degree of extended negotiation around technology or the new experience as described in studies of distributed groups brought together with asynchronous tools (Finholt & Sproull, 1990; Goggins, Laffey, & Tsai, 2007). The group formation sequences occur quickly in the virtual environment and task combination that comprise our study, especially by comparison with similar activities among physically collocated groups. This is consistent with past findings of game designers and researchers. First, our groups experiment with the environment for between 11 and 15 minutes. The groups are led into more structured activities by the first member to take initiative toward the assigned task. Other members follow. Analysis of the group experiences through annotation of each user’s perspective, side by side with
other user’s perspectives, shows that most users focus on the artifacts (text documents, word processing documents, web pages, pictures and presentations) on the walls in the virtual world, and then, only later, focus on their final work products. Text chat is the dominant coordination technology during this period. The open space of the environment is a factor in creating an increased sense of social presence. Khan (all subject names are pseudonyms), a member of group one, says he feels more comfortable and open with his group in the 3D environment because he is able to interact with them visually, and ‘see’ what other members were doing. Being in a space with group members increases the social interaction compared with text chat. Gestures, such as approaching other members and gathering together around an object that represents the group’s purpose are both factors reported by our subjects to heighten their experience of being in a group online. Subjects uniformly describe these features of the 3D environment as helping group formation, but providing limited support for the completion of work.
Social Cues Our subjects pay attention to virtual equivalents of social cues and norms that are common in the physical world. While these experiences increase the sense of social presence our subjects describe, it impedes discovery, the reading of shared artifacts and ultimately the efficient completion of work in the 3D environment. For example, subjects do not move their avatars in front of or close to another avatar when reviewing shared material. Khan reported “I did not want to get in Steven’s way. So, I dragged the document to my desktop to read it, and then copied my changes into the online version once Steven was done”. Reflecting on the same events, Steven reports that he is waiting for Khan to contribute, and somewhat frustrated by the lack of engagement in the virtual world at first. Khan experiences the collaboration in the virtual world as ‘invading [Steven’s] personal space’. The result is that obedience to physical
Copyright © 2011, IGI Global. Copying or distributing in print or electronic forms without written permission of IGI Global is prohibited.
International Journal of Social and Organizational Dynamics in IT, 1(1), 30-48, January-March 2011 43
Figure 9. Animated cursor following eye-tracking data points over time
world metaphors limits the potential advantages of the 3D collaborative environment. Social customs carried over from the physical world lead to a muting or reversal of the advantages of social presence experienced in 3D environments. We respect personal space around our fellows in the physical world as a matter of culture, tradition and personal comfort. Carrying these traditions into the virtual world does not serve a function, and suggests that the physical metaphor of this 3D environment provokes customs from the physical world that serve no purpose in the environment. This translation of physical traditions to the 3D environment in our study is “natural” according to our informants. In the fourth group, after observing this behavior consistently, we ask our subjects why they thought they respected personal space in the 3D environment in the same way they respect personal space in the physical world. Responses varied from, “I did not think about the difference, I just tried to get to know my team mates” to “That’s a really good question; I think it’s because I saw myself and I saw my group members and I didn’t want to … get in the way or be rude”. Whether an outcome of reflection or an operationalized behavior translated to virtual
space, this consistent experience by members of our groups suggests something important about 3D environments. The use of avatars and representations of space modeled after the physical world may place an artificial ceiling on the quality of collaboration in 3D environments. Virtual interaction is guided by physical traditions in this case. Although the 3D environment we study enables members to gather around an object, their compliance with social cues from the physical world prevent this. Our 3D environment, modeled after physical space, has advantages for creating a sense of social presence, but disadvantages for completion of work.
Multiple Simultaneous Activities In our lab, Khan used the monitor on the Morae equipped station, as well as his own laptop for participation in the group. Lucy, another subject in the lab during a different group session, restricted her work to a single monitor, but nonetheless frequently referred to her notes, and “slipped out” of the 3D environment to check assignments and status in an online discussion board. The world itself, engaged in from the lab computers, served as an instrument or mode of communication. Information seeking, note
Copyright © 2011, IGI Global. Copying or distributing in print or electronic forms without written permission of IGI Global is prohibited.
44 International Journal of Social and Organizational Dynamics in IT, 1(1), 30-48, January-March 2011
taking and assimilation of shared knowledge occurred either by jumping out of the 3D environment completely, or by turning away from the environment to another computer, as in the case of Khan’s laptop. Simply put, the collaborative world provided by the software makers is not the totality of the knowledge creation and innovation for groups in these environments. Distinct from a gaming context, the subjects we observed are not immersed in the 3D environment they use to collaborate. Creative activity, unlike gaming, appears to support the ‘in and out’ nature of these engagements.
Decline in Environment Use Over Time Three dimensional virtual worlds prove useful to our subjects as a social, “group formation” place at the beginning of a creative collaboration, but become less central to the joint endeavor as creative work progresses. Our observation across sessions is that the distributed teams build an identity and a shared understanding of the problem within the virtual world, but move fluidly in and out of it as creative work (in this case the construction of a course design document) increases. In the case of Khan’s group, while members are willing subjects in our study of the 3D environment, and actually design their collaborative work product to incorporate it as a central mechanism for learning (describing at one point their team ‘jumping together in collaborative ecstasy’), they never do return to it for collaboration after the initial creative session. Instead, they rely on easier to coordinate, asynchronous means for collaboration, such as discussion boards, shared editors (wiki spaces, etc.) and archived chat. For ongoing work, 3D environments appear to simply be too much work for too little return.
THE EMERGENCE OF A METHOD In this study we set out to devise a method for evaluating technology mediated collaborative work in 3D environments. This addresses
one of the eight challenges of designing for collaborative work (Grudin, 1994) for the 3D era. Working iteratively through laboratory and laboratory-field integrated studies; we capture and describe the experiences of engagement among team members through 3D environments. Our subjects perform creative tasks in a virtual environment; we develop a protocol that can be used to continue the study of 3D environments for distributed work, and to inform the design of future 3D environments. The protocol we define here includes the use of Camtasia studio for screen recording on Windows (and now MAC) based PCs3. Users login to the system after starting the screen recording software, and we make a clock available as the first shared object in the workspace. Through these simple devices, we are able to synchronize and analyze sessions to understand how groups behave, how they interact and ultimately to determine the nature of 3D environment enhanced collaboration. Detailed, minute-by-minute annotation of each session is then compared across sessions, and specific types of interactions are noted and analyzed at varying depths, depending upon the research question. The four primary types of virtual engagement between avatars observed in our pilot study included: 1. Playful engagement, like jumping around. 2. Shared engagement around an artifact. 3. Disengagement or isolation (walking around and exploring the space independently). 4. Chat engagement. There are a very limited number of ‘face to face’ engagements between avatars in the collaborative space we studied. This could be a side effect of the task, or possibly a more general discovery. Another important limitation to note is that users in our study are clearly engaged in other activities that are not captured by our screen recording software. For example, when our lab users break out their laptops and being working on shared documents outside the 3D environment, we have an indication of the
Copyright © 2011, IGI Global. Copying or distributing in print or electronic forms without written permission of IGI Global is prohibited.
International Journal of Social and Organizational Dynamics in IT, 1(1), 30-48, January-March 2011 45
collaboration, but not the social (or non-social engagement). This limitation in our analysis is nonetheless helpful for researchers and designers seeking to inform future 3D environment designs for information systems, collaboration or other forms of distributed work.
IMPLICATIONS FOR DESIGN Designing 3D collaboration environments creates a new set of challenges. First, the individual user experience comes with different demands and expectations than a 2D windowed environment. We address this through our eyetracking protocol. Second, collaboration in 3D spaces occurs near the intersection of gaming, face to face interaction and previous studies of technology mediated groups. Together, these two methods show designers how the individual participants interact with the tools, and also how the individual participants interact through the tools. Previous, independent instantiations of these analyses methods are separately useful for usability evaluation. Together, these methods provide a complete evaluation toolkit that enables designers to co-evolve the tools, and interactions within tools as they design next generation socio-technical systems. This study suggests that the design of collaborative 3D environments must move in a different direction than game design. Having 3 dimensions does not necessitate the use of metaphors from the physical world. For example, text chat is the dominant coordination tool, subjects do not engage with each other in a face to face manner and, unlike the case of gaming, subjects are not fully immersed in these 3D environments. Multitasking dominates. Inspired by the success of gaming, 3D technology is being incorporated into collaboration tools in a way that recreates the sense of physical space that exists in the real world. While this metaphor is both apt and optimal for games whose focus is often shooting at another person or scoring points in a virtual football game, it falls short when trying to support thought work.
The possibility of designing human computer interactions that incorporate three dimensions of space to support distributed work is powerful, but infinitely more complex than designing a space that supports warfare or virtual games. The gaming industry is ahead of the collaborative work, distributed work and computer mediated communication research communities because their design problem is simple, though their technology problem is significant. The evaluation tools developed through this study will help designers meet the design challenges of applying 3D technology to distributed work problems. Three dimensional interaction technologies are a new and exciting way for HCI designers to engage distributed workers. The research presented here demonstrates that 3D environments modeled after the physical world increase the sense of social presence among users. As a next step, designers must begin to think about how three dimensions can be used to support information exchange, creativity, awareness, and creative work among distributed groups.
CONCLUSION There are theoretical and methodological implications of this work. From the perspective of theory, the way our subjects used 3D technologies for distributed work suggest that existing theory about the irreplaceable nature of physical presence should be challenged. The use of 3D environments by themselves does not replace physical presence. However, the natural occurrence of multiple device multitasking by our subjects suggests that given enough channels, people naturally move to recreate as much of the physical world as they can in virtual environments. Three dimensional environments with avatars permit the recreation of gesture. They also permit the organization of high dimensional information spaces. Given an integrated set of technologies it is possible that we might not replace the
Copyright © 2011, IGI Global. Copying or distributing in print or electronic forms without written permission of IGI Global is prohibited.
46 International Journal of Social and Organizational Dynamics in IT, 1(1), 30-48, January-March 2011
REFERENCES
capacity of physical co presence, but possibly, for the performance of task work, exceed it. Methodologically, this paper presents a year of work developing two distinct but interconnected methods for HCI evaluation of 3D environments. Our integrated approach has four main benefits to the HCI community. First, the application of existing eye-tracking technology to 3D environments provides a fine-grained toolset for identification of basic navigational issues experienced by novices. Second, knowledge of subject attention to the emotions presented in avatar facial expressions is enabled through eye-tracking. Third, our AVQA method offers designers the opportunity to know how members of a 3D environment see each other, and separately attend to the objects and activities in these types of environments. Fourth, the integration of these two methods to examine a series of different 3D virtual environments – ideally by a number of different research teams – will advance the use of 3D collaborative spaces for work and learning at a very rapid pace. Three-dimensional technology is presently very successful at engaging people in play. We hope that by outlining these methods, and suggesting their integrated use, we will inspire serious discussion about how to design and evaluate 3D environments for collaboration and learning across geographical, linguistic and cultural boundaries. We seek to advance the role that design based research, Human Computer Interaction and the design profession in general are able to play in the creation of better worlds within our world.
Dyck, J., Pinelle, D., Brown, B., & Gutwin, C. (2003). Learning From Games: HCI Design Innovations in Entertainment Software. In Proceedings of the Graphics Interface, Halifax, Nova Scotia, Canada.
ACKNOWLEDGMENTS
Finholt, T., & Sproull, L. S. (1990). Electronic Groups at Work. Organization Science, 1(1), 42–70. doi:10.1287/orsc.1.1.41
We would like to thank several anonymous reviewers for their feedback on this article, and an earlier version of it, which we presented at the Hawaii International Conference on System Science, 2010. We would also like to thank Cynthia Jobe for her editorial review and feedback.
Arroyo, E., Selker, T., & Willy, W. (2006). Usability Tool for Analysis of Web Designs Using Mouse Tracks. In Proceedings of CHI 2006. Blascovich, J., Loomis, J., Beall, A. C., Swinth, K. R., Hoyt, C. L., & Bailenson, J. N. (2001). Immersive Virtual Environment Technology as a Methodological Tool for Social Psychology. Psychological Inquiry. Byrne, M. D. (2001). ACT-R/PM and Menu Selection: Applying a Cognitive Architecture to HCI. International Journal of Human-Computer Studies, 55, 41–84. doi:10.1006/ijhc.2001.0469 Carroll, J. M. (2003). HCI Models, Theories, and Frameworks: Toward a Multidisciplinary Science. San Francisco, CA: Morgan Kaufmann. Clarke, D., & Duimering, R. (2006). How Computer Gamers Experience the Game Situation: A Behavioral Study. ACM Computers in Entertainment, 4(3), 1–23. Consortium, C. (2007). Croquet: Invent the Future. Retrieved September 14, 2007, from http://www. opencroquet.org/index.php/Main_Page Crawford, C. (1982). The Art of Computer Game Design: Reflections of a Master Game Designer. New York: McGraw-Hill. Cutrell, E., & Zhiwei, G. (2007). What Are You Looking For? An Eye-Tracking Study of Information Usage in Web Search. In Proceedings of CHI 2007, San Jose, CA. Duchowski, A. (2002). A Breadth-First Survey of Eye-Tracking Applications. Behavior Research Methods, Instruments, & Computers, 34(4), 455–470.
Fitzpatrick, G. (1998). The Locales Framework: Understanding and Designing for Cooperative Work. Brisbane, Australia: University of Queensland. Goggins, S., Laffey, J., & Tsai, I.-C. (2007). Cooperation and Groupness: Community Formation in Small online Collaborative Groups. In Proceedings of the ACM Group Conference 2007, Sanibel Island, FL.
Copyright © 2011, IGI Global. Copying or distributing in print or electronic forms without written permission of IGI Global is prohibited.
International Journal of Social and Organizational Dynamics in IT, 1(1), 30-48, January-March 2011 47
Goldberg, J. H., Stimson, M. J., Lewenstein, M., Scott, N., & Wichansky, A. M. (2002). Eye Tracking in Web Search Tasks: Design Implications. In Proceedings of the ETRA 2002, New Orleans, LA.
Muri, R. M., Cazzoli, D., Nyffeler, T., & Pflugshaupt, T. (2009). Visual exploration pattern in hemineglect. Psychological Research, 73(2), 147–157. doi:10.1007/s00426-008-0204-0
Grossman, L. (2007). The Man in the Mask. Technoculture.
Nardi, B., & Harris, J. (2006). Strangers and Friends: Collaborative Play in World of Warcraft. In Proceedings of CSCW ‘06, Banff, Alberta, Canada.
Grudin, J. (1994). Eight Challenges for Developers. Communications of the ACM, 37, 92–116. doi:10.1145/175222.175230 Guan, Z., Lee, S., Cuddihy, E., & Ramey, J. (2006). The Validity of the Stimulated Retrospective ThinkAloud Method as Measured by Eye Tracking. In Proceedings of chi 2006, Montreal, Canada. Just, M. A., & Carpenter, P. A. (1980). A Theory of Reading: From Eye Fixations to Comprehension. Psychological Review, 87, 329–354. doi:10.1037/0033295X.87.4.329 Kaptelinin, V., & Czerwinski. (Eds.). (2007). Beyond the Desktop Metaphor: Designing Integrated Digital Work Environments. Boston: MIT Press. Karn, K. S. (2006). Eye Tracking for Usability testing, You’ve Got to Know Your Strengths and Weaknesses. In Proceedings of CHI 2006. Karn, K. S., Ellis, S., & Juliano, C. (1999). The Hunt for Usability: Tracking Eye Movements. In Proceedings of CHI 1999. Keisler, S., & Cummings, J. N. (2002). What do We Know About Proximity and Distance in Work Groups? A Legacy of Research. In Hinds, P., & Kiesler, S. (Eds.), Distributed Work (pp. 57–111). Cambridge, MA: MIT Press. Larson, J. (2007). Out of the Video Arcade, into the Office: Where Computer Games Can Lead Productivity Software. Interaction, 18–22. doi:10.1145/1189976.1189992 Li, D., Babcock, J., & Parkhurst, D. J. (2006). openEyes: A Low-Cost Head-Mounted Eye-Tracking Solution. In Proceedings of the ETRA 2006. Linnett, B. J., Fries Duvall, K. E., & Powelson, L. H. (1997). Software Platform Having a Real World Interface with Animated Characters. Hoboken, NJ: Microsoft Corporation. Moore, R. J., Gathman, E. C. H., Ducheneaut, N., & Nickell, E. (2007). Coordinating Joint Activity in Avatar-Mediated Interaction. In Proceedings of the CHI 2007, San Jose, CA.
Paiva, A., Andersson, G., Hook, K., Mourao, D., Costa, M., & Martinho, C. (2002). SenToy in FantasyA: Designing an Affective Sympathetic Interface to a Computer Game. Personal and Ubiquitous Computing, 6, 378–389. doi:10.1007/s007790200043 Rapeepisarn, K., Wong, K. W., Fung, C. C., & Depickere, A. (2006). Similarities and Differences Between “Learn Through Play” and “Edutainment”. In Proceedings of the 3rd Australasian conference on Interactive entertainment IE ‘06. Rollings, A., & Adams, E. (2003). Andrew Rollings and Ernest Adams on Game Design. New Riders. Salvucci, D. D., & Goldberg, J. H. (2000). Identifying Fixations and Saccades in Eye-Tracking Protocols. In Proceedings of the ETRA 2000. Santella, A., & DeCarlo, D. (2004). Robust Clustering of Eye Movement Recordings for Quantification of Visual Interest. In Proceedings of the ETRA 2004. Tarasewich, P., & Fillion, S. (2004). Discount Eye Tracking: The Enhanced Restricted Focus Viewer. In Proceedings of the Tenth Americas Conference on Information Systems, New York. Tuckman, B. W. (1965). Developmental Sequence in Small Groups. Psychological Bulletin, 63, 384–399. doi:10.1037/h0022100 Wadlinger, H. A., & Isaacowitz, D. M. (2006). Positive Mood Broadens Visual Attention to Positive Stimuli. Motivation and Emotion, 30, 89–101. doi:10.1007/s11031-006-9021-1
ENDNOTES 3 1 2
http://www.techsmith.com/morae/ http://www.anvil-software.de/ http://www.camtasiastudio.com
Copyright © 2011, IGI Global. Copying or distributing in print or electronic forms without written permission of IGI Global is prohibited.
48 International Journal of Social and Organizational Dynamics in IT, 1(1), 30-48, January-March 2011
Sean P. Goggins is an Assistant Professor in the College of Information Science and Technology at Drexel University in Philadelphia, PA, where he teaches courses in human-computer interaction, collaborative software design, software engineering and technology management. Dr. Goggins’ current research interests include management of distributed work teams, collaborative information behavior and social computing. Dr. Goggins has 15 years of experience designing and implementing cutting edge collaborative software at Fortune 500, Global 50 and technology startup companies. Dr. Goggins may be reached at
[email protected] . Matthew Schmidt is a PhD candidate in the School of Information Science and Learning Technologies at the University of Missouri. He designs, develops and supports technologies to enhance learning and instruction across a multitude of disciplines, including nuclear science, radiation protection, biological anthropology, second language acquisition, architectural archiving, veterinary medicine and social competence instruction for individuals with autism spectrum disorders. His research interests are situated in the intersection of curriculum and technology and focus on how emergent technologies can be best implemented for optimal learning outcomes. He is currently project manager of the iSocial project (http://isocial.missouri.edu). Jesus Guajardo, MD is an Assistant Professor at University of Texas Health Science Center San Antonio.. Dr. Guajardo also holds a Masters in Health Professions from the University of Ilinois at Chicago, and is a PhD candidate at the School of Information Science and Learning Technology at the University of Missouri-Columbia. Joi L. Moore is an Associate Professor in the School of Information Science & Learning Technologies at the University of Missouri where she manages and teaches courses in the Digital Media Curriculum. Dr Moore's current research interests include: analyzing information architecture in Electronic Performance Support Systems and Interactive Learning Environments; usability engineering; and designing user-centered web applications based on Human Computer Interaction and Human Information Behavior.
Copyright © 2011, IGI Global. Copying or distributing in print or electronic forms without written permission of IGI Global is prohibited.