JOURNAL OF APPLIED BEHAVIOR ANALYSIS
2003, 36, 465–486
NUMBER
4 (WINTER 2003)
A HALF CENTURY OF SCALLOPING IN THE WORK HABITS OF THE UNITED STATES CONGRESS THOMAS S. CRITCHFIELD, REBECCA HALEY, BENJAMIN SABO, JORIE COLBERT, AND GEORGETTE MACROPOULIS ILLINOIS STATE UNIVERSITY
It has been suggested that the work environment of the United States Congress bears similarity to a fixed-interval reinforcement schedule. Consistent with this notion, Weisberg and Waldrop (1972) described a positively accelerating pattern in annual congressional bill production (selected years from 1947 to 1968) that is reminiscent of the scalloped response pattern often attributed to fixed-interval schedules, but their analysis is now dated and does not bear on the functional relations that might yield scalloping. The present study described annual congressional bill production over a period of 52 years and empirically evaluated predictions derived from four hypotheses about the mechanisms that underlie scalloping. Scalloping occurred reliably in every year. The data supported several predictions about congressional productivity based on fixed-interval schedule performance, but did not consistently support any of three alternative accounts. These findings argue for the external validity of schedule-controlled operant behavior as measured in the laboratory. The present analysis also illustrates a largely overlooked role for applied behavior analysis: that of shedding light on the functional properties of behavior in uncontrolled settings of considerable interest to the public. DESCRIPTORS: fixed-interval schedule, U.S. Congress, bill enactment
Laboratory schedules of reinforcement are designed not to model everyday situations but to isolate variables that influence behavior (Chance, 1999). These variables presumably operate outside the laboratory, although their influence sometimes may be difficult to detect amidst the complexities of everyday affairs. Understandably, there is considerable interest in identifying nonlaboratory situations in which outcomes reminiscent of laboratory schedule effects are evident. One possible example was identified by Joseph V. Brady (cited in Weisberg & Waldrop, 1972) who, in a 1958 address to the National Press Club, described the work environment of the United States Congress as similar to a fixed-interval reinforcement schedule. Brady’s observation rested on two We are grateful to the members of the Spring, 2000, Psychology 331 class, who collected some of the data as part of a class project. Larry Alferink provided valuable feedback on a draft of the manuscript. Address correspondence to T. Critchfield, Department of Psychology, Illinois State University, Normal, Illinois 61790 (e-mail:
[email protected]).
assumptions. The first is that congressional sessions represent a well-defined temporal interval, which is an approximation of the truth. Each 2-year Congress incorporates two sessions, each of which begins in January and ends near the end of the year. Congress sets its own dates to convene and to conclude business at session’s end, and the exact duration of congressional sessions varies somewhat from year to year. Weisberg and Waldrop argued, however, that public statements made routinely by congressional leaders give members of Congress reasonable foreknowledge of each session’s probable duration. It is this predictability that makes congressional sessions functionally similar to fixed intervals. The second assumption on which Brady’s fixed-interval analogy rests is similar to Mayhew’s (1974) assertion that members of Congress are ‘‘single-minded seekers of reelection’’ (pp. 5–6). In Brady’s analogy, the ‘‘behavior’’ of the Congress is passing bills of legislation. This behavior is critical to pro-
465
466
THOMAS S. CRITCHFIELD et al.
ducing ‘‘reinforcers’’ delivered by constituents in the form of resources (e.g., votes, money) that help members of Congress retain their jobs, but a well-defined temporal interval must elapse before behavior can contact this consequence. For instance, members of the voting public are widely assumed to have short memories, rewarding only a politician’s most recent accomplishments. Moreover, members of Congress may not be available to inform constituents of their efforts until near election time. The arrangement mimics a fixed-interval schedule in that members of Congress can work on legislation throughout the year but are most likely to collect political rewards only upon the conclusion of the session. The parallel with laboratory reinforcement schedules is imperfect (e.g., Poppen, 1982a), but nevertheless Brady asserted that the productivity of Congress should mirror the positively accelerating, or scalloped, pattern often seen in laboratory studies of fixed-interval performance (e.g., Dews, 1978; Ferster & Skinner, 1957). Cases like this one present a challenge to behavior analysis. When behavior of interest takes place outside controlled settings and is unsuitable for evaluation using single-case experimental analyses, the field faces a choice: either adopt empirical methods suitable to the problem or cede interesting topics to other scholars. Critchfield and Kollins (2001) argued that the former strategy often is preferable because it provides an empirical basis for extending the strong conceptual foundations of behavior analysis to problems of broad interest. The empirical (e.g., descriptive) methods applicable in such cases may not permit investigators to demonstrate incontrovertible functional relations, but there is value in providing a plausible empirical account of phenomena that behavior analysis does not normally address. To evaluate Brady’s fixed-interval interpretation of congressional productivity, Weis-
berg and Waldrop (1972) conducted a descriptive analysis based on archival records of bill production. They found that, for the years 1947 to 1954 and 1961 to 1968, cumulative totals of monthly bills generated by Congress showed a reliable scalloped pattern. That is, Congress generated few bills during the early months of each year and passed most of its legislation just before the end of each session. In this sense, the available data appear to support Brady’s fixedinterval analogy. Yet Weisberg and Waldrop acknowledged that congressional scalloping might emerge for reasons other than fixedinterval contingencies, so the fixed-interval interpretation remains speculative. Even if fixed-interval-like contingencies did account for the Weisberg and Waldrop (1972) data, there is reason to wonder whether they apply to contemporary Congresses. Innovations in transportation, political marketing techniques, and electronic communication have dramatically changed the relationship between members of Congress and their constituents (e.g., Parker, 1989). Moreover, campaign practices and campaign finance laws have changed substantially since Weisberg and Waldrop’s analysis was published. Money, for example, is no longer linked as closely to constituents as it once was. Instead, lobbying groups with representatives in Washington, DC—rather than ties to the home district—now have a major impact on campaign finance, especially for incumbents (Curtis & Westerfield, 1992; Herrnson, 2001; Lewis & The Center for Public Integrity, 1998; Ornstein, Mann, & Malbin, 2000). Thus, end-of-session ‘‘rewards’’ may no longer be as dependent on congressional productivity as they once were, and it is possible that the legislative productivity of Congress no longer follows a scalloped pattern. The purpose of the present investigation, like that of Weisberg and Waldrop (1972), was to empirically evaluate Brady’s fixed-in-
PROCRASTINATION BY CONGRESS terval analogy. To generate testable predictions, we took the analogy at face value, and deferred consideration of some ways in which the congressional work environment may be unlike a simple fixed-interval reinforcement schedule. Our investigation expanded upon that of Weisberg and Waldrop in two ways. First, annual patterns of bill production were examined for the 81st through 106th Congresses (1949 to 2000) in an attempt to corroborate Weisberg and Waldrop’s original analysis and extend it to recent years. Second, supplemental analyses evaluated predictions of several hypotheses, derived from the fixed-interval analogy and competing interpretations, about the mechanisms underlying congressional scalloping. As a concluding exercise, we considered some possible conceptual objections (e.g., Poppen, 1982a) to the fixed-interval analogy in light of what is known generally about schedule-controlled operant behavior. EVALUATING THE SCALLOP Unless otherwise indicated, analyses were based on annual data from 1949 to 2000, taken from the ‘‘Resume´ of Congressional Activity,’’ a feature of the annual Daily Digest volume of the Congressional Record (Washington, DC: United States Government Printing Office). As the basis for most analyses, independent observers derived monthly totals of public bills enacted into law.1 Dis1 This measure is imperfect. Once approved by both chambers of Congress, a bill also must be signed by the President to become enacted into law. We used bills enacted as the primary measure because (a) it is the organizing theme of the Congressional Record Daily Digest, which contains no cogent summary of bills approved by Congress but not by the President and makes an accounting of bills passed rather cumbersome across many decades, and (b) pilot analyses suggested that the median lag between congressional and presidential approval is short and does not vary systematically across Congresses. Nevertheless, analyses based solely on date of bill approval are needed to lend confidence to the present findings.
467
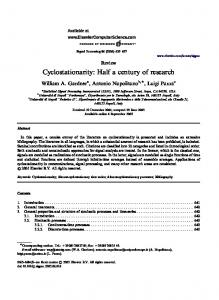
agreement between observers for any monthly total, identified by a third party, prompted an independent recount by each observer, and this process was repeated until the observers agreed exactly. Most analyses bearing on the mechanism of congressional scalloping employed least squares linear regression to evaluate relations between congressional productivity and possible predictor variables. Correlational analyses were employed because both congressional productivity and the factors that might influence it are naturally occurring events not amenable to experimental control. Archival sources summarized predictor variables in varying ways, and this influenced the analytical strategy. Conceptually similar predictor variables described at the same level of analysis (1-year session vs. 2-year Congress) across the same span of years were evaluated simultaneously via multiple regression, which corrects for intercorrelation between predictor variables. Otherwise, separate simple regression analyses were conducted for each predictor variable. Because the scant literature on congressional scalloping provided little guidance about the most plausible causal mechanisms to examine or how to quantify them, we employed a liberal alpha (.05) as decision criterion for statistical significance in order to identify as many potential predictors of scalloping as possible. Does Scalloping Persist? Figure 1 shows the monthly cumulative total of bills enacted into law for the 81st through 90th Congresses (1949 through 1970), a period encompassing most of the Weisberg and Waldrop (1972) analysis. Cumulative bill totals derived in the present analysis (thick lines) followed a consistent scalloped pattern for time spent in session. Note that, for most years, a horizontal plateau marks the period after Congress recessed at the end of Session 1 or adjourned at the end of Session 2; these data are shown
468
THOMAS S. CRITCHFIELD et al.
Figure 1. Cumulative monthly public bills enacted into law, 1949 to 1970. Thick lines show data from the present analysis. Thin lines show data estimated from Figures 1 and 2 of Weisberg and Waldrop (1972).
in the interest of full disclosure but do not, technically speaking, represent time in session. For comparison purposes, cumulative monthly bill totals were estimated from graphic displays in the Weisberg and Waldrop (1972) report; these are shown for relevant years as thin lines in Figure 1. For most years, the present data closely paralleled those of the previous report. Although bill totals of the present and previous analyses
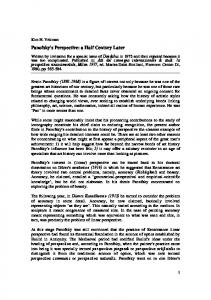
diverged noticeably for a few years,2 overall monthly counts from the two sources were positively correlated at r 5 .91, p , .0001. Regardless of whether the cumulative curves were based on our data or those of Weisberg and Waldrop, visual inspection suggests that congressional productivity was scalloped in all cases. Visual inspection of Figure 2 suggests that the scalloped pattern in cumulative plots of public bills enacted into law persisted in all years of the 91st through 106th Congresses (1971 through 2000). Thus, across all years surveyed, few bills were enacted during the first several months of each session, and the cumulative total tended to accelerate positively as the end of the session approached. This pattern was evident despite considerable annual fluctuation in the number of bills enacted (88 to 638) and in the duration of congressional sessions (181 to 365 days). Across more than half a century, then, bills have been enacted in a distinct scalloped pattern in every session of each Congress. Other than scalloping, two patterns can be discerned in Figure 2. First, there has been a trend toward fewer bills enacted in recent years, a phenomenon that has been attributed mainly to the increasing prevalence of jointly sponsored bills that reduce redundancy across legislative acts (e.g., Ornstein et al., 2000). Second, fewer bills typically have been enacted during Session 1 than during Session 2 (Mann–Whitney U 5 73.5, p , .0001), a pattern noted previously by Weisberg and Waldrop (1972). Implica2 Repeated reanalyses (counts of bills listed in the Congressional Record Daily Digest and estimates of bill totals from the Weisberg & Waldrop, 1972, graphic summaries) did not resolve the discrepancies. Imprecision in the hand-drawn figures of Weisberg and Waldrop may partly account for this outcome. Note, too, that our data-collection procedure may not have replicated that of Weisberg and Waldrop, who reported that they obtained data from the ‘‘Congressional Digest.’’ A publication of this name exists but does not appear to be consistent with Weisberg and Waldrop’s analysis.
PROCRASTINATION BY CONGRESS
Figure 2.
469
Cumulative monthly public bills enacted into law from 1971 to 2000.
interval. The resulting value is positive for positively accelerating curves, negative for negatively accelerating curves, and zero for Quantitative Evaluation of Curvature straight lines. As the IOC approaches 1 (or Our conclusion that scalloping has been 21), the curve increasingly approximates a the norm for Congress was based on visual right angle. Thus, values in the range of inspection, which can be subjective, so we roughly .25 to .75 may be said to indicate sought a more objective means of evaluating scalloping of the sort normally attributed to the degree of positive acceleration in bill en- fixed-interval performance. actment within each congressional session. In our IOC analyses, responses were bills Such a means is available in the form of an enacted and the interval was defined as the index of curvature (IOC; Fry, Kelleher, & number of days between the opening of a Cook, 1960) developed for the analysis of session and the date of enactment of that data from fixed-interval schedules (for some session’s final bill. Figure 3 shows that IOC applications, see Dews, 1978; Dukich & values were positive and in the range indiLee, 1973; Gollub, 1964; Schneider, 1969). cating scalloping, thereby corroborating our The IOC, a weighted area-under-the-curve conclusions based on visual inspection. IOC measure, may be formally expressed as values did not appear to vary systematically across years, were not related to the annual 3R 2 2(R 3 1 R 2 1 R1 ) IOC 5 4 , number of bills enacted (see Workload Hy4R 4 pothesis, below), and were not significantly in which R1 through R4 are the cumulative different in Session 1 than in Session 2 response totals in the first through fourth (Mann–Whitney U 5 303.5, p 5 .5278). quarters, respectively, of the measurement In addition, the degree of curvature was untions of the latter pattern will be addressed below.
470
THOMAS S. CRITCHFIELD et al. PARALLELS WITH FIXED-INTERVAL PERFORMANCE
Figure 3. Annual index of curvature in public-bill production. See text for details.
remarkable during short-term events that might be predicted to disrupt congressional functioning (consider the Nixon resignation of 1974, the extended government shutdowns of 1995 and 1996, and the Clinton impeachment of 1998). In sum, the scalloped pattern of annual congressional productivity, as summarized by the IOC measure, has remained consistent across more than 50 years.
If contingencies similar to those of fixedinterval schedules dictate congressional scalloping, then variables known to affect fixedinterval performance should affect congressional productivity in similar ways. Figure 4 summarizes four such relations. First, overall response rate in fixed-interval schedules is negatively associated with interval duration (e.g., Skinner, 1938). Panel A of Figure 4 shows a similar relation for the present study: Annual rate of bill production was negatively correlated (r 5 2.71, p , .0001) with the duration of the congressional session. Second, running rate in fixed-interval schedules is negatively associated with interval duration. Running rate may be defined as the response rate during a period just prior to the end of a session (as per Catania & Reynolds, 1968), and for the current study
Figure 4. Four relations predicted on the basis of laboratory fixed-interval performance. Lines of best fit were determined through least squares linear regression. See text for other details.
PROCRASTINATION BY CONGRESS we defined it as the number of bills enacted per day during the final quarter of the congressional session. Panel B of Figure 4 shows that running rate, defined in this manner, was negatively correlated (r 5 2.64, p , .0001) with session duration. When running rate was defined as rate after the first response is made (as per Schneider, 1969)— here, rate of bill enactment after the first bill was generated—the relation was somewhat stronger (r 5 2.74, p , .0001; data not shown). Third, the degree of curvature in fixedinterval performance appears to be a negative function of interval duration (Azrin & Hutchinson, 1967; Herrick, 1969; Shull, Gulkey, & Witty, 1972; Stubbs, Vautin, Reid, & Delehanty, 1978). Panel C of Figure 4 shows that, in the present study, IOC was negatively correlated (r 5 2.44, p 5 .0010) with the number of days in the annual congressional session. Fourth, the degree of positive acceleration in fixed-interval reinforcement schedules is a positive function of reinforcer magnitude (Belke & Dunbar, 1998; Lowe, Davey, & Harzem, 1974; Staddon, 1970). For the present data, the duration of the preceding recess was used as a measure of reinforcement magnitude under the assumption that more time away from Washington translates into more access to constituents and the ‘‘reinforcers’’ they control.3 Panel D of Figure 4 shows that IOC was positively correlated (r 5 .41, p 5 .0025) with the duration of the preceding recess. Overall, four correlations that were expected based on laboratory fixed-interval 3 This emphasis on the preceding recess, rather than the upcoming one, makes sense for two other reasons. First, this approach emphasizes ‘‘reinforcers’’ actually contacted. Second, the approach is consistent with research suggesting that, in fixed reinforcement schedules, response rate in the period just following a reinforcer is partly determined by inhibitory aftereffects of the just-contacted reinforcer (Perone & Courtney, 1992).
471
performance were present in congressional productivity. Thus, all of the relations examined were consistent with predictions derived from laboratory research on fixed-interval schedules. A thorough evaluation of the similarity between congressional scalloping and fixed-interval performance, however, requires the inspection of alternative factors that could produce the same pattern. Below, we examine three such classes of factors derived from more traditional accounts of congressional behavior. ALTERNATIVE HYPOTHESES Workload It is possible that, when its workload is heavy, Congress becomes bogged down in competing demands and, as a result, fails to generate much of its legislation until the latter part of a session. Thus, congressional scalloping could be an artifact of congressional workload (Weisberg & Waldrop, 1972). One way to conceptualize congressional workload is in terms of the size of the policy agenda that Congress faces each year. Binder (2001) provided an estimate of the number of significant policy issues facing the 81st through 104th Congresses (1949 through 1998). If workload dictates scalloping, then a positive relation should arise between IOC and the number of issues on the congressional agenda. Simple regression revealed a significant negative correlation (r 5 2.46, p 5 .0230) between this measure of workload and the 2-year mean IOC. Thus, as the number of issues facing Congress increased, congressional productivity became less scalloped. This outcome is inconsistent with the workload hypothesis. A second way to estimate congressional workload is in terms of its output, or bills generated (Ornstein et al., 2000). The present analysis focused primarily on public bills, but Congress also may produce private bills that affect a single individual or group
472
THOMAS S. CRITCHFIELD et al. Table 1 Summary of Multiple Regression Analyses Involving Index of Curvature and Predictor Variables Class of variables
Workload
Level of analysis
Session
Support for Presi- Congress dent’s position Interparty ideology Congress differences Intraparty ideology Congress variance Number of bills produced
Session
Years
Variables
1949–2000 Measures introduced Nominations Pages of proceedings Votes 1950–1998 House support Senate support 1949-2000 House difference Senate difference 1949-2000 House Republicans House Democrats Senate Republicans Senate Democrats 1949–2000 Public bills Private bills
b
SE
b
t
p
,0.02 ,0.01 20.83 ,0.01 ,0.01 ,0.01 20.72 1.18 22.67 2.05 20.58 0.21 ,0.01 ,0.01
,0.01 ,0.01 0.74 0.01 ,0.01 ,0.01 0.23 0.35 0.68 0.43 0.34 0.05 ,0.01 ,0.01
0.30 20.03 20.21 20.08 0.05 0.26 21.43 1.56 20.98 1.14 20.38 0.54 20.03 0.26
1.826 20.215 21.119 20.406 0.296 1.511 23.118 3.418 23.957 4.822 21.702 4.005 20.142 1.525
.0742 .8309 .2689 .6868 .7690 .1384 .0048 .0024 .0008 .0001 .1042 .0007 .8832 .1337
Note. When the level of analysis was the 2-year Congress, IOC was the mean of annual values. Workload variables are defined in Table 2. See text for other details.
rather than the general public. Such bills have become rare in recent years, but they nevertheless comprise part of a Congress’s track record and, because they take time to develop and enact, private bills could contribute to the annual scallop in public bill production. Multiple regression, F(2, 49) 5 1.58, p 5 .2171, revealed no significant relation between IOC and the annual totals of public and private bills enacted (see Table 1). This finding is inconsistent with the workload hypothesis.4 Additional empirical measures of the annual workload of Congress, as defined by Ornstein et al. (2000), are described in Table 2. To standardize across years in terms of work units per unit time, each annual value of the workload measures was divided by the number of days Congress spent in session. Multiple regression, F(4, 47) 5 2.18, p 5 .0860, revealed no significant relations be4 The apparent lack of correlation between IOC and rate of public-bill production is, however, consistent with the laboratory finding that degree of positive acceleration in fixed-interval schedules is not strongly related to response rate (Dukich & Lee, 1973; Gollub, 1964).
tween IOC and any of these variables (see Table 1). Preparatory Responses As noted by Weisberg and Waldrop (1972) and Poppen (1982a), bill enactment is not a discrete action but rather the endpoint of a potentially lengthy series of activities, and thus it is possible that scalloping is an artifact of the time spent in these preparatory activities. This view is, perhaps, consistent with the data in Panel C of Figure 4: Preparatory activities might consume a greater proportion of shorter congressional sessions than of longer ones, thereby yielding a negative relation between IOC and session duration. One way to quantify preparatory actions is in terms of the number of committee and subcommittee meetings held by Congress. Among other things, committees provide the means to screen and refine legislation before it reaches the floor for debate (Murphy & Danielson, 1977), and there is general consensus that ‘‘Congress does most of its work through the Committee system’’ (Ornstein et al., 2000, p. 113). Because committee
PROCRASTINATION BY CONGRESS
473
Table 2 Some Annual Measures of Congressional Workload Identified by Ornstein et al. (2000) Measure
Definition
Page of proceedings
A ‘‘substantially verbatim’’ record of congressional debates, plus the text of communications between Congress and the Executive Branch, memorials, petitions, and supplemental information on legislation. Sum of totals reported for the Senate and House of Representatives. The House total includes extensions of remarks, statements made for the record by members of the House of Representatives but not delivered on the House floor (see http://thomas.loc.gov/ home/abt.cong.rec.html#proceedings). Number of separate pieces of legislation proposed; sum of totals from both chambers. Number of presidential appointments to many civilian and military positions requiring congressional consideration. Although the large majority of nominations are approved, Congress must consider many thousands each year. Sum of the number of votes taken in each chamber. Different conventions in the two chambers yield different definitions of votes for the Senate (number of yea or nay votes) and House of Representatives (number of yea or nay votes, quorum calls, and recorded votes).
Measures introduced Nominations Votes
work precedes general debate and voting on bills, the degree of scalloping in bill production might be positively related to the amount of time Congress spends in committee. In simple regression, however, a significant negative correlation (r 5 2.47, p 5 .0260) was found between the number of House plus Senate committee and subcommittee meetings held by Congress between 1955 and 1998 (data from Ornstein et al., 2000) and the 2-year mean IOC for those Congresses. Thus, it appears that the more time Congress spends in committee, the less scalloped its pattern of bill production. Rather than depicting scalloping as an artifact of preparatory activities, the data suggest instead that scalloping results from too little investment in these activities, as might be expected if preparatory activity, like bill enactment, follows the pattern of ‘‘procrastination’’ typically attributed to fixed-interval schedule performance. Weisberg and Waldrop (1972), arguing against the preparatory response hypothesis, suggested that, although the lag between introduction and passage of a bill often is quite long, many bills are passed without substantial delay, particularly in the waning days of
a congressional session. This claim, for which Weisberg and Waldrop presented no supporting data, may be inconsistent with the preparatory response hypothesis, according to which all bills, regardless of when they are introduced, would require some minimum amount of preparatory activity. Thus, the lag between bill introduction and bill passage should be fairly constant across portions of the congressional session. We determined the number of days intervening between introduction and passage of each bill enacted by three Congresses selected at random, the 88th (1963–1964, 666 bills), the 92nd (1971–1972, 605 bills), and the 104th (1993–1994, 465 bills). Although the median lag varied across Congresses (Figure 5, top), the lag varied systematically within Congresses. Bills introduced later in a Congress had a shorter median lag than bills introduced earlier in the Congress (Figure 5, bottom). Thus, Congress can, when necessary, generate legislation more quickly than it typically does, as Weisberg and Waldrop (1972) asserted. The preceding finding can, however, be viewed as consistent with the preparatory response hypothesis. Perhaps networking and
474
THOMAS S. CRITCHFIELD et al.
Figure 5. Lag, in days, between introduction and passage of bills for selected Congresses. Top: median lag for bills introduced during the entire Congress. Bottom: median lag for bills introduced during 6month portions of the Congress.
social bonding among members accumulate as a Congress progresses, thereby facilitating rapid consensus on bills introduced during the terminal portion of the Congress. We know of no data that can corroborate this interpretation, but if bill passage is a strict function of accumulated networking, then another pattern revealed in the present analysis, Session 2 scalloping (see Figure 2), makes little sense. Normally the staffing of Congress remains constant across sessions, and bills introduced during Session 1 can remain under consideration during Session 2. Thus, rate of bill production should increase across successive temporal segments of a Congress, and there is no reason why the early months of Session 2 should be a period of low productivity. Early Session 2 productivity should exceed late Session 1 productivity, yet for all 26 Congresses examined, bill production during the first 6 months of Session 2 was lower than that in the final 6 months of Session 1 (data not shown). Political Climate Legislative activity reflects the conjoint efforts of individuals, political parties, the two
chambers of Congress, and the President (Murphy & Danielson, 1977). When these interactions are congenial and collaborative, bill passage might proceed without undue delay, and scalloping might be minimized. When interactions are contentious, however, those involved would need time to work out their differences, and little legislation would emerge early in a session. Thus, congressional scalloping could be an artifact of the level of discord in these interactions. It is not possible to quantify the level of discord created by each bill enacted by a Congress, but several global measures of the political climate in which Congress operates are available. Gridlock. A ‘‘gridlock score’’ (available for the 81st through 105th Congresses in Binder, 2001) can be used as a global measure of political climate. The gridlock score is the proportion of ‘‘salient issues’’ faced by a Congress that ultimately resulted in no legislation. This measure reportedly is statistically related to several indexes of political partisanship, and higher scores represent a greater degree of rancor in the legislative process. Yet simple regression revealed no significant relation between the gridlock score and the 2-year mean IOC (r 5 2.15, p 5 .49). Legislative–executive relations. The annual number of presidential vetoes of legislation is one possible measure of rancor in congressional–presidential relations. A Congress operating under threat of veto may proceed more cautiously than one whose bills will be signed routinely, thereby delaying bill production. Simple regression, however, revealed no significant relation between IOC and number of vetoes (r 5 2.07, p 5 .62). As an alternative measure of the relations between Congress and the President, an index of correspondence between congressional and presidential positions on legislation was calculated. For each chamber, the proportion of seats occupied by each of the ma-
PROCRASTINATION BY CONGRESS jor political parties (obtained from the Congressional Record ) was multiplied by the proportion of votes by members of the party in agreement with the President’s position (available for 1955 through 1998 in Ornstein et al., 2000). For both the House and Senate, the products for the two major political parties were summed to yield an index of overall support by each chamber of Congress for the President’s positions. Multiple regression, F(2, 41) 5 1.80, p 5 .1790, revealed no significant relations between IOC and the House and Senate indexes (see Table 1). Legislative relations. Another possible source of delays in the legislative process is discord within Congress based on contrasting (conservative vs. liberal) political ideologies. As a means of quantifying ideology, Poole and Rosenthal (1997) used voting records to develop a liberal–conservative score for each member of each 2-year Congress (see http://voteview.uh.edu/dwnomin.htm). Following the lead of Smith and Gamm (2001), these scores can be used in two ways to examine contentiousness within Congress. First, the difference between median liberal–conservative scores of Democrats and Republicans provides a measure of interparty contentiousness within each chamber. Multiple regression was used to examine the relation between curvature (mean IOC for each 2-year Congress) and these two measures of within-chamber political contentiousness. Imbedded in a significant overall correlation, F(2, 23) 5 5.85, p 5 .0088, were significant relations between IOC and both variables (see Table 1). As interparty differences in the House increased, the level of scalloping decreased. This outcome apparently is inconsistent with the political climate hypothesis. As interparty differences in ideology in the Senate increased, so did the degree of scalloping in congressional productivity. This outcome is consistent with the political climate hypothesis, and may re-
475
flect the fact that, under Senate rules, bill passage is straightforward only with a supermajority of 60%; otherwise, the minority can use filibuster tactics to substantially delay the process (e.g., Parker, 1989). Second, the standard deviation of liberal– conservative scores within each party provides a measure of intraparty rancor within each chamber. Multiple regression was used to examine the relation between curvature (mean IOC for each 2-year Congress) and this measure of political contentiousness for each party in both chambers. Imbedded in a significant overall correlation, F(4, 20) 5 9.88, p 5 .0001, were significant relations between IOC and three variables (see Table 1). As political differences among both House Democrats and Senate Democrats increased, so did the degree of scalloping in congressional productivity. These outcomes are consistent with the political climate hypothesis. As political differences among House Republicans increased, the degree of scalloping decreased. This outcome may be consistent with the political climate hypothesis given that Democrats held majorities in the House in 22 of the 26 Congresses studied. Under these conditions, defectors from a divided Republican Party might contribute to a speedy consensus on legislation supported by the Democratic majority. In summary, measures of general legislative gridlock and legislative–executive contentiousness were not significantly related to IOC. Five measures of ideological rancor within the legislative branch were significantly correlated with IOC, four in a manner consistent with the political climate hypothesis and one in a manner inconsistent with that hypothesis. SUMMARY OF FINDINGS AND LIMITATIONS OF THE ANALYSES Scalloping in annual congressional productivity was found to occur reliably across
476
THOMAS S. CRITCHFIELD et al.
more than half a century. Table 3 summarizes the results of analyses that evaluated several hypotheses about the factors that might create congressional scalloping. Four predictions based on laboratory research on fixed-interval reinforcement schedules were supported, lending credibility to the claim that the congressional work environment bears similarity to fixed-interval contingencies. Three competing hypotheses also were explored. No outcomes supporting the workload and preparatory response hypotheses were identified, and some support was found for political climate as a contributor to scalloping. Unfortunately, it was not possible to evaluate the relative contributions to scalloping of variables related to fixed-interval contingencies and those related to ideological differences within the Congress, because the source data were available at different levels of analysis (session vs. Congress) and for different years. The present investigation incorporated numerous correlational analyses, prompting two standard cautions. The first regards the hazards of drawing causal inferences from correlational data. The second regards the possibility that some statistically significant outcomes could have arisen by chance among the numerous analyses. As noted previously, we employed a liberal alpha (.05) to identify as many potential predictors of scalloping as possible. This approach did not, however, artificially inflate support for the fixed-interval interpretation. Under a more stringent decision criterion of .0038, created by dividing the standard alpha by 13 (the number of correlational analyses conducted to evaluate mechanisms underlying scalloping), the four relations that support a fixedinterval interpretation (Figure 4) remain statistically significant. Otherwise, only the relations between IOC and three measures of intraparty ideological variance remain intact. Thus, a more stringent statistical decision
criterion does not change the general picture of the results (see Table 3). An additional concern about the present investigation is whether it used the proper unit of analysis. Although annual scalloping is evident in congressional productivity, elections, which may serve as the cornerstone of the fixed-interval analogy, occur only every second year. This prompts speculation that a 2-year interval might be the more informative unit of analysis (Weisberg & Waldrop, 1972). The fact that more bills typically were produced in Session 2 than in Session 1 also suggests that a scalloped pattern might hold for entire Congresses. If so, other indexes of congressional ‘‘behavior’’ with plausible links to elections should show a similar pattern. For example, free mailing privileges, although nominally forbidden as an election tool, provide members of Congress with a clear means of informing and influencing constituents. A link between free mailings and elections is suggested by the fact that congressional use of this privilege is routinely higher in Session 2 than in Session 1 of the same Congress (Davidson & Oleszek, 2000). Murphy and Danielson (1977) described the volume of free mailing in 2month intervals between the 1972 and 1974 congressional elections. Figure 6 shows that, when replotted as a cumulative record, these data approximate a scalloped pattern. Figure 7 shows cumulative monthly bill totals for each 2-year Congress. Earlier Congresses produced two distinct annual scallops. For a number of recent Congresses, the annual patterns were less differentiated, suggesting a possible change in the functional response unit. This change can be attributed, in part, to a trend toward longer first sessions. Congresses prior to the 88th tended to recess no later than early November of Session 1 and therefore produced few bills during the final two months of the session. More recently, it has become common for Congress to remain in session, producing
PROCRASTINATION BY CONGRESS
477
Table 3 Summary of Predictions Evaluated Hypothesis
Fixed-interval contingencies
Congressional workload
Preparatory responses
Political climate
Prediction
Supported?
Response rate is negatively correlated with interval duration. Running rate is negatively correlated with interval duration.
Yes
Positive acceleration is negatively correlated with interval duration. Positive acceleration is positively correlated with reinforcer magnitude. Curvature is positively correlated with the size of the workload facing Congress.
Yes
Yes
Yes No
Curvature is positively correlated with level of activities that are prerequisite to bill passage. Rate of bill production increases across segments of each Congress.
No
Curvature is positively correlated with the difficulty of the political climate in which Congress operates.
No
No
Yes
Evidence
Annual number of bills negatively correlated with session duration. Bills per day after the first bill is enacted negatively correlated with session duration. Index of curvature (IOC) negatively correlated with session duration. IOC positively correlated with duration of past recess. IOC not correlated with number of public or private bills enacted, number of nominations considered, number of measures introduced, number of pages of proceedings, or number of votes taken. IOC negatively correlated with size of Congressional agenda. IOC negatively correlated with number of committee meetings. Session 2 scalloping: Bills in first half of Session 2 less than bills in second half of Session 1. IOC not correlated with level of legislative gridlock, number of presidential vetoes, level of discord between congressional and presidential positions on legislation, or ideological heterogeneity among Senate Republicans. IOC negatively correlated with magnitude of ideological differences between political parties in House of Representatives. IOC negatively correlated with ideological heterogeneity among House Republicans. IOC positively correlated with magnitude of ideological differences between political parties in Senate, ideological heterogeneity among House Democrats, and ideological heterogeneity among Senate Democrats.
Note. Evidence items were statistically significant with alpha 5 .05 or readily apparent upon visual inspection of graphed data. Those shown in italics are correlational outcomes that were statistically significant under a conservative decision criterion designed to adjust for multiple analyses. See text for details.
478
THOMAS S. CRITCHFIELD et al.
Figure 6. Cumulative pieces of free mail sent by Congress in the period leading up to the 1974 election. Data estimated from Figure 10.2 of Murphy and Danielson (1977).
bills, through December, thereby eliminating much of the plateau evident in the cumulative graphs midway through earlier Congresses (Figure 7, inset, top panel). To formally evaluate scalloping across a 2year window, IOC was determined for entire Congresses. All values were positive, indicating positive acceleration across the 2-year interval, but the 2-year IOC tended to be lower than the annual IOC (Figure 7, inset, bottom panel). This visually apparent effect was corroborated by a Wilcoxon signed rank test comparing the 2-year IOC and the 2-year
Figure 7. Cumulative monthly public bills enacted into law for the 81st through 106th Congresses. Inset, top: proportion of total bills enacted during the last 2 months of Session 1 and first 2 months of Session 2. Inset, bottom: index of curvature calculated for annual sessions versus 2-year Congresses.
PROCRASTINATION BY CONGRESS mean of annual IOCs. Bill production was more scalloped for individual sessions than for overall Congresses (Z 5 24.10, p , .0001), indicating that the year probably was the more appropriate level of analysis for the present investigation. LIMITS OF THE FIXED-INTERVAL ANALOGY The work environment of Congress may well reproduce factors that operate in fixedinterval schedules, but, as both Weisberg and Waldrop (1972) and Poppen (1982a) have commented, the fixed-interval analogy is imperfect. Outcomes supporting a fixed-interval analogy must be considered in light of the many factors that make the congressional work environment more complex than fixed-interval schedules. Additional Controlling Variables Hybrid contingencies. In evaluating the fixed-interval interpretation of congressional productivity, we have assumed that bill production is the functional ‘‘response’’ in a relatively straightforward contingency system, but other interpretations are possible. For example, bill production could be simply a prerequisite to campaigning, a complex set of behaviors possibly controlled by separate reinforcement contingencies, and certainly of great importance to ‘‘single-minded seekers of re-election’’ (Mayhew, 1974, pp. 5–6). Perhaps bill production is not rewarded per se, but rather creates ‘‘bragging rights’’ at election time, which in turn contribute to reelection. If so, then congressional contingencies share properties with chained schedules of reinforcement. This possibility is not, however, inconsistent with the present analysis, because scalloping often results in the laboratory when fixed-interval contingencies serve as the initial links of chained reinforcement schedules (e.g., Ferster & Skinner, 1957).
479
Although Congress faces a relatively fixed deadline by which to complete its annual business, unlike in a fixed-interval schedule (in which reinforcement depends on emission of a single well-timed response) Congress has many items on its agenda. The ‘‘reinforcement’’ contingent on bill production might well depend on the amount of legislative output, not just on its timing. A limited number of experiments have examined fixed-interval schedules in which additional response requirements are superimposed while the temporal contingencies of the original schedule are left intact. The classic example is the conjunctive fixed-interval fixedratio schedule, in which reinforcement occurs only after the passage of time and the emission of a specified number of responses (Herrnstein & Morse, 1958). Such schedules sometimes yield an approximation of scalloping (Barrett, 1976; Herrnstein & Morse; Leander, Milan, Jasper, & Heaton, 1972; Staddon & Frank, 1975). In this sense, the productivity of Congress may yet be consistent with laboratory performance. Competing contingencies. Poppen (1982a) argued that congressional productivity is different from fixed-interval performance in part because of numerous concurrent contingencies. Indeed, generating bills of legislation is by no means the only task before Congress. For instance, its members also participate in publicity events, exert oversight of the executive branch of government, and attempt to address myriad concerns of individual constituents that are unrelated to the legislative agenda (Murphy & Danielson, 1977). In laboratory preparations, concurrent contingencies appear to reduce response output but accentuate positive acceleration on fixed-interval schedules (e.g., Barnes & Keenan, 1993; Poppen, 1972, 1982b). In the latter sense, scalloped congressional productivity appears to be broadly consistent with laboratory performance. Schedule-correlated stimuli. The passage of
480
THOMAS S. CRITCHFIELD et al.
time presumably serves as a discriminative stimulus for responding on fixed-interval schedules. Consistent with this view, laboratory studies show that enhancing the discriminative properties of the schedule, by imposing a stimulus that is correlated with the passage of time (or the accumulation of responses), concentrates responding in the latter part of the interval (e.g., Azrin, 1958; Ferster & Skinner, 1957; Ferster & Zimmerman, 1963; Long, 1962; Segal, 1962). As Poppen (1982a) has noted, similar stimuli are likely to abound for Congress. Whether Congress scallops because of a generic temporal discrimination or because of schedule-correlated stimuli cannot be ascertained from the present analysis. In either case, however, scalloping is qualitatively consistent with laboratory schedule performances. Schedule-correlated stimuli may help to reconcile a key structural dissimilarity between congressional work schedules and typical laboratory schedules of reinforcement. The present analyses were based on annual sessions that varied somewhat in duration. This differs from the typical steady-state laboratory preparation, in which the duration of a fixed interval may remain constant across many hours of schedule exposure. Importantly, in the laboratory, scalloping often emerges only in asymptotic performance (e.g., Baron & Leinenweber, 1994; Ferster & Skinner, 1957). How, then, can the scalloped pattern of congressional bill production emerge in each new year? The answer may lie in time-correlated stimuli. Weisberg and Waldrop (1972) suggested that congressional leaders know roughly how long each session will last, and they use both direct and indirect means of communicating this to members (time-correlated stimuli also may appear in press reports, by-products of government record keeping, conversations among members of Congress, etc.). The frequency and quality of such prompts may in-
crease as the session progresses. Perhaps analogously, Ferster and Skinner (1957) found that fixed intervals of varying duration could alternate in brief exposures, with scalloping retained, as long as time-correlated stimuli were present. In such cases, both the fixedinterval contingencies and the schedule-correlated stimuli are important determinants of performance, and so it may be with Congress. Schedule-correlated stimuli also could help to explain Session 1 scalloping in congressional productivity. Meck and Church (1984) inserted brief, response-produced stimuli into fixed-interval schedules. When such a stimulus occurred midway through the interval (essentially creating a chain of two fixed intervals, the first producing the stimulus and the second producing food reinforcement), a double scallop reportedly emerged. Such a pattern is reminiscent of congressional productivity considered across 2-year terms (see Figure 7). Group Behavior The productivity of Congress is the sum of efforts by many people. Because reinforcement-schedule research focuses on the behavior of individuals working in isolation, can any lessons derived from it be safely applied to the performance of such a large and heterogeneous group as the Congress? A few studies suggest that the collaboration of two or more individuals working on the same schedule of reinforcement can yield patterns similar to those generated by a single individual (e.g., Buskist & DeGrandpre, 1995; Wolff, Burnstein, & Cannon, 1964; see also Mace, Lalli, Shea, & Nevin, 1992). This is illustrated most clearly in studies of group matching, in which the division of labor within a group is a function of relative reinforcement availability from two or more sources, a pattern analogous to that described for individuals by the matching law (Baum & Kraft, 1998; Critchfield & Atte-
PROCRASTINATION BY CONGRESS berry, in press; Kraft & Baum, 2001; Madden, Peden, & Yamaguchi, 2002; Sokolowski, Tonneau, & Freixi I Baque, 1999). Thus, although critics (e.g., Poppen, 1982a) are correct to assert that group behavior reflects different dynamics than individual behavior (see especially Baum & Kraft, 1998; Kraft & Baum, 2001), findings like these lend encouragement to the idea that aggregate group performance may sometimes mirror individual performance on reinforcement schedules. It is also important to note that the composition of the Senate and House of Representatives varies across Congresses. For instance, every 2 years, terms expire for all members of the House and approximately one third of the members of the Senate. How can the performance of a group with fluid membership approximate that known to result in the laboratory from extended exposure to stable reinforcement contingencies? The answer is partly that incumbents who seek reelection almost always win (Ornstein et al., 2000). Thus, the number of new members is small for each Congress. Counting all sources of change (e.g., reelection defeat, retirement, resignation), a median of only about 16% and 12% of House and Senate members, respectively, were replaced at the start of new congressional terms between 1948 and 2000 (Ornstein et al., 2000). Moreover, many newly elected members of Congress are political veterans with an extensive history involving contingencies like those operating in Congress (Murphy & Danielson, 1977). Substantial generalization would be expected. The Scallop as Gold Standard of Fixed-Interval Performance No discussion of fixed-interval contingencies would be complete without mention of a substantial human laboratory literature in which fixed-interval scalloping actually is rare (e.g., Weiner, 1983). This literature ob-
481
viously bears on the validity of the present fixed-interval analogy, but unfortunately it is plagued by unanswered questions and competing interpretations. On the basis of studies involving fixedinterval schedules, some have concluded that human behavior is qualitatively different from animal behavior because it is mediated by verbalization through which humans generate schedule-correlated stimuli (e.g., counting) and rules describing assumed response–reinforcer contingencies. This view is supported by studies suggesting that concurrrent task demands, which presumably interfere with concurrent verbalization, can yield scalloping in human fixed-interval performance (e.g., Barnes & Keenan, 1993; Laties & Weiss, 1963), and by one report suggesting that scalloping occurs in preverbal infants but not in older, verbally capable children (Bentall, Lowe, & Beasty, 1985). It is also consistent with the finding that when verbal behavior itself is reinforced on fixedinterval contingencies (presumably interfering with verbal mediation), scalloped patterns emerge in nonverbal performance (Stitzer, 1984). Critics of this view point out that human laboratory procedures rarely reproduce key features of those used to study nonhuman behavior (e.g., potent reinforcers, adequate interval durations), and human–animal differences in response patterning could well reflect these procedural discontinuities (e.g., Baron, Perone, & Galizio, 1991; Shull & Lawrence, 1998). From this perspective, nonhuman research procedures, because of their well-defined functional properties, may have superior generality to everyday human affairs. The issue is complicated by analyses suggesting that, even when scalloping occurs in the laboratory, it may not be as dependable an outcome as often portrayed. Hyten and Madden (1993), for example, reexamined cumulative records presented by Bentall et
482
THOMAS S. CRITCHFIELD et al.
al. (1995) and found that infants’ ‘‘true scalloping’’ was only one of many patterns that occurred during interreinforcer intervals (although, like scallops, many of the alternative patterns were positively accelerated). Several authors have argued that scalloping often is an artifact of aggregating performance across intervals (e.g., see Baron & Leinenweber, 1994; Branch & Gollub, 1974; Gentry, Weiss, & Laties, 1983). Baron and Leinenweber, for example, presented data showing that scalloping at the level of individual intervals was rare in rats’ fixed-interval performance (although, again, various positively accelerated patterns predominated). Overall, congressional scalloping might be viewed as curious because it is more reliable than scalloping in the laboratory. Some resolution may be found in previously mentioned factors that modulate fixed-interval performance. In particular, the congressional environment probably abounds with timeand response-correlated stimuli. Such stimuli can be expected to promote positive acceleration when superimposed upon fixed-interval contingencies and may well override factors that promote other response patterns. CONCLUSION Scalloping in congressional productivity is a robust phenomenon that, despite the many political, cultural, and legal changes that have affected Congress, has remained intact over more than half a century. Congress completes most of its legislative work during the final months of a session, and thus appears to ‘‘procrastinate’’ in much the same way that laboratory subjects often do when working on fixed schedules of reinforcement. In the present investigation, archival data were found to support predictions about congressional productivity based on fixed-interval performance, but not to consistently support any of three alternative accounts. Although several factors make congressional
work contingencies different from fixed-interval schedules, on the whole, these factors would be expected to promote scalloping when combined with fixed-interval contingencies. In a broad sense, therefore, the data support the external validity of laboratory research on schedules of reinforcement. Although the available data appear to be consistent with an interpretation based on reinforcement schedules, it would be surprising if behavior as varied and complex as that of members of Congress were not multiply determined (e.g., note the apparent role of political ideology in determining scalloping). Fortunately, the goal of an analysis like the present one is not to provide incontrovertible evidence for a single, pure, functional relation (indeed, no descriptive analysis is likely to accomplish this) but rather to identify a plausible account of important everyday behavior. Such accounts are critical to the evolution of behavior analysis as a general-purpose empirical framework for understanding behavior. To date, behavior analysis has demonstrated considerable strengths in at least three domains: the experimental analysis of behavior in the laboratory, the analysis and remediation of socially problematic behavior (most often in persons with severe behavior disorders who inhabit well-controlled treatment settings), and the conceptual interpretation of everyday affairs (e.g., Skinner, 1953). This is an incomplete arsenal of investigatory strategies. Between empirical analyses of disordered behavior and speculative accounts of everyday events lie opportunities to conduct many varieties of empirical investigation that should qualify as applied behavior analysis because they speak to the functional properties of socially important behavior, even if they deviate from the field’s procedural norms (Critchfield & Kollins, 2001; for notable examples, see Mace et al., 1992; Moerk, 1990; Vollmer & Bourret, 2000; Vuchinich & Tucker, 1996).
PROCRASTINATION BY CONGRESS Contrary to the conventions of applied behavior analysis, the present investigation did not employ experimental methods or single-case designs, and it neither incorporated, nor is likely to promote, immediate strategies for improving the behavior under investigation. Such compromises are, as Critchfield and Kollins (2001) argued, unavoidable in the pursuit of certain kinds of research questions. For practical reasons, it would be difficult to apply a traditional experimental analysis to the behavior of legislators or to impose structural changes in the congressional work environment to guard against ‘‘procrastination.’’ These are, to be sure, serious compromises in the modus operandi of applied behavior analysis, and they should not be embraced lightly or routinely. But neither should topics of considerable interest in the everyday world be excluded from analysis or evaluated exclusively through casual interpretation. REFERENCES Azrin, N. H. (1958). Some effects of noise on human behavior. Journal of the Experimental Analysis of Behavior, 1, 183–200. Azrin, N. H., & Hutchinson, R. R. (1967). Conditioning of the aggressive behavior of pigeons by a fixed-interval schedule of reinforcement. Journal of the Experimental Analysis of Behavior, 10, 395– 402. Barnes, D., & Keenan, M. (1993). Concurrent activities and instructed human fixed-interval performance. Journal of the Experimental Analysis of Behavior, 59, 501–520. Baron, A., & Leinenweber, A. (1994). Molecular and molar analysis of fixed-interval performance. Journal of the Experimental Analysis of Behavior, 61, 11–18. Baron, A., Perone, M., & Galizio, M. (1991). Analyzing the reinforcement process at the human level: Can application and behavioristic interpretation replace laboratory research? The Behavior Analyst, 14, 95–105. Barrett, J. E. (1976). Conjunctive schedules of reinforcement: III. A fixed-interval adjusting fixed-ratio schedule. Journal of the Experimental Analysis of Behavior, 25, 157–164. Baum, W. M., & Kraft, J. R. (1998). Group choice: Competition, travel, and the ideal free distribu-
483
tion. Journal of the Experimental Analysis of Behavior, 69, 227–245. Belke, T. W., & Dunbar, M. (1998). Effects of fixedinterval schedule and reinforcer duration on responding reinforced by the opportunity to run. Journal of the Experimental Analysis of Behavior, 70, 69–78. Bentall, R. P., Lowe, C. F., & Beasty, A. (1985). The role of verbal behavior in human learning: II. Developmental differences. Journal of the Experimental Analysis of Behavior, 43, 165–181. Binder, S. A. (2001). Congress, the executive, and the production of public policy: United we govern? In L. C. Dodd & B. I. Oppenheimer (Eds.), Congress reconsidered (pp. 293–314). Washington, DC: CQ Press. Branch, M. N., & Gollub, L. R. (1974). A detailed analysis of the effects of d-amphetamine on behavior under fixed-interval schedules. Journal of the Experimental Analysis of Behavior, 21, 519– 539. Buskist, W., & DeGrandpre, R. J. (1995). Schedulecontrolled responding of two persons under a single schedule of reinforcement. The Psychological Record, 45, 183–205. Catania, A. C., & Reynolds, G. R. (1968). A quantitative analysis of the responding maintained by interval schedules of reinforcement. Journal of the Experimental Analysis of Behavior, 11, 327–383. Chance, P. (1999). Learning and behavior. Pacific Grove, CA: Brooks/Cole. Critchfield, T. S., & Atteberry, T. (in press). Temporal discounting predicts individual competitive success in a human analogue of group foraging. Behavioural Processes. Critchfield, T. S., & Kollins, S. H. (2001). Temporal discounting: Basic research and the analysis of socially important behavior. Journal of Applied Behavior Analysis, 34, 101–122. Curtis, T. B., & Westerfield, D. L. (1992). Congressional intent. Westport, CT: Praeger. Davidson, R. H., & Oleszek, W. J. (2000). Congress and its members (6th ed.). Washington, DC: CQ Press. Dews, P. B. (1978). Studies on responding under fixed-interval schedules of reinforcement: II. The scalloped pattern of the cumulative record. Journal of the Experimental Analysis of Behavior, 29, 67– 75. Dukich, T. D., & Lee, A. E. (1973). A comparison of measures of responding under fixed-interval schedules. Journal of the Experimental Analysis of Behavior, 20, 281–290. Ferster, C. B., & Skinner, B. F. (1957). Schedules of reinforcement. New York: Appleton-CenturyCrofts. Ferster, C. B., & Zimmerman, J. (1963). Fixed-interval performances with added stimuli in mon-
484
THOMAS S. CRITCHFIELD et al.
keys. Journal of the Experimental Analysis of Behavior, 6, 317–322. Fry, W., Kelleher, R. T., & Cook, L. (1960). A mathematical index of performance on fixed-interval schedules of reinforcement. Journal of the Experimental Analysis of Behavior, 3, 193–199. Gentry, G. D., Weiss, B., & Laties, V. G. (1983). The micro-analysis of fixed-interval responding. Journal of the Experimental Analysis of Behavior, 39, 327–343. Gollub, L. R. (1964). The relations among measures of performance on fixed-interval schedules. Journal of the Experimental Analysis of Behavior, 7, 337–343. Herrick, R. M. (1969). Mathematical equivalence of three indexes of performance under a fixed-interval reinforcement schedule. Perceptual and Motor Skills, 28, 104. Herrnson, P. R. (2001). The money maze: Financing congressional elections. In L. C. Dodd & B. I. Oppenheimer (Eds.), Congress reconsidered (pp. 97–123). Washington, DC: CQ Press. Herrnstein, R. J., & Morse, W. H. (1958). A conjunctive schedule of reinforcement. Journal of the Experimental Analysis of Behavior, 1, 15–24. Hyten, C., & Madden, G. J. (1993). The scallop in human fixed-interval research: A review of problems with data description. The Psychological Record, 43, 471–500. Kraft, J. R., & Baum, W. M. (2001). Group choice: The ideal free distribution of human social behavior. Journal of the Experimental Analysis of Behavior, 76, 21–42. Laties, V. G., & Weiss, B. (1963). Effects of a concurrent task on fixed-interval responding in humans. Journal of the Experimental Analysis of Behavior, 6, 431–436. Leander, J. D., Milan, M. A., Jasper, K. B., & Heaton, K. L. (1972). Schedule control of the vocal behavior of Cebus monkeys. Journal of the Experimental Analysis of Behavior, 17, 229–235. Lewis, C., & The Center for Public Integrity. (1998). The buying of the Congress. New York: Avon Books. Long, E. R. (1962). Additional techniques for producing multiple-schedule control in children. Journal of the Experimental Analysis of Behavior, 5, 443–445. Lowe, C. F., Davey, G. C., & Harzem, P. (1974). Effects of reinforcement magnitude on interval and ratio schedules. Journal of the Experimental Analysis of Behavior, 22, 553–560. Mace, F. C., Lalli, J. S., Shea, M. C., & Nevin, J. A. (1992). Behavioral momentum in college basketball. Journal of Applied Behavior Analysis, 25, 657– 663. Madden, G. J., Peden, B. F., & Yamaguchi, T. (2002). Human group choice: Discrete-trial and free-op-
erant tests of the ideal free distribution. Journal of the Experimental Analysis of Behavior, 78, 1–15. Mayhew, D. R. (1974). Congress: The electoral connection. New Haven, CT: Yale University Press. Meck, W. H., & Church, R. M. (1984). Simultaneous temporal processing. Journal of Experimental Psychology: Animal Behavior Processes, 10, 1– 29. Moerk, E. L. (1990). Three-term contingency patterns in mother-child verbal interactions during first-language acquisition. Journal of the Experimental Analysis of Behavior, 54, 293–305. Murphy, W. F., & Danielson, M. N. (1977). American democracy. Hinsdale, IL: Dryden Press. Ornstein, N. J., Mann, T. E., & Malbin, M. J. (2000). Vital statistics on Congress 1999–2000. Washington, DC: AEI Press. Parker, G. R. (1989). Characteristics of Congress: Patterns in congressional behavior. Englewood Cliffs, NJ: Prentice Hall. Perone, M., & Courtney, K. (1992). Fixed-ratio pausing: Joint effects of past reinforcer magnitude and stimuli correlated with upcoming magnitude. Journal of the Experimental Analysis of Behavior, 57, 33–46. Poole, R., & Rosenthal, H. (1997). Congress: A political-economic history of roll call voting. New York: Oxford. Poppen, R. (1972). Effects of concurrent schedules on human fixed-interval performance. Journal of the Experimental Analysis of Behavior, 18, 119–127 Poppen, R. (1982a). The fixed-interval scallop in human affairs. The Behavior Analyst, 5, 127–136. Poppen, R. (1982b). Human fixed-interval performance on concurrent schedules: A parametric analysis. Journal of the Experimental Analysis of Behavior, 37, 251–266. Schneider, B. A. (1969). A two-state analysis of fixedinterval responding in the pigeon. Journal of the Experimental Analysis of Behavior, 12, 677–687. Segal, E. F. (1962). Exteroceptive control of fixedinterval responding. Journal of the Experimental Analysis of Behavior, 5, 49–57. Shull, R. L., Gulkey, M., & Witty, W. (1972). Changing the response unit from a single peck to a fixed number of pecks in fixed-interval schedules. Journal of the Experimental Analysis of Behavior, 17, 193–200. Shull, R. L., & Lawrence, P. S. (1998). Reinforcement: Schedule performance. In K. A. Lattal & M. Perone (Eds.), Handbook of research methods in human operant behavior (pp. 95–129). New York: Plenum. Skinner, B. F. (1938). The behavior of organisms. Englewood Cliffs, NJ: Prentice Hall. Skinner, B. F. (1953). Science and human behavior. New York: Free Press. Smith, S. S., & Gamm, G. (2001). The dynamics of party government in Congress. In L. C. Dodd &
PROCRASTINATION BY CONGRESS B. I. Oppenheimer (Eds.), Congress reconsidered (pp. 245–268). Washington, DC: CQ Press. Sokolowski, M. B. C., Tonneau, F., & Freixi I Baque, E. F. (1999). The ideal free distribution in humans: An experimental test. Psychonomic Bulletin & Review, 6, 157–161. Staddon, J. E. R. (1970). Efect of reinforcement duration on fixed-interval pausing. Journal of the Experimental Analysis of Behavior, 13, 9–11. Staddon, J. E. R., & Frank, J. A. (1975). The role of the peck-food contingency on fixed-interval schedules. Journal of the Experimental Analysis of Behavior, 23, 17–23. Stitzer, M. L. (1984). Verbal responding under a fixed-interval schedule: Effects of d-amphetamine. Pharmacology Biochemistry and Behavior, 21, 67– 72. Stubbs, D. A., Vautin, S. J., Reid, H. M., & Delehanty, D. L. (1978). Discriminative functions of schedule stimuli and memory: A combination of schedule and choice procedures. Journal of the Experimental Analysis of Behavior, 29, 167–180. Vollmer, T. R., & Bourret, J. (2000). An application
485
of the matching law to evaluate the allocation of two- and three-point shots by college basketball players. Journal of Applied Behavior Analysis, 33, 137–150. Vuchinich, R. E., & Tucker, J. A. (1996). Alcoholic relapse, life events, and behavioral theories of choice: A prospective analysis. Experimental and Clinical Psychopharmacology, 4, 19–28. Weiner, H. (1983). Some thoughts on discrepant human-animal performances under schedules of reinforcement. The Psychological Record, 33, 521– 532. Weisberg, P., & Waldrop, P. B. (1972). Fixed-interval work habits of Congress. Journal of Applied Behavior Analysis, 5, 93–97. Wolff, P. C., Burnstein, D. D., & Cannon, D. L. (1964). The use of schedules of reinforcement to regulate a collective team response rate. The Psychological Record, 14, 57–70. Received February 20, 2002 Final acceptance September 7, 2003 Action Editor, David Wacker
STUDY QUESTIONS
1. On what two assumptions did Brady base his statement that the congressional work environment resembles that of a fixed-interval schedule?
2. What is the major difference between laboratory-based studies on schedules of reinforcement and the current study?
3. Generally speaking, what does the index of curvature (IOC) measure? Describe the type of curve resulting from positive, negative, and zero IOC values.
4. What parallels between congressional bill passing and fixed-interval schedule performances did the authors make with the data presented in Figure 4?
5. Describe how congressional scalloping could be an artifact of the congressional workload (i.e., workload hypothesis). What data did the authors present to contradict the workload hypothesis?
6. Why was congressional scalloping also evaluated across a 2-year interval? What was the outcome of this evaluation?
7. Briefly describe the influence of hybrid contingencies, competing contingencies, and schedule-correlated stimuli on laboratory fixed-interval performance.
486
THOMAS S. CRITCHFIELD et al. 8. How did the authors explain the continuous patterns of scalloping in spite of the fact that (a) Congress is comprised of a group of people and (b) the composition of the group changes regularly?
Questions prepared by David Wilson and Leah Koehler, University of Florida