1
Title
2
Differential permissivity of human cerebrovascular endothelial cells to enterovirus infection
3
and specificities of enterovirus 71 in crossing an in vitro model of human blood brain barrier
4
Authors
5
Romain Volle1,2, Christine Archimbaud1,2, Pierre-Olivier Couraud4, Ignacio A. Romero5,
6
Babette Weksler6, Audrey Mirand1,2, Bruno Pereira3, Cécile Henquell2, Hélène Peigue-
7
Lafeuille1,2, and Jean-Luc Bailly1,2*
8
Affiliations
9
1 Clermont Université, Université d’Auvergne, EPIE, EA 4843, Clermont-Ferrand, France
10
2 CHU Clermont-Ferrand, Service de Virologie, Clermont-Ferrand, France
11
3
CHU Clermont-Ferrand, DRCI, Clermont-Ferrand, France
12
4
Inserm, U1016, Institut Cochin, Paris, France
13
5
Department of Life, Health and Chemical Sciences, Open University, Milton Keynes, U.K
14
6
Weill Cornell Medical College, New York, NY, USA
15
Running title
16
Impairment of the blood brain barrier by enteroviruses
17
Word counts: Abstract, 203; Main text, 5429
18
Correspondent footnote: Jean-Luc Bailly
19
Phone: +33 4 73 17 81 42; Fax: +33 4 73 75 48 51;
[email protected]
20
1
21
ABSTRACT
22
Human cerebral microvascular endothelial cells (hCMEC/D3 cell line) form a steady polarized
23
barrier when cultured in vitro on a permeable membrane. Their susceptibility to enterovirus
24
(EV) strains was analysed to investigate how these viruses may cross the blood-brain barrier.
25
A sample of 88 virus strains was selected on phylogenetic features among 44 epidemiologically
26
relevant types of the four EV species A–D. The EV-A71 genome was replicated at substantial
27
rates while the infectious virus was released at extremely low but sustained rates at both barrier
28
sides for at least 4 days. EV-A71 antigens were detected in a limited number of cells. The
29
properties of the endothelial barrier (structure and permeability) remained intact throughout
30
infection. The chronic EV-A71 infection was in sharp contrast with the productive infection of
31
cytolytic EVs (e.g. echoviruses 6 and 30). The hCMEC/D3 barriers infected with the latter EVs
32
exhibited elevated proportions of apoptotic and necrotic cells, which resulted in major injuries
33
to the endothelial barriers with dramatic increase of paracellular permeability and virus
34
crossing to the abluminal side. The following intracellular rearrangements were also seen: early
35
destruction of the actin cytoskeleton, remodelling of intracellular membranes, and
36
reorganization of the mitochondrion network in a small cluster near the perinuclear space.
37
2
38
INTRODUCTION
39
Enteroviruses (EVs; Picornaviridae) form a large group of non-enveloped enteric viruses, of
40
which more than 100 different serotypes are human pathogens classified within four taxonomic
41
species (EV-A to EV-D). Human EVs are transmitted through faecal-oral and respiratory
42
routes and they actively replicate in the mucosa and epithelial cells of the throat and intestinal
43
tract. Viral invasion of the intravascular space or viremia may result in spreading to sites such
44
as the skin, heart and central nervous system (CNS).
45
The most common clinical manifestation associated with CNS EV infections is aseptic
46
meningitis. Encephalitis, cerebellitis, myelitis, and poliomyelitis are also observed but less
47
frequently (Khetsuriani et al., 2006; Antona et al., 2007). There is evidence for hematogenous
48
and neural routes of poliovirus (PV) dissemination and both involve viremia (Sabin, 1956); the
49
two routes are not mutually exclusive. By the neural pathway, it is suggested that the virus is
50
conveyed by retrograde axonal transport from infected tissues to the CNS via peripheral nerves
51
(Ren & Racaniello, 1992; Gromeier & Wimmer, 1998). In mouse models, PV can be
52
transported along nerves through either a process involving the CD155 receptor or a receptor-
53
independent manner (Okha et al., 2012). Investigations with different animal models have
54
revealed a possible link between neurological injury caused by enterovirus A71 (EV-A71) and
55
retrograde axonal transport of the virus to the CNS (Chen et al., 2007; Khong et al., 2012). The
56
occurrence of encephalomyelitis and subsequent paralysis associated with these two EVs could
57
be explained by transport via the neural pathway but the inefficiency of the axonal transport
58
limits virus access to the CNS (Lancaster & Pfeiffer, 2010).
59
Alternatively, a virus in the bloodstream may enter the CNS by crossing the vascular
60
endothelium in the meninges, the choroid plexus, or the brain parenchyma. PV-1 was suggested
61
to cross the mouse blood-brain barrier (BBB) independently of the CD155 receptor and of
62
infected leucocytes (Yang et al., 1997). During EV-A71 infection, viremia early after the onset
3
63
of disease was related to severe CNS involvement in young children (Cheng et al., 2014) and
64
to neurological impairment in experimentally infected rhesus monkeys (Zhang et al., 2011). In
65
neonates infected with coxsackievirus B3 (CV-B3), a high blood viral load was related to
66
greater disease severity (Yen et al., 2007). Using sensitive quantitative gene amplification
67
techniques to amplify viral RNA from the cerebrospinal fluid (CSF), it is possible to detect
68
evidence of EV infection of the CNS in patients with aseptic meningitis early after the onset of
69
disease in both children and adults (Volle et al., 2014). Our current knowledge about the
70
processes involved in EV immigration into the CSF is still limited. As this inflammatory
71
disease of the subarachnoid space is common to most EV serotypes, it is assumed that viruses
72
travel through the blood, breaching the blood-CSF barrier either directly or through infected
73
leukocytes. A number of studies showed that PV, CV-B3, and EV-A71 can infect various
74
immune cells (Eberle et al., 1995; Vuorinen et al., 1996; Haddad et al., 2004; Wahid et al.,
75
2005a; 2005b; Tabor-Godwin et al., 2010). These data suggest a role of infected leukocytes in
76
EV dissemination to the CNS through a “Trojan-horse” process. In vitro studies showed the
77
susceptibility to different EVs of human vascular endothelial cells of different tissue
78
origins (Conaldi et al., 1997; Ylipaasto et al., 2010; Saijets et al., 2003; Liang et al., 2004;
79
Zanone et al., 2003; Bozym et al., 2010). In addition, PV-1 and CV-B3 induce different cell
80
signalling and endocytosis pathways in human brain microvascular endothelial cells
81
(HBMEC), which is suggestive of possible variations in BBB crossing between EV types
82
(Bozym et al., 2010; Coyne et al., 2007).
83
In this study we used the human cerebral microvessel endothelial cell line D3
84
(hCMEC/D3) as a model of brain endothelium (Weksler et al., 2005; 2013). The hCMEC/D3
85
cells were used as a model for investigating whether or not EVs can breach an endothelial
86
barrier. We first examined the susceptibility of hCMEC/D3 cells to infection by a set of 44 EV
87
serotypes and then analysed the ability of a subset of EVs to cross endothelial barriers.
88 4
89
RESULTS
90
Susceptibility of hCMEC/D3 cells to 44 EV types. We used a first set of 88 virus strains
91
(Table S1) chosen within species B (EV-B; n=37 types), EV-A (n=5), EV-C (n=1), and EV-D
92
(n=1). Susceptibility of hCMEC/D3 cells to EV strains was assessed in duplicate at 24 h p.i.
93
by measurement of the production of viral RNA and infectious virus (Fig. S1). The virus yield
94
exhibited a positive correlation (Spearman’s rho 77%, p-value 30%) was determined for
115
E-19, EV-B69, and E-1, and intermediate proportions of 10−30% were obtained with E-12 and
116
E-16 (Fig. 1c). Less than 10% of infected cells were counted for virus strains of various types
117
(E-30, E-3, E-7, CV-B6, E-4, E-14, E-18, EV-A71, E-9, E-32, CV-B3, and E-25). About 20
118
infected cells per cm² were counted for E-27 and E-11, and only 3−5 infected cells per cm² for
119
EV-B70, EV-B77, CV-A9, E-15, E-24, and E-26 (data not shown). Two E-6 and E-13 strains
120
exhibited different infection efficiencies (E-6/CF2660-01 >30%; E-6/CF158061-11 and E-
121
13/CF1275-00 10−30%; E-13/CF1925-01 50% were found with E-1 and EV-B69, and cell death resulted from both necrosis and
130
apoptosis. Intermediate cell mortality rates between 40 to 50% were estimated for E-12, E-
131
6/CF2660-01, and E-30/CF282-97. Other virus strains of the two latter types caused lower cell
132
mortality (30−40%). Two E-13 strains were related to different cell mortality rates (CF1274-
133
00, 38.3%; CF1925-01, 6 log10 copies) was detected at 6 h p.i. at both barrier sides, but in
155
the abluminal compartment, viruses were detectable below the titration threshold for E-12 and
156
E-30. The release of infectious progeny reached highest levels at 24−48 h p.i. Scanning electron
157
microscopy (SEM) allowed the identification of three main cytological alterations (Fig. 4).
158
Compared to mock infected controls, which had the appearance of joined cobblestones (Fig.
159
4a−4c), the infected endothelial barriers exhibited cells with structural features suggestive of
160
necrosis (damage plasma membrane) and apoptosis (preserved and budded plasma membrane),
161
indicated, respectively, by red and green arrow heads in Fig. 4d−4l. Rounded cells without
162
apparent altered plasma membrane were suggestive of early steps of cell death (see blue arrow
163
heads). On the basis of these analyses, we found evidence of large amounts of altered cells,
7
164
which caused breaches within endothelial barriers, as indicated by the visualization of pores of
165
the microporous membrane (white arrow heads).
166
The paracellular permeability of endothelial barriers infected with the EV-A71 strains
167
(genogroups C1 and C2) was maintained at levels similar to those of mock-infected barriers
168
until 96 h p.i. (Fig. 3e and 3f). The abluminal release of EV-A71 genomes and infectious virus
169
was highest at 24 h p.i. and remained constant at slightly lower levels up to 96 h p.i. The
170
infectious progeny was below the titration threshold at the abluminal side after 24 h p.i., but
171
was consistently determined at low levels at the luminal side. SEM observations showed few
172
groups of infected cells and a limited number of small breaches (Fig. 4m−4o).
173 174
Intracellular changes in endothelial barriers during EV infection. The endothelial barriers
175
were analysed by TEM to visualize the intracellular features of infected hCMEC/D3 cells and
176
to investigate variations between EV types. The altered cells of endothelial barriers infected
177
with the E-6/CF2660-01 strain displayed features indicative of virus infection, which were
178
similar to those caused by E-30 and E-12 (data not shown). At 24 h p.i., the impaired cells
179
displayed shrunken nuclei relocated near the cell membrane and contained myriads of virus-
180
induced vesicle-like membranous structures, 200 nm in diameter (Fig. 5a and 5b). These
181
structures had either single or double membranes and were organized in extensive intracellular
182
arrangements (Fig. 5c). Some infected cells showed evidence of tubular structures with
183
positive membrane invagination that enclosed cytoplasmic components (Fig. 5d). Clusters of
184
electron-dense granules between membranous structures were suggestive of viral particles
185
(Fig. 5e). Mitochondria were grouped near the membranous structures, which contrasted with
186
mock-infected cells, in which mitochondria formed an extensive network (Fig. S4). Large
187
single-membrane vesicles (600−1000 nm in diameter) contained electron-dense cytoplasmic
188
material and multilamellar structures resembling autophagic vacuoles (Fig. 5c).
8
189
In contrast to the features described above, the impaired cells of endothelial barriers
190
infected with EV-A71/CF166105-10 displayed a number of structural variations. As shown in
191
Fig. 6a–6d, the EV-A71 infected cells maintained an elongated shape and contained nuclei
192
similar in shape to those seen in control barriers. Remodelling of intracellular components
193
included vesicle-like structures and mitochondria clustered near the nucleus whereas EV-A71-
194
induced membranous structures had a uniform round shape with a diameter of 500 nm and a
195
multilamelar structure (Fig. 6e–6i).
196 197
Intracellular injury patterns common to EV types. The early virus-induced intracellular
198
injuries at 6 h p.i. were further analysed by confocal microscopy and viral replication was
199
detected by staining the VP1 protein. The infected cells displayed major reduction in staining
200
of polymerized actin in comparison to controls (Fig. 7a−7r vs Fig. 7s−7u). This indicates
201
effective cytoskeleton impairment early after the initiation of viral protein synthesis and would
202
explain the subsequent cell rounding.
203
Early virus-induced changes in the mitochondrion network were analysed with a
204
fluorescent probe that accumulates in active mitochondria. Mitochondria were stained in all
205
virus-infected cells (Fig. 8a−8o) but, in contrast to mock-infected controls, they were clustered
206
in a perinuclear area (Fig. 8p−8r). Rearrangement of the mitochondrion network was marked
207
in cells exhibiting prominent staining of the VP1 protein at 6 h p.i. (see white arrowheads).
208
Cells with reduced VP1 staining exhibited no or minor changes in the mitochondrion network
209
(see yellow arrowheads). Mitochondrion clustering was dependent on viral replication
210
intensity but was not directly related to cell rounding, since cells that were not yet round were
211
also displaying clustered mitochondria.
212
9
213
DISCUSSION
214
Human EV infections are associated with meningitis, encephalitis, and encephalomyelitis but
215
our current knowledge about CNS invasion by enteric viruses is still scant. The BBB may
216
represent a common entry pathway for EVs during viremia, which precedes disease onset. In
217
this study, we used the human cerebral microvascular endothelial cell line hCMEC/D3 as a
218
model system for investigating EV entry routes into the CNS through the human BBB. We
219
showed that the hCMEC/D3 cells were permissive to infection by a large array of EVs and
220
found major differences between types and genogroups. Most EV strains occupied a central
221
position in the susceptibility spectrum of hCMEC/D3 cells, notably the E-6, E-13, and E-30
222
strains, and intratypic variations may be related to individual genetic differences among
223
genogroups and subgenogroups. A wide range of cellular receptors has been observed in
224
human EVs (reviewed in Merilahti et al., 2012). Although we did not examine the binding
225
processes of EVs to the hCMEC/D3 cell surface, there is a large body of earlier experimental
226
evidence to suggest that the intertypic variations in hCMEC/D3 susceptibility to EVs can be
227
attributed to their propensity for using a wide range of receptors and internalization processes
228
(Ylipaasto et al., 2010; Coyne et al., 2007; Bozym et al., 2010). For instance, E-1 stands apart
229
within the susceptibility spectrum of hCMEC/D3 cells to EV infection, a pattern which may
230
be related to the fact that it is the only type known to bind integrin α2β1 (Bergelson et al.,
231
1993). A number of EV types examined in our study (E-6, E-11, E-12, E-13, and E-30) bind
232
the same cellular receptor CD55 (Bergelson et al., 1995). Yet, the virus strains of these types
233
did not cluster in the same area of the susceptibility spectrum of hCMEC/D3 cells. This
234
suggests that additional factors other than canonical receptors should be considered and that
235
genogroup features may be involved.
236
Our investigation provides evidence of two major clusters among EV types. A first
237
cluster consists of the EVs that exhibit a highly cytolytic phenotype, produce infectious
10
238
progeny, and induce extensive disruption of the endothelial barrier. Early during cellular
239
infection by these viruses, the amount of virus genomes released in the abluminal compartment
240
was >10,000 times higher than that of infectious progeny. We assumed that paracellular
241
transport of viral RNA and defective virus particles was not involved because barrier
242
permeability to the fluorescent reporter was not yet compromised at this time, a hypothesis that
243
is also supported by SEM observations. At 24 h p.i., the difference between the release of viral
244
genomes and virus particles was substantially reduced at the abluminal side as a result of the
245
destruction of the endothelial barrier caused by infected dying cells. In contrast, the release of
246
genomic material was relatively constant over time at the luminal sides. Accordingly, massive
247
amounts of viral genomes appeared to drain off the cells through their basolateral membrane
248
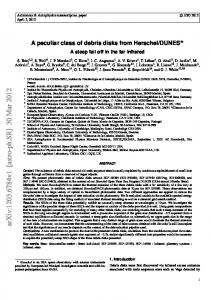
early during infection by a yet unknown process.
249
The second cluster comprises CV-B and EV-A71 types, which produced no impairment
250
of the in vitro model of endothelium barrier. A key observation, in sharp contrast with the
251
above data, is that hCMEC/D3 cells are moderately permissive to EV-A71 infection. This
252
pattern resulted from a high replication rate of the viral genome but a remarkably poor
253
production of infectious viruses. Both the virus and viral RNA were released from the luminal
254
and basolateral sides of the endothelial barrier but at disproportionately different rates as the
255
infectious virus was consistently detected at minute amounts. This process was maintained for
256
at least 4 days and did not induce a breakdown of the barrier nor changed the paracellular
257
permeability as measured with the LY surrogate marker. This non-disruptive pattern occurred
258
even when the barriers were inoculated with a MOI of about 100 TCID50 per cell (data not
259
shown), which suggests that it was not dependent on the initial infection conditions but was
260
more probably related to post-entry factors. A non-disruptive and long-term replication pattern
261
was also shown for CV-B3 and CV-B5 (data not shown). A persistent replication was reported
262
earlier for CV-B3 and CV-B4 in human dermal microvascular endothelial cells (Zanone et al.,
11
263
2003). A flavivirus West Nile virus can cross in vitro BBB models by infection of endothelial
264
cells (Verma et al., 2009). The brain endothelium crossing and infection by West Nile virus is
265
not related to direct disturbance of the endothelial barrier integrity in vitro, as observed in our
266
study for EV-A71 and CV-B. The loss of BBB integrity associated with the West Nile virus
267
may be related to up regulation of cell adhesion molecules (e.g. VCAM-I, E-Selectin) in
268
infected endothelial cells, thus promoting trans endothelial migration of leucocytes in vivo
269
(Verma et al., 2009; 2010).
270
The infected cells showed typical ultrastructural features of a picornavirus infection.
271
We found evidence for both apoptosis and necrosis among infected cells regardless of the EV
272
type, in agreement with data indicating a competition between cell death pathways and
273
picornavirus replication (Agol & Gmyl, 2010). We also observed disruption of the actin
274
cytoskeleton network and that of intercellular junctions as evidenced by the rounding of
275
infected cells. The actin cytoskeleton has an important role in the maintenance of stable inter
276
endothelial junctions and prevents paracellular transport to the brain (Stamatovic et al., 2012;
277
Spindler & Hsu, 2012). Remodelling of intracellular membranes was the third hallmark of a
278
picornavirus infection seen in infected hCMEC/D3 cells but discrete variations occurred
279
between echoviruses (E-6, E-12, and E-30) and EV-A71. In the echovirus infections, we found
280
evidence of single and double membrane vesicles organized in compact arrangements near the
281
nucleus and of structures that displayed positive membrane invagination. Both features were
282
reported earlier in Vero and Hela cells infected by CV-B3 and PV-1, respectively (Limpens et
283
al., 2011; Belov et al., 2012). The vesicular structure in the EV-A71 infected hCMEC/D3 cells
284
was characterised by less condensed vesicles and an increased proportion of multilamellar and
285
large vesicles. Finally, our analyses with TEM and fluorescence microscopy showed clustering
286
of the mitochondrion network, a previously unobserved feature of EV infections that occurred
287
early during the virus infection and whose origin is still unclear. It may be related to virus-
12
288
induced disruption of microtubules, as suggested for cells infected with the hepatitis B virus
289
(Kim et al., 2007). A similar feature was also reported for African swine fever virus, another
290
DNA virus, and was related to coupling between viral translation and ATP synthesis (Rojo et
291
al., 1998).
292
The most frequent EV infections of the CNS cause meningitis as a result of virus
293
replication in the cells of the leptomeninges, the brain coverings (Rotbart, 1995). These
294
infections are usually self-limited because the meninges are directly accessible to immunologic
295
surveillance and subject to rapid immune responses (Engelhardt & Coisne, 2011). The varying
296
amounts of viruses in the CSF of patients with EV meningitis within few hours after the onset
297
of symptoms (Volle et al., 2014) may reflect virus unloading from these infected sites. The
298
meningeal blood vessels, which form the barrier between blood and CSF, are only made of
299
non-fenestrated endothelial cells; this contrasts with the BBB, which includes other cell types.
300
Accordingly, our endothelium model is consistent with the blood-CSF barrier. The infection
301
of endothelial cells reported in this study for a large array of EV types may occur during the
302
earliest stages of viremia, which develops following EV replication in peripheral tissues. The
303
local EV replication may contribute to infection of leptomeninges and development of a neuro-
304
inflammatory disease. Of note, regional blood flow reduction and cerebral vasculitis can be
305
observed in children with E-30 aseptic meningitis (Nishikawa et al., 2000). Care must be taken
306
in making generalised conclusions of pathophysiology based on in vitro model systems and
307
the transcellular passage for neural spread of EVs requires close examination in an appropriate
308
in vivo model.
309
13
310
MATERIALS AND METHODS
311
Cell lines and viruses. HCMECs were grown in EBM-2 basal medium (Lonza) supplemented
312
with 5% fetal bovine serum (FBS), 1% penicillin (10,000U), 1% streptomycin (10mg/ml; GE
313
Healthcare Life Science), 1% chemically defined lipid concentrate (Invitrogen), 10 mM of
314
HEPES, 1.4 μM of hydrocortisone (Sigma Aldrich), 1.5 μg×ml-1 of ascorbic acid (Sigma
315
Aldrich), and 200 ng×ml-1 of basal fibroblast growth factor (Sigma Aldrich). The cells were
316
seeded for all experiments on rat collagen I-coated culture surfaces (RD-System). The
317
rabdomyosarcoma (RD) cells were grown in RPMI 1640 medium (Lonza) with 1%
318
penicillin/streptomycin, and 4% FBS. The buccal epithelial carcinoma (KB) cells were grown
319
in DMEM basal medium (GE Healthcare Life Science) with 1% penicillin/streptomycin, and
320
6% FBS. All cell cultures were maintained at 37°C in a humidified atmosphere containing 5%
321
CO2.
322
A sample of 88 EV strains, comprising 23 reference strains and 65 clinical isolates,
323
recovered from patient specimens (CSF, stool or throat) was used in the study (Table S1).
324
Virus stocks were prepared with KB (coxsackievirus B) and RD cells (other EVs) and stored
325
at −20°C. Titration of viral suspensions was done using our end point dilution assay (Bailly et
326
al., 1991). The cell cultures were inoculated at a multiplicity of infection (MOI) of 5 for 1 h at
327
37°C in all experiments; after washing with PBS, they were incubated for the indicated times.
328
Extraction of nucleic acids and EV real-time RT-qPCR. Nucleic acids were extracted from
329
200 µl from supernatants or the whole cells and supernatant using the NucliSens®EasyMAG™
330
extractor (bioMérieux) and were eluted with 25 µl of the elution buffer provided by the
331
manufacturer. A previously described competitive internal control was added during the
332
extraction step and amplified in our in-house RT-qPCR assay (Volle et al., 2012).
333
Viability of infected hCMEC/D3 cells. Cells were infected separately by 15 EV strains. After
334
two washes at 24 h p.i., the cells were detached, centrifuged for 10 min at 1000g, stained with
14
335
the Apoptotic/Necrotic/Healthy Cells Detection Kit (Promokine), and analysed by flow
336
cytometry (BD-LSRII, BD Bioscience). Cells were considered as being viable when only
337
stained with the Hoechst compound, apoptotic when only stained with the Annexin V
338
conjugated antibody, or necrotic when they were stained with both Annexin V and ethidium
339
homodimere III. Cell fragments were detected through ethidium homodimere III staining
340
alone.
341
Fluorescent microscopy. HCMEC/D3 cells were grown in chamber slides, infected for 6
342
hours by different EV strains, and fixed with 4% paraformaldehyde for 10 min. For
343
mitochondria staining, the cells were incubated at 37°C for 1 h before fixation, with complete
344
EBM-2 medium containing 50 nM of MitoTracker® Mitochondrion-Selective probe M7510
345
(Invitrogen) in a humidified atmosphere of 5% CO2. Cells were permeabilized with 0.5%
346
Triton X100 in PBS for 5 min, saturated for 10 min with 5% BSA in PBS, and incubated
347
overnight at 4°C with mouse primary monoclonal antibodies against the EV capsid protein
348
VP1 (Diagnostic Hybrid). After three PBS washes, incubation was pursued for 1 h at 37°C in
349
a solution of anti-mouse secondary antibodies conjugated to Dyelight488 (Anticorps enligne).
350
In the tests for which active mitochondria staining was not required, red-phalloïdin used for
351
actin staining was included in the secondary antibody solution. After three PBS washes, nuclear
352
DNA was counterstained with a Hoechst solution (Promokine). The slides were mounted with
353
coverslips and observed with an epifluorescence microscope (Olympus BX41) or scanning
354
confocal microscope (LSM 510, Carl Zeiss MicroImaging Inc.). Automated image analysis
355
(FIJI software) was used to calculate the number of infected cells.
356
EV crossing through an in vitro model of brain microvascular endothelial barrier. To
357
obtain microvascular endothelial barriers, hCMEC/D3 cells were cultured on a permeable
358
membrane (0.4 μm pore) placed in the upper chamber of a Transwell device (12-well plate,
359
Corning). The upper chamber was seeded with 40,000 cells/cm² and incubated for 5 to 7 days
15
360
to obtain a tight confluent cell monolayer. In this in vitro model, the cells are polarized and
361
display a luminal side and an abluminal side (Weksler et al., 2005). The luminal sides of non-
362
permeable barriers were exposed separately to various EV strains, the infected barriers were
363
incubated for the indicated times, and permeability was determined at each time p.i. (see
364
below). The yield of infectious particles and the total amount of viral genome released through
365
the abluminal and luminal sides were determined as described above.
366
Lucifer Yellow permeability assay. The paracellular seal of the endothelial barrier was
367
determined in triplicate by testing the permeability to the Lucifer Yellow marker (LY, Sigma).
368
The cell monolayers were washed twice with collecting buffer consisting of HBSS (GE
369
Healthcare Life Science) supplemented with 1% of HEPES (GE Healthcare Life Science) and
370
1% of sodium pyruvate (GE Healthcare Life Science). The LY marker (50 µM; 400 µl) was
371
added to the upper chamber. Cells were incubated at 37°C (5% CO2 and 100% humidity) in
372
three successive collecting wells, each containing 1.6 ml of collecting buffer, for respectively
373
10, 15, and 20 min. The LY concentration in the collecting buffer of each well and the stock
374
LY solution were determined by fluorometry. Parallel negative control tests were performed
375
with cell-free collagen-coated culture membranes. Samples were analysed in black 96-well
376
microtiter plates using a Fluoroskan Ascent FL fluorometer (Thermo Electron Corporation,
377
France) at 485 and 538 nm wavelengths for excitation and emission, respectively.
378
Scanning and transmission electron microscopy (SEM and TEM). The endothelial barriers
379
were washed with 0.2M Na cacodylate buffer (NCB; pH 7.4) and fixed overnight at 4°C in
380
1.6% glutaraldehyde-NCB. The cells were fixed for 1 h with 1% OsO4 in NCB. For SEM
381
preparation, cells were dehydrated in graded ethanol, followed by critical point drying with
382
100% ethanol and hexamethyldisilasane (1:1) for 10 min, sputter-coated with gold (JEOL JFC-
383
1300), and observed at 5kV with a JEOL 6060-LV microscope. For TEM preparation, cells
384
were dehydrated in graded ethanol, infiltrated sequentially with three mixtures of
16
385
ethanol/EPON resin (2:1, 1:1, and 1:2) for 1 h each, embedded in EPON resin overnight at
386
room temperature, and cured 2 days in a 60°C oven. Thin sections (70 nm, UC6
387
ultramicrotome, Leica) were stained with uranyl acetate and Pb citrate, and observed at 80 kV
388
with a Hitachi H-7650 microscope. All chemical products were provided by Delta
389
Microscopies.
390
Statistical Analysis. Statistical analyses were made with software Stata (version 12,
391
StataCorp, College Station, US). Tests were two-sided, with a type I error set at a=0.05.
392
Quantitative data are expressed as means (and associated standard deviation, Gaussian
393
distribution verified by the Shapiro-Wilk test). Correlated data were analysed by mixed models
394
to study the evolution of parameters taking into account between and within strain variability
395
(random effects such as intercept and slope). These analyses were completed by ANOVA for
396
repeated measures followed by post-hoc Tukey-Kramer test. Principal component analysis was
397
done to explore the relation between several quantitative parameters. Correlation coefficients
398
(Pearson or Spearman when appropriate) were calculated to quantify these relations.
399
17
400
LEGENDS TO FIGURES
401
Fig. 1. Heterogeneity of enterovirus infection in hCMEC/D3 cells. Replication in
402
hCMEC/D3 cells of EV strains selected among species, types, and genogroups was examined
403
at 24 h p.i. (a) Data are represented as means of two independent assays and given as the
404
number of viral genome copies per cell (x-axis) and of infectious particles per cell (y-axis).
405
Correlation between the yield of virus genome and yield of infectious virus is indicated. (b)
406
Replication kinetics of virus strains of four EV types in hCMEC/D3 cells. Data are
407
representative of means of three independent replicates for each virus E-30 (●), E-6 (▲), E-12
408
(♦), and EV-A71 (×). (c) Susceptibility spectrum of the hCMEC/D3 cell line to EVs estimated
409
as the proportion of infected cells at 6 h p.i. A sample of 24 viral strains representing 19
410
different types was tested. Green and blue fluorescence indicate the VP1 protein and the nuclei,
411
respectively. Scale bar, 100 µm. Data are represented as mean ± SD of three experiments. (d)
412
Comparison of cell mortality rates at 24 h p.i. (n=15 EV strains). Data are represented as mean
413
± SD of four independent experiments. The blue line indicates the cell mortality rate (10%) in
414
mock-infected cells (NoV).
415 416
Fig. 2. Principal component analysis of enterovirus replication in hCMEC/D3 cells.
417
Ordination of the data obtained for 15 EV strains using principal component analysis. The
418
horizontal axis is linked to cell sensitivity to EVs and the vertical axis to virus production.
419 420
Fig. 3. Disruption of a microvascular endothelial barrier during enterovirus infection.
421
Endothelial barriers of hCMEC/D3 cells produced on Transwell® membranes were infected
422
with E-6/CF2660-01 (a), E-11/CF228046-07 (b), E-12/CF1157-91 (c), E-30/CF2575-00 (d),
423
EV-71/CF166105-10 (e), and EV-A71/CF160019-10 (f). At the indicated time points, the
424
culture mediums in the luminal and abluminal compartments were collected and stored
18
425
separately. Paracellular permeability was measured. Data are indicated as mean ± SD of three
426
experiments. The number of EV genome copies and infectious virus particles are respectively
427
indicated with white and light grey bars for the luminal compartment, and respectively with
428
dark grey and dashed bars for the abluminal compartment. Permeability coefficients for mock
429
infected and infected barriers are indicated with green and red lines, respectively.
430 431
Fig. 4. Disruption of endothelial barriers during enterovirus infection. The hCMEC/D3
432
barriers were analysed with SEM at 24 h p.i. Representative fields of duplicate experiments
433
are shown: mock-infected monolayers (a–c), and barriers infected with E-6/CF2660-01 (d–f),
434
E-12/CF1157-91 (g–i), E-30/CF2575-00 (j–l), and EV-A71/CF166105-10 (m–o). White arrow
435
head, breach of the endothelial barriers; red and green arrow heads, cells with a necrotic and
436
an apoptotic shape, respectively; blue arrow head, round cell with no sign of altered plasma
437
membrane.
438 439
Fig. 5. Ultrastructural features at 24 h p.i. of hCMEC/D3 barriers infected with an E-6
440
strain. The infected hCMEC/D3 barriers were observed at low magnification with TEM (a and
441
b). Virus-induced reorganization of cytoplasmic elements (c). Features of the vesicular
442
structures (d). Dense electron punctuation suggestive of virus aggregates (e). Bars, 4 µm (a and
443
b); 500 nm (c–e). Representative fields of duplicate experiments are shown; mock-infected
444
cells are shown in figure S4. Abbreviations: N, nucleus; M, mitochondria; MC, membranous
445
replication complex; A, autolysosome/amphisome; V, virus aggregates.
446 447
Fig. 6. Ultrastructural features at 24 h p.i. of hCMEC/D3 barriers infected with an EV-
448
A71 strain. The infected hCMEC/D3 barriers were analysed at low magnification with TEM;
449
unaltered cells (a and b) and altered cells with virus-induced vesicular structures (c and d).
19
450
Features of the vesicular structures (e–i). Bar, 10 µm (a–d); 1 µm (e and f); 500 nm (g–i).
451
Representative fields of duplicate experiments are shown; mock-infected cells are shown in
452
figure S4. Abbreviations: N, nucleus; M, mitochondria; MC, membranous replication complex.
453 454
Fig. 7. The actin cytoskeleton network is disrupted in enterovirus-infected hCMEC/D3
455
cells. The hCMEC/D3 cells were analysed at 6 h p.i. during replication of strains E-12/CF1157-
456
91 (a−c), E-6/CF2660-01 (d−i), E-30/CF2575-00 (j–l), E-11/CF228046-07 (m–o), and EV-
457
A71/CF166105-10 (p–r); mock-infected cells (s–u). Actin network is shown in red, VP1 capsid
458
protein in green, and nuclei in blue. Bars represent 10 µm. White arrow heads indicate
459
intermediate disruption of actin cytoskeleton.
460 461
Fig. 8. Perinuclear relocation of active mitochondria in enterovirus-infected hCMEC/D3
462
cells. The hCMEC/D3 cells were analysed at 6 h p.i. during replication of E-12/CF1157-91
463
(a−c), E-6/CF2660-01 (d−f), E-30/CF2575-00 (g–i), E-11/CF228046-07 (j–l), and EV-
464
A71/CF166105-10 (m–o); mock-infected cells (s–u). Active mitochondria are shown in red,
465
VP1 capsid protein in green, and nuclei in blue. Bars represent 10 µm. White and yellow arrow
466
heads indicate dense clusters and intermediate clustering of mitochondria, respectively.
467
20
468
ACKNOWLEDGEMENTS
469
The authors acknowledge the technical contribution of Gwendoline Jugie, Nathalie Rodde, and
470
Isabelle Simon for helpful assistance in virus culture and sequencing. We thank Mr. Jeffrey
471
Watts for help with preparing the English manuscript. Fluorescence confocal microscopy
472
observations were done at the ICCF (Imagerie Confocale de Clermont-Ferrand) Centre, France.
473
TEM and SEM observations were done at the Centre d’Imagerie Cellulaire Santé (Clermont-
474
Ferrand, France).
475
21
476
REFERENCES
477 478 479 480 481 482 483 484 485 486 487 488 489 490 491 492 493 494 495 496 497 498 499 500 501 502 503 504 505 506 507 508 509 510 511 512 513 514 515 516 517 518 519 520 521 522 523 524
Agol, V. I. & Gmyl, A. P. (2010). Viral security proteins: counteracting host defences. Nat Rev Microbiol 8, 867–878. Antona, D., Lévêque, N., Chomel, J. J., Dubrou, S., Lévy-Bruhl, D. & Lina, B. (2007). Surveillance of enteroviruses in France, 2000-2004. Eur J Clin Microbiol Infect Dis 26, 403– 412. Bailly, J. L., Chambon, M., Peigue-Lafeuille, H., Laveran, H., De Champs, C. & Beytout, D. (1991). Activity of glutaraldehyde at low concentrations (less than 2%) against poliovirus and its relevance to gastrointestinal endoscope disinfection procedures. Appl Environ Microbiol 57, 1156–1160. Belov, G. A., Nair, V., Hansen, B. T., Hoyt, F. H., Fischer, E. R. & Ehrenfeld, E. (2012). Complex dynamic development of poliovirus membranous replication complexes. J Virol 86, 302–312. Bergelson, J. M., Chan, M., Solomon, K. R., St John, N. F., Lin, H. & Finberg, R. W. (1995). Decay-accelerating factor (CD55), a glycosylphosphatidylinositol-anchored complement regulatory protein, is a receptor for several echoviruses. PNAS (USA) 91, 6245– 6248. Bergelson, J. M., St John, N., Kawaguchi, S., Chan, M., Stubdal, H., Modlin, J. & Finberg, R. W. (1993). Infection by Echoviruses 1 and 8 Depends on the cx2 Subunit of Human VLA-2. J Virol 67, 6847–6852. Bozym, R. A., Morosky, S. A., Kim, K. S., Cherry, S. & Coyne, C. B. (2010). Release of intracellular calcium stores facilitates coxsackievirus entry into polarized endothelial cells. PLoS Pathog 6, e1001135. Conaldi, P. G., Serra, C., Mossa, A., Falcone, V., Basolo, F., Camussi, G., Dolei, A. & Toniolo, A. (1997). Persistent infection of human vascular endothelial cells by group B coxsackieviruses. J Infect Dis 175, 693-696. Chen, C. S., Yao, Y. C., Lin, S. C., Lee, Y. P., Wang, Y. F., Wang, J. R., Liu, C. C., Lei, H. Y. & Yu, C. K. (2007). Retrograde axonal transport: a major transmission route of enterovirus 71 in mice. J Virol 81, 8996–9003. Cheng, H. Y., Huang, Y. C., Yen, T. Y., Hsia, S. H., Hsieh, Y. C., Li, C. C., Chang, L. Y., & Huang, L. M. (2014). The correlation between the presence of viremia and clinical severity in patients with enterovirus 71 infection: a multi-center cohort study. BMC Infect Dis 14, 417. Coyne, C. B., Kim, K. S. & Bergelson, J. M. (2007). Poliovirus entry into human brain microvascular cells requires receptor-induced activation of SHP-2. EMBO J 26, 4016–4028. Eberle, K. E., Nguyen, V. T. & Freistadt, M. S. (1995). Low levels of poliovirus replication in primary human monocytes: possible interactions with lymphocytes. Arch Virol 140, 21352150.
22
525 526 527 528 529 530 531 532 533 534 535 536 537 538 539 540 541 542 543 544 545 546 547 548 549 550 551 552 553 554 555 556 557 558 559 560 561 562 563 564 565 566 567 568 569 570 571 572 573 574
Engelhardt, B. & Coisne, C. (2011). Fluids and barriers of the CNS establish immune privilege by confining immune surveillance to a two-walled castle moat surrounding the CNS castle. Fluids and Barriers of the CNS 8, 4. Gromeier, M., & Wimmer E. (1998). Mechanism of injury-provoked poliomyelitis. J Virol 72, 5056–5060. Haddad, A., Nokhbeh, M. R., Alexander, D. A., Dawe, S. J., Grisé, C., Gulzar, N. & Dimock, K. (2004). Binding to decay-accelerating factor is not required for infection of human leukocyte cell lines by enterovirus 70. J Virol 78, 2674-2681. Khetsuriani, N., Lamonte-Fowlkes, A., Oberste, S. & Pallansch, M. A. (2006). Centers for Disease Control and Prevention. Enterovirus surveillance-United States, 1970-2005. MMWR Surveill Summ 55, 1–20. Kim, S., Kim, H. Y., Lee, S., Kim, S. W., Sohn, S., Kim, K. & Cho, H. (2007). Hepatitis B virus x protein induces perinuclear mitochondrial clustering in microtubule- and Dyneindependent manners. J Virol 81, 1714–1726. Khong, W. X., Yan, B., Yeo, H., Tan, E. L., Ng, J. K. W., Chow, V. T. & Alonso, S. (2012). A non-mouse-adapted enterovirus 71 (EV71) strain exhibits neurotropism, causing neurological manifestations in a novel mouse model of EV71 infection. J Virol 86, 2121–2131. Lancaster, K. Z., & Pfeiffer, J. K. (2010). Limited trafficking of a neurotropic virus through inefficient retrograde axonal transport and the type I interferon response. PLoS Pathog 6, e1000791. Liang, C. C., Sun, M. J., Lei, H. Y., Chen, S. H., Yu, C. K., Liu, C. C., Wang, J. R., & Yeh TM. (2004). Human endothelial cell activation and apoptosis induced by enterovirus 71 infection. J Med Virol 74, 597-603. Limpens, R. W., van der Schaar, H. M., Kumar, D., Koster, A. J., Snijder, E. J., van Kuppeveld, F. J. & Bárcena, M. (2011). The transformation of enterovirus replication structures: a three-dimensional study of single- and double-membrane compartments. MBio 2, 00166–11. Merilahti, P., Koskinen, S., Heikkilä, O., Karelehto, E. & Susi, P. (2012). Endocytosis of integrin-binding human picornaviruses. Adv Virol 2012, 547530. Nishikawa, M., Matsubara, T., Yoshitomi, T., Ichiyama, T., Hayashi, T. & Furukawa, S. (2000). Abnormalities of brain perfusion in echovirus type 30 meningitis. J Neurol Sci 179, 122 – 126. Ohka, S., Nihei, C., Yamazaki, M. & Nomoto, A. (2012). Poliovirus trafficking toward central nervous system via human poliovirus receptor-dependent and –independent pathway. Frontiers Microbiol 2012, 00147. Rotbart, H. A. (1995). Meningitis and encephalitis. In Human enterovirus infections, pp 271289. Edited by H. A. Rotbart. Washington D. C., ASM Press.
23
575 576 577 578 579 580 581 582 583 584 585 586 587 588 589 590 591 592 593 594 595 596 597 598 599 600 601 602 603 604 605 606 607 608 609 610 611 612 613 614 615 616 617 618 619 620 621 622
Ren, R. & Racaniello, V. R. (1992). Poliovirus spreads from muscle to the central nervous system by neural pathways. J Infect Dis 166, 747–752. Rojo, G., Chamorro, M., Salas, M. L., Viñuela, E., Cuezva, J. M. & Salas, J. (1998). Migration of mitochondria to viral assembly sites in African swine fever virus-infected cells. J Virol 72, 7583–7588. Sabin, A. B. (1956). Pathogenesis of poliomyelitis; reappraisal in the light of new data. Science 123, 1151-1157. Saijets, S., Ylipaasto, P., Vaarala, O., Hovi, T., & Roivainen, M. (2003). Enterovirus infection and activation of human umbilical vein endothelial cells. J Med Virol 70, 430-439. Spindler, K. R. & Hsu, T. H. (2012). Viral disruption of the blood-brain barrier. Trends Microbiol 20, 282–290. Stamatovic, S. M., Sladojevic, N., Keep, R. F. & Andjelkovic, A. V. (2012). Relocalization of junctional adhesion molecule A during inflammatory stimulation of brain endothelial cells. Mol Cell Biol 32, 3414–3427. Tabor-Godwin, J. M., Ruller, C. M., Bagalso, N., An, N., Pagarigan, R, R., Harkins, S., Gilbert, P. E., Kiosses, W. B., Gude, N. A., Cornell, C. T. & other authors (2010). A novel population of myeloid cells responding to coxsackievirus infection assists in the dissemination of virus within the neonatal CNS. J Neurosci 30, 8676–8691. Verma, S., Kumar, M., Gurjav, U., Lum, S., Nerurkar, V. R. (2010). Reversal of West Nile virus-induced blood-brain barrier disruption and tight junction proteins degradation by matrix metalloproteinases inhibitor. Virology 397,130-138. Verma, S., Lo, Y., Chapagain, M., Lum, S., Kumar, M., Gurjav, U., Luo, H., Nakatsuka, A. & Nerurkar, V. R. (2009). West Nile virus infection modulates human brain microvascular endothelial cells tight junction proteins and cell adhesion molecules: Transmigration across the in vitro blood-brain barrier. Virology 385, 425-433. Volle, R., Bailly, J. L., Mirand, A., Pereira, B., Marque-Juillet, S., Chambon, M., Regagnon, C., Brebion, A., Henquell, C. & other authors (2014). Variations in cerebrospinal fluid viral loads among enterovirus genotypes in patients hospitalized with laboratory-confirmed meningitis due to enterovirus. J Infect Dis 210, 576–584. Volle, R., Nourrisson C., Mirand, A., Regagnon, C., Chambon, M., Henquell, C., Bailly, J. L., Peigue-Lafeuille, H. & Archimbaud, C. (2012). Quantitative real-time RT-PCR assay for research studies on enterovirus infections in the central nervous system. J Virol Methods 185, 142–148. Vuorinen, T., Vainionpää, R., Vanharanta, R. & Hyypiä, T. (1996). Susceptibility of human bone marrow cells and hematopoietic cell lines to coxsackievirus B3 infection. J Virol 70, 9018-9023.
24
623 624 625 626 627 628 629 630 631 632 633 634 635 636 637 638 639 640 641 642 643 644 645 646 647 648 649 650 651 652 653 654 655 656 657 658 659
Wahid, R., Cannon, M. J. & Chow, M. (2005a). Virus-specific CD4+ and CD8+ cytotoxic T-cell responses and long-term T-cell memory in individuals vaccinated against polio. J Virol 79, 5988-5995. Wahid, R., Cannon, M. J. & Chow, M. (2005b). Dendritic cells and macrophages are productively infected by poliovirus. J Virol 79, 401-9. Weksler, B., Romero, I. A. & Couraud, P. O. (2013). The hCMEC/D3 cell line as a model of the human blood brain barrier. Fluids Barriers CNS 10, 16. Weksler, B., Subileau, E. A., Perrière, N., Charneau, P., Holloway, K., Leveque, M., Tricoire-Leignel, H., Nicotra, A., Bourdoulous, S. & other authors (2005). Blood-brain barrier-specific properties of a human adult brain endothelial cell line. FASEB J 19, 1872– 1874. Yang, W. X., Terasaki, T., Shiroki, K., Ohka, S., Aoki, J., Tanabe, S., Nomura, T., Terada, E., Sugiyama, Y. & Nomoto, A. (1997). Efficient delivery of circulating poliovirus to the central nervous system independently of poliovirus receptor. Virology 229, 421–428. Yen, M. H., Tsao, K. C., Huang, Y. C., Huang, C. G., Huang, Y. L., Lin, R., Chang, M. L., Huang, C. C., Yan, D. C., & Lin, T. Y. (2007). Viral load in blood is correlated with disease severity of neonatal coxsackievirus B3 infection: early diagnosis and predicting disease severity is possible in severe neonatal enterovirus infection. Clin Infect Dis 44, e78–81. Ylipaasto, P., Eskelinen, M., Salmela, K., Hovi, T. & Roivainen, M. (2010). Vitronectin receptors, αv integrins, are recognized by several non-RGD-containing echoviruses in a continuous laboratory cell line and also in primary human Langerhans’ islets and endothelial cells. J Gen Virol 91, 155–165. Zanone, M. M., Favaro, E., Conaldi, P. G., Greening, J., Bottelli, A., Perin, P. C., Klein, N. J., Peakman, M. & Camussi, G. (2003). Persistent infection of human microvascular endothelial cells by coxsackie B viruses induces increased expression of adhesion molecules. J Immunol 171, 438–446. Zhang, Y., Cui, W., Liu, L., Wang, J., Zhao, H., Liao, Y., Na, R., Dong, C., Wang, L. & other authors (2011). Pathogenesis study of enterovirus 71 infection in rhesus monkeys. Lab Invest 91, 1337–1350.
25
Figure 1 (a)
(c)
(d)
(b)
Figure 2
Figure 3
(a)
(b)
(c)
(d)
(e)
(f)
Figure 4
Figure 5
Figure 6
Figure 7
Figure 8
Figure S1
Fig. S1. Schematic representation of the strategy used for testing the susceptibility of hCMEC/D3 cells to a large array of enterovirus types. Virus production per cell was assessed in hCMEC/D3 cells cultured in 96-wells plates. A total of 88 different EV strains were tested in two independent replicates. The whole cell monolayers and supernatants were harvested at 24 h p.i. The amount of viral genomes and infectious particles were quantified by RT-qPCR and viral titration respectively. Cell mortality was analysed during virus infection of hCMEC/D3 cells cultured in 12-well plates; 15 EV strains were compared in 4 independent replicates. Cells were collected, stained for apoptosis and necrosis testing, and counted by flow cytometry at 24 h p.i. Infection efficiency was assessed in cells cultured in 8-well labtek® culture slides. The hCMEC/D3 cells were inoculated with 50 different EV strains. At 6 h p.i., before massive release of progeny viruses, cells were fixed, immunostained for viral protein VP1 and nuclear DNA, and observed at low magnification (10X) with an epifluorescence microscope. The pictures were then analysed to determine the proportion of infected cells.
Figure S2
Fig. S2. Correlation circle of the principal component analysis showing the variables linked with horizontal and vertical axis.
Figure S3
(a)
(b)
Fig. S3. In vitro model of brain endothelial barrier of polarized hCMEC/D3. Schematic representation of the model of a blood-brain endothelial barrier obtained by culture of hCMEC/D3 cells at the surface of a permeable membrane (0.4 μm pore; coated with rat collagen-I) included within the upper chamber of a Transwell device (a). Lucifer yellow (LY) paracellular permeability was measured for 11 days after seeding cells in different independent experiments representative of triplicate cultures (b). Transverse observations by transmission electron microscopy of a polarized hCMEC/D3 cell monolayer (culture of 7 days), scale bar 2 µm (c). Intercellular junction, scale bar 200 nm (d), with a high magnification showing an electron-dense tight junction, with the measurements of intercellular spaces, scale bar 100 nm (e).
Figure S4
Fig. S4. Ultrastructural features of mock infected cells of an in vitro model of bloodbrain endothelial barrier. Low-magnification transmission electron micrograph of 7-day hCMEC/D3 monolayers (a and b). Confocal observation of mitochondria network (red) in hCMEC/D3 cells (c), High magnification transmission electron micrograph of 7-days cultures hCMEC/D3 monolayer. A central nucleus is surrounded by plenty of mitochondria near the rough endoplasmic reticulum (d). Bars represent, 10 µm (a ‒ c); 5 µm (d). N, nucleus; M, mitochondria; ER, endoplasmic reticulum.
Clinical features
General features of Enterovirus strains Species
Serotypes CV-A2 CV-A4
A
CV-A5 CV-A6 EV-A71 CV-A9 CV-B1 CV-B2 CV-B3 CV-B4 CV-B5 CV-B6 E1 E2 E3 E4 E5
E6
E7 E9 E11 B
E12
E13
E14 E15 E16 E17 E18 E19 E20 E21 E24 E25 E26 E27 E29
E30
C D
E31 E33 EV-B69 EV-B77 CV-A21 EV-D70
Strains CF192073-11 CF197013-11 CF308011-10 CF063006-11 CF193056-11 CF218013-10 CF605-00 CF166105-10 CF160019-10 CF027040-07 CF741-93 CF217010-08 CF314051-04 CF186019-07 NANCY CF183076-08 CF193061-05 CF169091-07 CF516-00 CF186106-05 CF202076-06 SCHMITT CF132-87 FAROUK CORNELIS CF307001-05 MORRISSEY CF180108-05 DUTOIT CF248076-05 CF101013-08 NOYCE CF990-00 CF2660-01 CF1057-00 CF328087-03 CF671-00 CF1634-01 CF1679-02 CF158061-11 CF185010-11 WALLACE CF185103-05 CF293042-06 CF22-80 CF1462-00 CF228046-07 CF1157-91 DELCARMEN CF1083-91 CF1274-00 CF1925-01 CF1393-00 CF1901-00 CF282003-06 TOW CF225059-08 CHARLESTON CF187056-09 CF596-78 METCALF CF279084-05 TR115015-05 BURKE JV1 FARINA DECAMP JV4 CF205083-06 CF199022-07 CORONEL BACON JV10 BASTIANNI CF1260-78 CF1074-78 CF282-97 CF552-00 CF2575-00 CF220062-05 CF307026-07 CF284052-07 CALDWELL CF235069-05 TOLUCA1 CF496-99 CF1069-91 CF670-71
Isolation source Throat Feces Throat Feces Feces Throat Feces Throat Throat Throat Feces Feces Throat Throat Stools Throat Throat Throat CSF Throat Throat Stools Stools Stools Feces Stools Throat Feces Feces Stools CSF CSF CSF Throat CSF CSF CSF Throat Throat Stools Throat Throat
Clinical manifestations Encephalitis Guillain Barre Hand-Foot and Mouth disease Fever Acute meningitis Hand-Foot and Mouth disease Septic shock Hand-Foot and Mouth disease Hand-Foot and Mouth disease Acute meningitis
Acute meningitis Minor febril illness Acute meningitis Acute meningitis Acute meningitis Headache; Fever; Vomiting Acute meningitis Acute meningitis None None Acute meningitis Acute meningitis suspected Acute meningitis
Acute meningitis Acute meningitis Acute meningitis Acute meningitis Acute meningitis Acute meningitis Acute meningitis Acute meningitis Acute meningitis Acute meningitis None Acute meningitis Acute meningitis
CSF Throat
Acute meningitis Acute meningitis suspected
Stools
None
CSF CSF CSF Throat Throat Stools Feces Stools Feces
Acute meningitis Acute meningitis Acute meningitis Acute meningitis Acute meningitis Acute meningitis None Acute meningitis
Stools Throat
Diarrhea Acute meningitis
Stools Stools Stools Stools Stools Throat Feces Stools Stools Stools CSF
Diarrhea Fever Acute meningitis Diarrhea Diarrhea Acute meningitis Acute meningitis None None None Acute meningitis
Feces Feces CSF Throat Throat Throat Stools Throat Rectal swab Feces
Acute meningitis Acute meningitis Acute meningitis Acute meningitis Acute meningitis Acute meningitis Acute meningitis Acute meningitis None