DESIGN OF A GRAIN SAMPLING DEVICE FOR COMBINES EQUIPPED WITH A DIFFERENTIAL GLOBAL POSITIONING SYSTEM (DGPS) AND A YIELD METER R. N. JØRGENSEN The Royal Veterinary and Agricultural University, Department of Agricultural Sciences 2630 Taastrup, Denmark Present address: Risø National Laboratory, Department of Plant Biology and Biogeochemistry 4000 Roskilde, Denmark E-mail:
[email protected] J. R. JØRGENSEN Danish Institute of Agricultural Science, Department of Plant Biology 4200 Slagelse, Denmark E-mail:
[email protected]
ABSTRACT During the last decade much effort has been made on estimating the spatial variation of the grain quality in full-scale field trials exploring the potentials of real-time grain quality measuring systems. This has often been made by hand harvesting within a grid setup. However, when performing full-scale field trials it is preferable to collect the grain sample directly from the grain flow passing the yield meter of the combine. By doing so it will be possible to relate the yield registration directly from the yield monitor with the specific grain sample. A simple and inexpensive grain sampler was developed which required a minimal alteration of the combine itself. The paper describes the developed grain sampling system and how to calculated the positing of a collected grain sample taking combine delay time and the D-GPS receiver offsets into account enabling comparable sampling and yield registrations. INTRODUCTION During the last years focus has moved from exploring the spatial field variation of the yield towards variations of the grain quality factors like density, nitrogen content, protein, etc. It has been shown that there is a significant spatial variation of these factors (Stafford, 1999; Moore, 1998; Thylén et al., 1999). The considerable price diffraction between grain qualities increases the benefits of sorting into two or more quality bands. This might be undertaken in one of three ways: (Stafford, 1999) •
On-combine sorting will require two or more holding tanks on the combine together with a on-line driving grain quality sensor driving a sorting mechanism • With a suitable sensing system, grain quality could potentially be accessed prior to harvest, the field zoned into different quality areas and the areas harvested separately • Again, with an on-line sensing system, grain trailer loads off the field could be sorted into different quality bands at unloading into the grain store In order to be able to develop and evaluate the potential of the latter systems positioned grain samples are a necessity. Grain sampling of full-scale field trial has been done by manually 809
harvesting of small sub-areas according to a predefined grid. This approach is however very labour intensive and costly. In order to save labour and money automatic geo-referred sampling directly from a conventional combine harvester will be preferable. The aim of this project was to develop a appropriate system capable of collecting geo-referred grain samples from the location of the yield meter at a conventional combine with a minimum use of labour. The sampling unit was developed in connection with a project testing the potential of the Hydro Precise N-Sensor system in co-operation with Hydro Agri, Denmark and The Danish Advisory Centre, Denmark. MATERIALS AND METHODS The grain sampling system was designed so that no changes of the combine itself are necessary. This ensures that the system can be moved between combines with a minimal use of time and expenses. The combine was a Dronningborg 8900 Jumbo equipped with Danavision (alias DV-1), yield meter, and D-GPS receiver, which has also been used by Haahr et al. (1999). F E
B A
D
A1 C
A2 C1 C2
A3
C3 C4
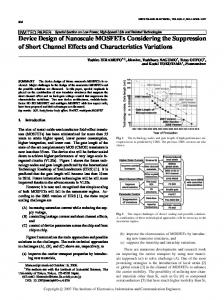
FIGURE 1. Illustration of the whole grain sampling system. A: Picture of the gap between tank filling elevator and tank bubble auger and the sampling gauge (A3). B: Cyclone. C: Picture from inside the cab showing the collection of a grain sample. D: D-GPS unit. E: Vacuum cleaner for industrial use. H: 220 voltage AC power generator. A well-defined place to collect a grain sample is right after the grain passes the yield meter (A1 – figure 1). Above the intake of the tank bubble auger is an inspection door, which is 810
replaced with the sampling gauge unit (A3 - figure 1). In order to ensure a sufficient amount of grain entering the gauge a V-shaped guide plane is placed within the grain flow right above the inspection door (A2 - figure 1). By use of vacuum the grain is transported from the sampling gauge through a 40-mm flexible tube to the top of a cyclone (B - figure 1), which is placed between the cab and the grain tank. The vacuum of the system is produced by a 900Watt vacuum cleaner (E - figure 1) mounted to the conventional inlet of the cyclone. A 220volt AC Honda power generator is placed within the rear part of the combine engine compartment producing power for the vacuum cleaner. The cooling wind from the combine engine protects the generator against dust and overheating. From the cyclone the grain drops through a pipe into a barcode labelled plastic bottle above the folding service tray within the cab (C1 - figure 1). The pipe enters the cab through a 45-mm hole cut through the grain tank inspection window of plexiglas. Due to the vacuum of the system the plastic bottle is sucked to the rubber fitting at the end of the pipe, so that the sampling personnel don’t have to hold it during the filling period. Further the vacuum prevents dust from entering the air-conditioned cab. The sampling procedure is initiated by pressing a button (C3 - figure 1), which actives the control unit placed behind the drivers seat (C4 - figure 1). This unit is equipped with a variable timer (0-10 seconds) setting the opening time of the sampling gauge (A3 - figure 1). The control unit controls the actuator opening and closing the sampling gauge. Further when activated the unit sends a trigger signal via the DTR and DSR pins of the RS-232 port of the PSION WorkAbout hand terminal (www.psion.com) equipped with a barcode reader (C2 figure 1). A modified version of the NaviGATE software from Connective, DK (www.connective.dk) enables the operator to store 3 sampling notes together with the bar code reading of the bottle and a D-GPS position. For example the note can tell treatment and track number, which is copied to all consecutive samples. After the PSION terminal is initiated the actual position of the combine is recorded from a D-GPS receiver (D - figure 1) placed behind the combine cab via the RXD and TXD pins of the RS-232 port. If however future Massey Ferguson combines with the DV-2 system had the same real-time D-GPS export facilities as the Fieldstar® tractor system the PSION terminal could receive sampling positions directly from the combine. Operators sampling procedure The primary task for the combine driver is to keep the combine at a reasonable constant speed when the grain sampling through a swath is performed. The sampling operator sits opposite the combining direction in front of the grain sample outlet. Initially before the combine enters a swath the track number, treatment, and sampling time is typed into the terminal. Hereafter the sampling time, which is the time, that the sampling gauge is open is set via a variable timer at the control unit (C4 - figure 1). Just before the combine enters the swath the sampling operator press enter at the PSION terminal saving the starting position of the track. This position will later be used for calculating the combine speed vector belonging to the first sampling point. A barcode labelled bottle is fit to the sampling outlet and the sampling is initiated by pressing C3 in figure 1. When the grain flow stops the bottle is removed and a new bottle is fit to the outlet. The highest sampling frequency possible is approx. one sample per 20 seconds.
811
CORRECTION OF COMBINE TIME DELAY AND D-GPS RECEIVER OFFSET
Latitude Northing (m)
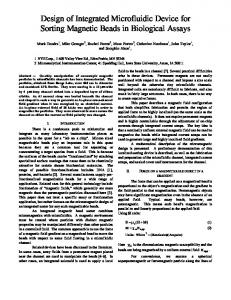
When the sampling procedure is initiated the actual position of the combine is recorded. There is however a delay between the cutting of the crop and the time the threshed grain is passing the yield meter (Moore, 1998). Therefore the recorded sampling position needs to be displaced the opposite direction of the combining speed vector according to the combine delay time. Further, the time when the sampling gauge is open and the offset of the sampling D-GPS receiver compared to the combine D-GPS receiver must also be taken into account. The principle is illustrated in figure 2.
Grain sampler D-GPS receiver
Y X
u
Ps
Easting (m) Longitude
b
v
c a
Combine D-GPS receiver
Pas Ps-1
Pasy
FIGURE 2. Schematic illustration of the adjustment of the grain sampling position taking the combine time delay and the D-GPS receiver offset between the grain sampling unit and combine into account. Ps : Measured position at start of sampling. Ps-1: Previous sampling position. Pas: Sampling position adjusted for combine time delay and the sampling period. Pasy: Pas is further adjusted for the D-GPS receiver offset. u : Angle between longitudinal direction and the combining direction. v : Angle between the right orthogonal of the combining direction and vector between the sampling D-GPS receiver and the receiver of the combine. c : Distance between the D-GPS receivers. The necessary calculation adjusting the offset of the sampling position in relation to the yield registration is given in table 1. The positions Ps, Ps-1, Pas, and Pasy in figure 2 are considered as vectors in the Universal Transverse Mercator (UTM) zone consisting of a latitude and a longitude addressed as vector (x, y). The calculations do not take the physical offset of the combine D-GPS receiver into account since the focus is only to get common positions of the sampling and combine yield registration. If the combine computer is capable of exporting it’s position real-time via a RS-232 port to the PSION terminal the Ooffset can be omitted from the calculations.
812
TABLE 1. Parameters and calculations necessary to determined the corrected location of a grain sampling, Pasy, which can be related directly to the position of the combine yield registrations. Parameter Tdelay Tsp Ts Ts-1 δTs v
δPs(x, y) ePs(x, y)
V(s-1)→(s)(x, y) Pas(x, y) Ooffset(x, y)
Pasy(x, y)
Equation and explanation Unit Combine delay. Moore (1998) found a delay of 15 seconds is s appropriate for the Massey Ferguson combines tested in his Ph.D. thesis. Sampling time is the time the sampling gauge is open. J. R. s Jørgensen and R. N. Jørgensen (2001) used 9 seconds as the default sampling period. The time the sampling is started. s Previous sampling time in relation to Ts. s s δTs = Ts-Ts-1, Time span between sampling s and s-1. æaö radian v = arctanç ÷ , See figure 2. s èbø m δPs(x, y) = Ps(x, y) – Ps-1(x, y) , Vector between sampling points. δP (x, y) ePs (x, y) = (cos(u ), sin(u )) = s δPs (x, y) m Directional unit vector of the combine driving direction in the coordinate system defined in figure 2. δP (x, y) , Combine speed vector between samplings. V(s-1)→( x , y ) = s m s-1 δTs m Pas(x, y) = Ps(x, y) – (Tdelay -½Tsp) ⋅ V(s-1)→(s)(x, y) INCORPORER m écos(v ) - sin (v )ù O offset (x, y) = c ⋅ ê ú .ePs (x, y) ë sin (v ) cos(v ) û
Offset vector between the sampling D-GPS receiver and the combine D-GPS receiver turned according to ePs(x, y) in the coordinate system defined in figure 2. Pasy(x, y) = Pas(x, y) + Ooffset(x, y), Final adjusted grain sampling position which can be related directly to the combine yield registrations.
m
DISCUSSION AND CONCLUSION Other authors have collected grain samples directly from conventional combine harvesters. Moore (1998) and Long et al. (2000) collected grain samples from the outlets of the tank bubble auger. However when the grain is transported through the auger the grain is further mixed and delayed. Thus the potential bias increases when geo-referring the grain samples. When the grain level is above the outlet of the tank bubble auger it is not possible to collect grain samples. On the other side, a limitation to a lower level decreases the efficiency and the capacity of the combine significantly. Often the latter sampling procedure implies that the operator collecting the samples is forced to be working within a hot, dusty and insecure environment on top of a moving combine. This will inevitably increase the risk of human sampling errors significantly. 813
The system described in this paper solves the latter problems. The grain samples is collected at the same place as the yield meter is measuring. The combine delay for yield meter registration is better defined than for the outlet of the tank bubble auger and consequently the geo-referring of the grain samples is improved. The system is not limited by the grain level within the grain tank and is therefore not decreasing the capacity of the combine. The risk of human sampling errors is minimised since the operator is working within the air-conditioned cab. Further he only has to place the bottles and press one button during each sampling session of a track. During the harvest 1999 and 2000 approximately 3000 bottles of grain samples were collected in both winter wheat and malting barley. The system proved to be robust and very reliable. Within a 20-hectare malting barley field only one sampling was missed out of 700 collected. ACKNOWLEDGEMENT The authors express their thank to Dronningborg Industries a/s, Denmark and Associate Professor Henning Nielsen, AgroTechnology, Department of Agricultural Science, The Royal Veterinary and Agricultural University, Denmark, for their co-operation and support for this research. REFERENCES Haahr, V., Jørgensen, R.N., Jensen, A., Overgaard, J. (1999) A method for optimal sitespecific nitrogen fertilisation. In Precision Agriculture ´99 – Part 2: Proceedings of the 2nd European Conference on Precision Agriculture. J.V. Stafford (ed), Sheffield: Sheffield Academic Press Ltd, UK, pp. 709-718. Jørgensen, J.R., Jørgensen, R.N. (2001) Impact on grain quality parameters when nitrogen are sensor applied by the ‘Hydro Precise System’. (this conference). Long, D.S., Engel, R.E., Carlson, G.R. (2000) Method for precision nitrogen management in spring wheat: II. Implementation. Precision Agriculture 2, 25-38. Moore, M. (1998) An Investigation into the accuracy of yield maps and their subsequent use in crop management. PhD thesis. Department of Agriculture and Biosystems Engineering, Cranfield University, Silsoe, UK. 379 pp. Stafford, J.V. An investigation into the within-field spatial variability of grain quality. In: Precision Agriculture ´99 – Part 1: Proceedings of the 2nd European Conference on Precision Agriculture. J.V. Stafford (ed), Sheffield: Sheffield Academic Press Ltd, UK, pp. 353-361. Thylén, L., Algerbo, P.A., Pettersson, C.G., (1999). Grain quality variations within fields of malting barley. In: Precision Agriculture ´99 – Part 1: Proceedings of the 2nd European Conference on Precision Agriculture. J.V. Stafford (ed), Sheffield: Sheffield Academic Press Ltd, UK, pp. 287-296.
814