European Journal of Business and Innovation Research Vol. 1, No. 2, pp.85-100, June 2013 Published by European Centre for Research Training and Development, UK (www.ea-journals.org)
RELATIONAL CAPITAL AND JORDANIAN PHARMACEUTICAL MANUFACTURING ORGANISATIONS’ BUSINESS PERFORMANCE Dr. Abdel-Aziz Ahmad Sharabati, Prof. Abdul-Naser Ibrahim Nour & Dr. Sameer Mousa Jabali Management Department - Business College, Middle East University Abstract: The purpose of this study is to investigate the influence of Relational Capital (RC) on Jordanian Pharmaceutical Manufacturing (JPM) Organizations’ Business Performance (BP). Practical data were collected by means of a questionnaire. Statistical techniques such as descriptive statistics, t-test, ANOVA test, correlation, multiple regressions and stepwise regression were employed. To confirm the suitability of data collection instrument, a Kolmogorov-Smirnov (K-S) test, Cronbach’s Alpha and factor analysis were used. The results of the study indicated a positive significant relationship between RC and JMP Organizations’ BP. Moreover, findings suggest that the JPM Organizations’ RC performance can clearly explain productivity and profitability more than market valuation. The use of a single industry study design limits its generalisability to other industries. The data is also limited to Jordanian Organizations; therefore, extending the analyses to other settings represents future research opportunities. The research results might help both academics and practitioners to be more ready to understand the components of RC and provide insight into developing and increasing them within their Organizations. RC is an important source of Organizations’ wealth and therefore it should be taken into serious consideration when formulating the JPM Organizations’ strategy. Keywords: Relational Capital (RC), Jordanian Pharmaceutical Manufacturing (JPM) Organizations, Business Performance (BP).
INTRODUCTION Pharmaceutical sector represents Jordan‘s second leading sector (Kogan, 2006). The relationships with customers, suppliers and other stakeholders are very crucial for this sector. RC creates value added and differentiates Organizations from each other. The main objective of this research is to provide sound recommendations about performance measurement within RC context by identifying and defining the main attributes of quality and productivity of RC, i.e. to point out critical factors of RC and find suitable ways for measuring and management them. Almost there is an agreement among scholars, researchers and practitioners about the definition and components of RC, but most of them consider only external relationship as RC while others consider both external and internal relationships as RC. Relational capital is “the knowledge embedded in the organizational value chain” (Bontis & Fitz-enz 2002). Relational capital represents all the valuable relationships with customers, suppliers, partners and other relevant stakeholders (Roos et. al. 2001). It comprises not only customer relations but also the organization’s external relationships with its network of suppliers, as well as, its network of strategic partners and stakeholders (Zambon, 2002). Furthermore, Stewart (2003) defined customer capital as the value of organization relationships with the people with whom it does business (Roos, 2003). It consists of the knowledge embedded in external networks which consists primarily of knowledge about customers (Bontis, 2007). It is a knowledge embedded in valuable relationships with customers, suppliers and members of other networks (Sallebrant et. al. 2007). Relational capital is a fundamental prerequisite for organizational growth (Cabrita et. al. 2007). It refers to the organization’s establishment, maintenance, and 85
European Journal of Business and Innovation Research Vol. 1, No. 2, pp.85-100, June 2013 Published by European Centre for Research Training and Development, UK (www.ea-journals.org)
development of public relations matters (Su et. al. 2009). In the modern competitive environment Organizations create the value generally using the relational capital (Titko & Lace 2010). Relational capital consists of communication with customers, suppliers, partners and competitors (Shakina & Barajas 2012). Finally, RC represents organization level of knowledge (knowledge embedded in external relationships); it is an important and necessary factor for success; it is influenced by the organization and other parties that play part in the relationship; it represents all the valuable relationships with customers, suppliers, strategic partners (alliances, licensing, and agreements) investors (stockholders), stakeholders and the community at large. REVIEW OF RELATED LITERATURE Relational capital is a fundamental asset for firms, especially for those with high performing (Welbourne and Val 2009). The key influencing factors of relational capital were customer relationship and supplier relationship (Kontic and Cabrilo 2009). Maintaining and creating stable relational capital requires that a firm build up good interactive relationships with its stakeholders, customers, and suppliers (Allameh et. al. 2010). Among the three variables of intellectual capital, relational capital was the most effective variable on business performance (Sharabati et. al. 2010). As far as the relative importance of the four intellectual capital attributes is concerned, customer capital carried the heaviest weight for business performance (Ahmad and Mushraf, 2011). The most important element for every company is relational capital which brings all income and enables a company to continue it activities (Macerinskiene and Survilaite 2011). Human capital influences organizational performance indirectly and structural capital influences organizational performance directly and indirectly through the relational capital, finally, relational capital directly affect organizational performance (Ahmadi et. al. 2011). The relational capital originates from the value of the relationships that exist between companies and their stakeholders (Manfredi et. al. 2011). Relational capital signifies the relation between internal and external stakeholders (Mehralian et. al. Sadeh 2012). For relational capital, Organizations must create fruitful partnerships with relevant stakeholders and nurture customer relationships (Rahman 2012). The relational capital provides an extra growth rate (Loureiro and Dorrego 2012). The relational capital plays the important role of alliance learning, and therefore, of knowledge-based competitive advantages (Liu et. al. 2010). Organization's performance influenced by innovation capital, as well as, relational capital (St-Pierre 2010). The relational capital has a positive impact on innovation (Amiri et. al. 2011). The relational capital enhances the influence of process capital on innovational capital (Namvar et. al. 2011). There is a significant relationship between relational capital management and tendency to organizational innovation (Ghorbani et. al. 2012). Many relational capital factors were the most important for organization entrepreneurship (Macerinskienė and Aleknaviciute 2011 and Aleknaviciute 2011). The relational capital has positive and meaningful influence on organizational entrepreneurship (Talebi and Bahamir 2012). The relational capital has meaningful effect on externalization of knowledge (Sharafi et. al. 2012). The relational capital significantly and positively affects new product development as well as organization's absorptive capability (Ahmadi et. al. 2012). Relational capital is positively associated with business performance (Cabrita and Bontis 2008). The relational capital and business performance exhibited significant R-squared values (Bontis and Serenko 2009). Relational capital has significant effects on economic performance (Rafiei et. al. 2011). Relational capital has a positive impact on knowledge sharing; knowledge sharing activity enhances the performance (Ngah and Ibrahim 2011). There was a strong relation between relational capital and business performance (Djilali et. al. 2012). The relationship between relational capital and performance was confirmed (Gilaninia and Matak 2012). There was a significant 86
European Journal of Business and Innovation Research Vol. 1, No. 2, pp.85-100, June 2013 Published by European Centre for Research Training and Development, UK (www.ea-journals.org)
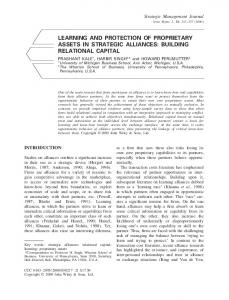
relationship between social relational capital and firm performance (Sulait et. al. 2012). It was established that the correlations between relational capital components are associated with firm performance (Tumwine et. al. 2012). Finally, many researches studied the impact of RC on Organizations' business performance from different perspectives. At the same time, they classified the RC components in different ways. The current research classified the RC components to three elements as follows: Alliances, Licensing and Agreements (S.ALA), Relations with Partners, Suppliers and Customers (R.PSC) and Knowledge about Partners, Suppliers and Customers (K.PSC) and studied the effect of these elements on Organizations' business performance from employee perspective. Problem Statement, Elements and Hypotheses: In the light of the above literature review, it is worth to study the effect of relational capital on BP in Jordan and Arab words. Thus the questions of this study can be developed and interpreted to the following hypothesis: H0: Relational capital does not have a direct impact on JPM Organizations’ BP. The relational capital hypothesis can be divided into three hypotheses according to relational capital components as follows: H0.1: "Strategic alliances, licensing and agreement" variable does not have a direct impact on JPM Organizations’ BP. H0.2: "Relations with partners, suppliers and customers" variable does not have a direct impact on JPM Organizations’ BP. H0.3: "Knowledge about partners, suppliers and customers" variable does not have a direct impact on JPM Organizations’ BP. Study Model In the current study relational Capital (RC) divided into three elements: Alliances, Licensing and Agreements (S.ALA), Relations with Partners, Suppliers and Customers (R.PSC) and Knowledge about Partners, Suppliers and Customers (K.PSC). The current research studies the effect of relational capital elements on JPM Organizations’ business performance as shown in the study model figure (1). Figure (1): Study Model Independent Variables Relational Capital: 1. Strategic alliances, licensing, agreements (ALA) 2. Relations with partners, suppliers and customer (R.PSC) 3. Knowledge about partners, suppliers and customer (K.PSC)
Dependent Variable Business Performance Productivity Profitability Market Valuation
METHODS AND PROCEDURES Study Approach and Design: Secondary data were collected from previous literatures, expert interviews and panel of judges. Primary data were collected by questionnaire; the actual number of questionnaires
87
European Journal of Business and Innovation Research Vol. 1, No. 2, pp.85-100, June 2013 Published by European Centre for Research Training and Development, UK (www.ea-journals.org)
analyzed was 122, which collected from the 15 JPM Organizations and verified through the SPSS 20 software for further tests. Independent Variable: Relational capital is divided into three variables; each was tested by 10 questions: "Strategic alliances, licensing and agreements"; "Relationships with partners, suppliers and customers"; "Knowledge about partners, suppliers and customers". While Dependent variable: JPM Organizations’ business performance was measured through 10 items as indicated in the questionnaire. All variables were measured by five-point Likert-type scale. Normality: Table (1) shows that all the independent and dependent variables are normally distributed, where significance for each variable is more than 0.5. Table (1): Normality Test: One-Sample Kolmogorov-Smirnov (Z) Test Variables (K-S)Z Sig. S.ALA 1.265 0.082 R.PSC 0.883 0.417 K.PSC 0.883 0.589 0.656 0.783 RC 0.933 0.348 BP Reliability: Table (2), the results of Cronbach’s alpha were registered acceptable (more than 0.7). This result matches with previous studies, such as; Miller et. al. (1999), Moslhi et. al. (2006), Bin Ismail (2005), Ahmadi et. al. (2011), Khalique et. al. (2011) and Santos (2012). Table (2): Cronbach’s Alpha for Study Variables: Variables Alpha S.ALA 0.887 R.PSC 0.871 K.PSC 0.853 0.926 RC 0.901 BP Validity: Two methods were used to confirm validity: First, multiple sources of data were used to develop and refine the model and measures. Then, Pearson’s Principal Component Factor Analysis was conducted. The factor loading value below 0.4 should be removed. Following tables (3,4,5,6,7) show that all variable items were valid, since their factor loading values were more than 0.4. Table (3): Factors Loading for RC Variables RC Variables Extraction Factor S.ALA 0.547 0.740 R.PSC 0.776 0.881 K.PSC 0.776 0.881
88
European Journal of Business and Innovation Research Vol. 1, No. 2, pp.85-100, June 2013 Published by European Centre for Research Training and Development, UK (www.ea-journals.org)
Table (4): Factor Loading for S.ALA Variable Items S.ALA Variable Items Joint projects Distribution channels Strategic alliances Diverse alliances Decision making consultations Learn & add value through partners Partnership orientation S.ALA affect productivity S.ALA affect profitability S.ALA affect market valuation
Factor 0.752 0.687 0.787 0.791 0.554 0.686 0.854 0.854 0.713 0.522
Table (5): Factor Loading for R.PSC Variable Items R.PSC Variable Items Customers’ loyalty & satisfaction Customers’ selecting company's products Customers’ wants & needs Devoting time to select suppliers Long standing relationship with suppliers Reduce time solving customers' problems Customer will continue dealing with us R.PSC affect productivity R.PSC affect profitability R.PSC affect market valuation
Factor 0.768 0.780 0.823 0.759 0.720 0.527 0.807 0.589 0.621 0.386
Table (6): Factor Loading for K.PSC Variable Items K.PSC Variables Items Knowledge sharing with partners Feedback from customers Customer knowledge is widely distributed Customer data continuously updated Complete data about suppliers Continuously meets with customers to find needs Useful & updated information system K.PSC affect productivity K.PSC affect profitability K.PSC affect market valuation Table (7) Factor Loading for BP Indicators BP Indicators Industry leadership Future outlook Overall response to competition Success rate in new launches
Factor 0.610 0.699 0.698 0.815 0.717 0.711 0.736 0.599 0.569 0.420
Factor 0.679 0.649 0.696 0.783 89
European Journal of Business and Innovation Research Vol. 1, No. 2, pp.85-100, June 2013 Published by European Centre for Research Training and Development, UK (www.ea-journals.org)
Overall business performance and success Employee productivity Process (transaction) productivity Sales growth Profit growth Company market valuation
0.822 0.625 0.676 0.796 0.806 0.741
DATA ANALYSIS AND RESULTS Relational Capital (RC) Variables: Table (8) shows that the average means of the respondents’ perception about the implementation of the relational capital variables were ranging from 3.37 to 3.59, with standard deviation that ranges from (0.612 to 0.752). The result indicates that there is a significant implementation of the relational capital variables, where (t=9.447 > 1.645). Table (8): Mean, Standard Deviation and One-Sample T-Test Results for RC Variables Variables Mean Std. deviation T value T tabulated S.ALA 3.39 0.752 5.993 1.645 R.PSC 3.59 0.612 11.136 1.645 K.PSC 3.37 0.622 6.870 1.645 RC 3.45 0.550 9.447 1.645 Alliances, Licensing and Agreements (S.ALA) Variable Items: Table (9) shows that the average means of the respondents’ perception about the implementation of the alliances, licensing and agreements variable were ranging from 3.06 to 3.86, with standard deviation that ranges from (0.957 to 1.164). The result indicates that there is a significant implementation of the alliances, licensing and agreements variable, where (t=5.993 > 1.645). Table (9): Mean, Standard Deviation and One-Sample T-Test Results for S.ALA Variable Items Std. T No Statement Mean T tabulated Deviation value 1 Joint projects 3.28 1.114 2.890 1.645 2 Distribution channels 3.55 1.021 6.222 1.645 3 Strategic alliances 3.06 1.164 0.598 1.645 4 Diverse alliances 3.07 1.120 0.699 1.645 5 Decision making consultations 3.13 1.122 1.319 1.645 6 Learn & add value through partners 3.41 0.957 4.913 1.645 7 Partnership orientation 3.18 1.069 1.955 1.645 8 S.ALA affect productivity 3.75 0.984 8.760 1.645 9 S.ALA affect profitability 3.86 1.012 9.715 1.645 10 S.ALA affect market valuation 3.64 1.100 6.646 1.645 Mean Total 3.39 0.752 5.993 1.645 Relations with Partners, Suppliers and Customers (R.PSC) Variable Items: Table (10) shows that the average means of the respondents’ perception about the implementation of the relations with partners, suppliers and customers’ variable were ranging from (3.15 to 4.14), with standard deviation that ranges from (0.802 to 0.993). The results indicate that there is a
90
European Journal of Business and Innovation Research Vol. 1, No. 2, pp.85-100, June 2013 Published by European Centre for Research Training and Development, UK (www.ea-journals.org)
significant implementation of the relations with partners, suppliers and customers’ variable, where (t=11.136 > 1.645).
No 11 12 13 14 15 16 17 18 19 20
Table (10): Mean, Standard Deviation and One-Sample T-Test Results for R.PSC Variable Items Statement Mean Std. T T tabulated Customers’ loyalty & satisfaction 3.31 0.909 3.925 1.645 Customers’ selecting company's products 3.29 0.993 3.332 1.645 Customers’ wants & needs 3.48 0.903 6.069 1.645 Devoting time to select suppliers 3.39 0.889 5.092 1.645 Long standing relationship with suppliers 3.78 0.859 10.438 1.645 Reduce time solving customers' problems 3.15 0.977 1.782 1.645 Customer will continue dealing with us 3.48 0.912 6.013 1.645 R.PSC affect productivity 4.07 0.803 15.291 1.645 R.PSC affect profitability 4.14 0.802 16.387 1.645 R.PSC affect market valuation 3.84 0.923 10.465 1.645 Mean Total 3.59 0.612 11.136 1.645
Knowledge about Partners, Suppliers and Customers (K.PSC) Variable Items: Table (11) shows that the average means of the respondents’ perception about the implementation of the knowledge about partners, suppliers and customers’ variable were ranging from 2.89 to 3.89, with standard deviation that ranges from (0.841 to 1.057). The result indicates that there is a significant implementation of the knowledge about partners, suppliers and customers’ variable, where (t=6.870 > 1.645).
No 21 22 23 24 25 26 27 28 29 30
Table (11): Mean, Standard Deviation and One-Sample T-Test Results for K.PSC Variable Items Statement Mean Std. T T tabulated Knowledge sharing with partners 3.19 1.042 2.088 1.645 Feedback from customers 3.32 0.935 3.908 1.645 Customer knowledge is widely distributed 2.89 0.902 1.645 -1.351 Customer data continuously updated 3.17 0.904 2.215 1.645 Complete data about suppliers 3.45 0.841 6.107 1.645 Continuously meets with customers to find 3.23 0.995 2.711 1.645 Useful & updated information system 3.07 1.057 0.741 1.645 K.PSC affect productivity 3.87 0.868 11.525 1.645 K.PSC affect profitability 3.89 0.867 11.843 1.645 K.PSC affect market valuation 3.63 1.037 6.968 1.645 Mean Total 3.37 0.622 6.870 1.645
Business Performance Indicators (BP): Table (12) shows that the average means of the respondents’ perception about the role of BP indicators were ranging from 3.30 to 3.95, with standard deviation that ranges from (0.785 to 0.946). The result indicates that there is a significant role of BP indicators, where (t=8.173 > 1.645).
91
European Journal of Business and Innovation Research Vol. 1, No. 2, pp.85-100, June 2013 Published by European Centre for Research Training and Development, UK (www.ea-journals.org)
Table (12): Mean, Standard Deviation and One-Sample T-Test Results for BP Indicators No Statement Mea Std. T T tabulated 31 Industry leadership 3.48 0.886 6.186 1.645 32 Future outlook 3.95 0.927 11.734 1.645 33 Overall response to competition 3.39 0.889 5.092 1.645 34 Success rate in new product launches 3.30 0.931 3.647 1.645 35 Overall BP and success 3.54 0.833 7.422 1.645 36 Employee productivity 3.37 0.785 5.430 1.645 37 Process (transaction) productivity 3.38 0.737 5.909 1.645 38 Sales growth 3.39 0.946 4.691 1.645 39 Profit growth 3.45 0.944 5.442 1.645 40 Company market valuation 3.33 0.904 4.141 1.645 Mean Total 3.46 0.641 8.173 1.645 Relationships between the Study Variables: A Bivariate Pearson's correlation coefficient (r): was carried out to test the correlation among relational capital variables and with JPM Organizations’ BP indicators. Table (13) shows that the relationships among the relational capital variables are strong, where r ranges from 0.461 to 0.711. This indicates that the relational capital variables are strongly related with each other. The matrix also shows that the relationship between the relational capital variables and JPM Organizations’ BP is strong, where r ranges from 0.375 to 0.729.
1 2 3 4 5
Table (13): Bivariate Pearson’s Correlation Coefficient (r) Among RC Variables, and With BP 1 2 3 4 Variables ALA R.PCS .461** K.PCS .462** .711** .801** .849** .851** RC .375** .729** .609** BP .670** * Correlation is significant at the 0.05 level. ** Correlation is significant at the 0.01 level Hypotheses Testing Multiple Regressions: Main Hypothesis: H0: Relational capital variables do not affect the JPM Organizations’ BP.
Table (14): Results of Multiple Regressions Analysis: Regressing RC variables against BP Variables r R2 ANOVA F- Value Sig. RC variables 0.740 0.548 51.788 0.000 Table (14) shows that the three variables together explained 54.8 percent of the variance, where (R2 =0.548, F=51.788, Sig.=0.000). Therefore, the null hypothesis is rejected and the alternative hypothesis is accepted. It indicates that the relational capital variables affect the JPM Organizations’ BP.
92
European Journal of Business and Innovation Research Vol. 1, No. 2, pp.85-100, June 2013 Published by European Centre for Research Training and Development, UK (www.ea-journals.org)
Table (15): Un-standardized and Standardized Coefficients of Multiple Regression Model for RC Variables Un-standardized Standardized RC Variables Coefficients Coefficients B Std. Error Beta t-value p (Constant) 0.548 0.245 2.236 .027 S.ALA 0.016 0.058 0.019 0.272 .786 R.PSC 0.622 0.091 0.594 6.862 .000* K.PSC 0.184 0.089 0.178 2.058 .042* *Sig< 0.05 The conclusion of table (15), shows that the relations with partners, suppliers and customers variable has the highest effect on JPM Organizations’ BP, where (Beta=0.594, sig.=0.000). Thus, it indicates that the relations with partners, suppliers and customers variable is the most significant and it is positively and directly regress to the JPM Organizations’ BP, followed by the knowledge about partners, suppliers and customers variable, where (Beta=0.178, sig.=0.042), while the alliance, licensing and agreements variable has the lowest effect, where (Beta=0.019, sig.=0.786). The relationship between the dependent and independent variables derived by this model can thus be expressed as: Relational capital = 0.548 + 0.622 (R.PSC) + 0.184 (K.PSC) + 0.016 (S.ALA). Table (15) shows that there is no significant effect of the alliances, licensing and agreements variable on the JPM Organizations’ BP, where (Beta=0.019, sig.=0.786). Since (t=0.272, P > 0.05), therefore, the null hypothesis is accepted, which indicates that the alliances, licensing and agreements variable does not affect the JPM Organizations’ BP at α =0.05. Furthermore, it shows that there is a positive direct effect of the relations with partners, suppliers and customers’ variable on the JPM Organizations’ BP, where (Beta=0.594, sig.=0.000). Since (t=6.862, P < 0.05), the null hypothesis is rejected and the alternative hypothesis is accepted, which indicates that the relations with partners, suppliers and customers variable affects JPM Organizations’ BP at α =0.05. Finally, result shows that there is a positive direct effect of the knowledge about partners, suppliers and customers’ variable on the JPM Organizations’ BP, where (Beta=0.178, sig.=0.042). Since (t=2.058, P < 0.05), therefore, the null hypothesis is rejected and the alternative hypothesis is accepted, which indicates that the knowledge about partners, suppliers and customers variable affects JPM Organizations’ BP at α =0.05. 1.1.1. Stepwise regression: To determine which variables are important in this model, the researcher used stepwise regression model shown in following table:
Model 1 2
Table (16): Stepwise Regressions (ANOVA) for RC Variables r R2 F Sig. RC Variables (a) 0.729 0.531 147.457 .000 R.PSC 0.740(b) 0.548 78.205 .000 K.PSC
From table (16) above, the first model of stepwise regression shows the importance of the relations with partners, suppliers and customers variable, where (R2=0.531, F=147.457, Sig.=0.000). The second model of stepwise regression shows the importance of the relations with partners, suppliers and customers variable plus the knowledge about partners, suppliers and customers variable, where (R2 =0.548, F=78.205, Sig. =0.000). The following table (17) shows the relation between the relational capital variables and JPM Organizations’ BP:
93
European Journal of Business and Innovation Research Vol. 1, No. 2, pp.85-100, June 2013 Published by European Centre for Research Training and Development, UK (www.ea-journals.org)
Table (17): Stepwise Regressions Model for RC Variables Model Un-standardized Standardized t Sig. Coefficients Coefficients B Std. Error Beta Constant .712 .229 3.106 .002 1 R.PSC .764 .063 .729 12.143 .000 Constant .566 .236 2.400 .018 2 R.PSC .627 .088 .599 7.109 .000 K.PSC .189 .087 .183 2.174 .032 *sig. 1.645). Evidence seems to suggest that the JPM Organizations are implementing all the relational capital variables. It appears that the respondents are aware of the role of relational capital variables in JPM Organizations’ BP and they strongly believe that the relational capital variables affect JPM Organizations’ BP positively. It seems that the JPM Organizations have a strong interest towards a high level of all relational capital variables. Table (18): Comparison between the Variables Means of Different Studies Study RC BP Current Study 3.45 3.46 Miller et. al. 1999 Canada 3.47 3.02 Sofian et. al. 2004 Malaysia 3.89 3.20 Bin Ismail 2005 Malaysia 3.36 3.01 Moslehi et. al. 2006 Iran 3.85 2.4 Salleh & Salamat 2007 Malaysia 3.83 Ahmadi et. al. 2011 3.43 3.22 Macerinskiene & Aleknaviciute (2011) 3.72 3.90 Santoso (2012) 3.69 2.49 Djilali et. al. (2012) 3.86 4.14 Table (18) shows that Sofian et. al. (2004), Bin Ismail (2005), Salleh and Salamat (2007), Miller (1999), and Moslehi et. al. (2006), Ahmadi et. al. (2011), Mačerinskienė & Aleknavičiūtė, Santoso (2012), finally, Djilali et. al. (2012) supported the current study results. Moreover, Bontis (1999), Bontis (2001), Bontis et. al. (2000), Westhuizen (2005), Bollen et. al. (2005) Chen (2004), Gallego & Rodrygues (2005) and Firer & Stainbank (2003) 94
European Journal of Business and Innovation Research Vol. 1, No. 2, pp.85-100, June 2013 Published by European Centre for Research Training and Development, UK (www.ea-journals.org)
results are supporting the current study results. It seems that almost all Organizations regardless of the industry type, country or culture perceive the importance of the relational capital. The results also indicate that there is a significant implementation of the alliances, licensing and agreements variable, where (t=5.993 > 1.645). It appears that the respondents are aware of the role of the alliances, licensing and agreements in JPM Organizations’ BP, and strongly believe that the alliances, licensing and agreements affect JPM Organizations’ productivity, profitability and market valuation. Bin Ismail (2005) and Heimeriks & Duysters (2003) work support the above results. Furthermore, results indicate that there is a significant implementation of the relations with partners, suppliers and customers variable, where (t=11.136 > 1.645). It appears that the respondents are aware of the role of the relations with partners, suppliers and customers in JPM Organizations’ BP, and strongly believe that the relations with partners, suppliers and customers affect JPM Organizations’ productivity, profitability and market valuation. Moreover, the results show that they have strong interest towards the relations with partners, suppliers and customers’ variable. The above result is supported by Bin Ismail (2005), Miller et. al. (1999), Cuganesan (2005), Salleh & Salamat (2007), Bollen et. al. (2005) and Moslehi et. al. (2006), Ahmadi et. al. (2011), Mačerinskienė & Aleknavičiūtė, Santoso (2012), finally, Djilali et. al. (2012). Finally, study results show that there is a significant implementation of the knowledge about partners, suppliers and customers variable, where (t=6.870 > 1.645). It appears that the respondents are aware of the role of the knowledge about partners, suppliers and customers in JPM Organizations’ BP, and strongly believe that the knowledge about partners, suppliers and customers’ affect JPM Organizations’ productivity, profitability and market valuation. The above result is supported by Bollen et. al. (2005), Bin Ismail (2005), Sofian et. al. (2004), Miller et. al. (1999), Moslehi (2006) and Salleh & Salamat (2007) Ahmadi et. al. (2011), Mačerinskienė & Aleknavičiūtė, Santoso (2012), Djilali et. al. (2012). Business Performance Indicators: Results indicate that there is a significant role of the BP indicators, where (t=8.173 > 1.645). Evidence seems to suggest an improvement in JPM Organizations’ BP. Therefore, the JPM Organizations are directed and strongly leaning toward performance improvement, and the respondents are aware of the role of BP indicators. As compared with previous studies, table (18) shows that Miller (1999) study rated (3.02), Sofian et. al. (2004) study rated (3.20), Bin Ismail (2005) study rated (3.01), Moslehi et. al. (2006) study rated (2.4), Ahmadi et. al. (2011) study rated (3.43), Mačerinskienė & Aleknavičiūtė (2011) rated (3.72), Santoso (2012) rated (3.69), finally, Djilali et. al. (2012) rated (3.86). Hypothesis Analysis Results Discussion: Regarding relational capital, the results of the multiple regression analysis show that the null hypothesis is rejected and the alternative hypothesis is accepted, which indicates that relational capital variables affect JPM Organizations’ BP, where (R2=0.548, F=51.788, Sig.=0.000). It also shows that the three relational capital variables together explained 54.8% of the variance. Results also show that the relation with partners, suppliers and customers' variable has the highest effect on JPM Organizations’ BP, followed by the knowledge about partners, suppliers and customers' variable. While the alliance, licensing and agreements variable does not have significant effect on JPM Organizations’ BP. The result also shows that for Alliances, Licensing and Agreements variable: The null hypothesis is accepted which indicates that the alliances, licensing and agreements variable does not affect JPM Organizations’ BP at α =0.05. While, for Relations with Partners, Suppliers and Customers’ variable: The null hypothesis is rejected and the alternative hypothesis is accepted, which indicates that the relations with partners, suppliers and customers variable affects JPM Organizations’ BP at α =0.05. 95
European Journal of Business and Innovation Research Vol. 1, No. 2, pp.85-100, June 2013 Published by European Centre for Research Training and Development, UK (www.ea-journals.org)
Table (19): Correlation (R2) Between RC Variables and BP for Different Studies Variable RC-BP Current Study 0.548* Bontis 1999 0.249* Bollen et. al. 2005 0.455* Bin Ismail 2005 0.401* Wang & Chang 2005 0.483* Ahmadi et. al. 2011 0.470* Khalique et. al. (2011). 0.457* And for Knowledge about Partners, Suppliers and Customers’ variable: The null hypothesis is rejected and the alternative hypothesis is accepted, which indicates that the knowledge about partners, suppliers and customers variable affects JPM Organizations’ BP at α =0.05. Table (19) shows that the above results are supported by Bontis (1999), Bollen et. al. (2005), Bin Ismail (2005) and Wang & Chang (2005), Ahmadi et. al. (2011) and Khalique et. al. (2011). Relationships and Interactions: Pearson correlation matrix shows that the relationships among relational capital variables are strong, where r (0.461 to 0.711). Moreover, result shows that the relationship between relational capital variables and JBM Organizations' BP are varied. The relationship between relations with partners, suppliers and customer’s variable and JPM Organizations' BP is strong, and the relationship between the knowledge about partners, suppliers and customers’ variable and Organizations' BP is also strong. While the relationship between the alliances, licensing and agreements variable and JPM Organizations' BP is moderate. Finally, the relationship between relational capital and JPM Organizations' BP is strong. As shown in the table (20) study result is supported by Bontis (1999), Bin Ismail (2005), Chen et al. (2004), Ahmadi et. al (2011), Khalique et. al. (2011), Santoso (2012), Dong et. al. (2010) and Djilali et. al. (2012). Table (20): Correlation (r) between Total RC and BP for Different Studies Study Current Study Bontis 1999 Bin Ismail 2005 Chen et. al. 2004 Ahmadi et. al. 2011 Khalique et. al. (2011). Santoso (2012) Dong et. al. (2010) Djilali et. al.(2012)
RC-BP 0.670* 0.639* 0.641* 0.793* 0.567** 0.373** 0.508** 0.521* 0.495*
CONCLUSION Empirical result indicates that there is a significant implementation of the relational capital items within JPM Organizations. Moreover, result shows that the relational capital variables together affect JPM Organizations’ BP., while the effect of each variable on JPM 96
European Journal of Business and Innovation Research Vol. 1, No. 2, pp.85-100, June 2013 Published by European Centre for Research Training and Development, UK (www.ea-journals.org)
Organizations' BP is varied: the relation with partners, suppliers and customers' variable has the highest effect on JPM Organizations’ BP, followed by the knowledge about partners, suppliers and customers' variable. While the alliance, licensing and agreements variable does not have significant effect on JPM Organizations’ BP. Furthermore, Pearson correlation matrix shows that the relationships among relational capital variables are strong. Finally, findings suggest that the JPM Organizations’ RC performance can clearly explain productivity and profitability more than market valuation. Study Limitations/Recommendations for Future Research: The sample of this study was restricted to pharmaceutical industry; it focuses on one type of industry. To increase the generalizability of the research results, investigations of at least one more industry is recommended. Further testing might consider a cross-sectional group of participants from a wide variety of industries. Second, the results are limited to Jordanian Organizations. Further empirical researches involving data collection over diverse countries are needed. Finally, measures may need to be refined. Although most variables used in this research have high measurement reliability and validity, some variables may have room for further instrument refinement. Study Contributions/Practical Implications: The research makes significant theoretical and empirical contributions to literature regarding influence of RC on the Organizations’ BP. The research results might help both academics and practitioners to be more ready to understand the components of RC and provide insight into developing and increasing them within their Organizations. RC is an important source of Organizations’ wealth and therefore it should be taken into serious consideration when formulating the JPM Organizations’ strategy. This strategy formulation process can be enhanced by fully integrating RC into management practices. JPM Organizations should coordinate different perspectives of RC to improve JPM Organizations’ BP and should assign scales for each of the three components of RC. Finally, the data suggest that a similar set of RC indicators could be developed for other Organizations and industries whether government, public or private, profitable or non-profitable Organizations. REFERENCES Ahmad, S.B. and Mushraf, A.M. (2011). The Relationship between. Intellectual capital and Business Performance: An empirical study in Iraqi industry. International Conference on Management and Artificial Intelligence IPEDR, Vol. 6, IACSIT Press, Bali, Indonesia, pp. 104-109. Ahmadi, A.A., Ahmadi F., Shakeri S., (2011). The Survey of Relationship between Intellectual capital (IC) and Organizational performance (OP) within the National Iranian South Oil Company. Interdisciplinary Journal of Contemporary Research in Business, Vol. 3, No. 10, pp. 135-143. Ahmadi, A.A., Jalilian, H.J., Salamzadeh, Y., Saeidpour, B. and Daraei, M. (2012). Intellectual Capital and New Product Development Performance in Production Firms: A Case Study of Kermanshah Production Firms. Global Business and Management Research: An International Journal, Vol. 4 No. 1, pp. 15-27. Allameh, S.M., Abbasi S., and Shokrani S.A.R. (2010). The Mediating Role of Organizational Learning Capability between Intellectual Capital and Job Satisfaction. European Journal of Social Sciences, Vol. 17, No. 1, pp. 125-136. Amiri, A.N., Jandaghi, G., and Ramezan, M. (2011). An Investigation to the Impact of Intellectual Capital on Organizational Innovation. European Journal of Scientific Research. Vol. 64, No. 3, pp. 472-477. 97
European Journal of Business and Innovation Research Vol. 1, No. 2, pp.85-100, June 2013 Published by European Centre for Research Training and Development, UK (www.ea-journals.org)
Bin Ismail, M. (2005). The Influence of Intellectual Capital on the Performance of Telekom Malaysia (Telco). Unpublished Doctoral Dissertation, October 2005. Business & Advanced Technology Centre. University of Technology Malaysia. Bollen, L., Vergauwen, P. and Schnieders, S. (2005). Linking Intellectual Capital and Intellectual Property to Company Performance. Management Decision, Vol. 43, No. 9, pp. 1161-1185. Bontis, N. (1999). Managing an Organizational Learning System by Aligning Stocks of Knowledge. Unpublished Doctoral Dissertation, March 1999, Faculty of Graduate Studies. Richard lvey School of Business. University of Westem Ontario. Ontario. Canada. Bontis, N. (2001). Managing Organizational Knowledge by Diagnosing Intellectual Capital: Framing and Advancing the State of the Field. McMaster University. Institute for Intellectual Capital Research Inc. (IICR). Hamilton, Ontario. Idea Group Publishing. Bontis, N. and Fitz-enz, J. (2002). Intellectual Capital ROI: a Causal Map of Human Capital Antecedents and Consequents. Journal of Intellectual Capital, Vol. 3, No. 3, pp. 223247. Bontis, N., Keow, W.C.C. and Richardson, S. (2000). Intellectual Capital and Business Performance in Malaysian Industries. Journal of Intellectual Capital, Vol. 1, No. 1, pp. 85100. Bontis, N. and Serenko, A. (2009). A causal model of human capital antecedents and consequents in the financial services industry. Journal of Intellectual Capital, Vol. 10, No. 1, pp. 53-68. Cabrita, M.R., de Vaz, J.L. and Bontis, N. (2007). Modelling the creation of value from intellectual capital: a Portuguese banking perspective. Int. J. Knowledge and Learning, Vol. 3, Nos. 2/3, pp. 266-280. Cabrita, M., Bontis, N. (2008). Intellectual capital and business performance in the Portuguese banking industry. Int. J. Technology Management, Vol. 43, Nos. 1-3, pp. 212237. Chen, J., Zhu, Z. and Xie, H.Y. (2004). Measuring Intellectual Capital: a New Model and Empirical Study. Journal of Intellectual Capital, Vol. 5, No. 1, pp. 195-212. Chen, M.C. (2004). Intellectual Capital and Competitive Advantages: the Case of TTY, Biopharm Company. Institute of Business Administration. Journal of Business Chemistry, Vol. 1, Issue 1, pp. 14-20. Cuganesan, S. (2005). Intellectual Capital-in-Action and Value Creation: A Case Study of Knowledge Transformations in an Innovation Project. Journal of Intellectual Capital, Vol. 6, No. 3, pp. 357-373. Djilali, B., Sarra M.B. and Fayçal M. (2012). Managing Intellectual Capital to Confront the Challenges of Globalization. Mediterranean Journal of Social Sciences, Vol. 3, No. 6, pp. 179-187. Dong, T. P., Chou J.C., Hung C.L. and Chen W. (2010). The Role of Intellectual Capital in Taiwanese Design Industry. Proceedings of the 2010 IEEE ICMIT, pp. 783-787. Firer, S. and Stainbank, L. (2003). Testing the Relationship between Intellectual Capital and a Company’s Performance: Evidence from South Africa. Meditari Accountancy Research, Vol. 11, pp. 25–44. Gallego, I. and Rodryguez, L. (2005). Situation of Intangible Assets in Spanish Firms: An Empirical Analysis. Journal of Intellectual Capital, Vol. 6, No. 1, pp. 105-126. Ghorbani, M., Mofaredi, B. and Bashiriyan, S. (2012). Study of the relationship between intellectual capital management and organizational innovation in the banks. African Journal of Business Management, Vol. 6, No. 15, pp. 5208-5217. 98
European Journal of Business and Innovation Research Vol. 1, No. 2, pp.85-100, June 2013 Published by European Centre for Research Training and Development, UK (www.ea-journals.org)
Gilaninia, S. and Matak, A.A. (2012). Examination of Relationship between Intellectual Capital and the Small Business Enterprises Performance in Guilan Province. Journal of Basic and Applied Scientific Research, Vol. 2, No. 3, pp. 2291-2297. Loureiro, G.M. and Dorrego, P.F. (2012). Intellectual capital and system of innovation: What really matters at innovative SMEs. Intangible Capital, IC, Vol. 8, No. 2, pp. 239-274. Heimeriks, K.H. and Duysters, G.M. (2003). Alliance Capability as Mediator between Experience and Alliance Performance: An Empirical Investigation into the Alliance Capability Development Process. Ecis Working Papers No. 03.18. Department of Technology Management. Netherlands. Published by: Eindhoven Centre for Innovation Studies (ECIS). Khalique, M.S., Jamal A.N., Md. Isa, A.H. and Ageel, A. (2011). Relationship of Intellectual Capital with the Organizational Performance of Pharmaceutical Companies in Pakistan. Australian Journal of Basic and Applied Sciences, Vol. 5, No. 12, pp. 1964-1969. Kogan, L.A. (2006). Rediscovering the Value of Intellectual Property Rights. International Journal of Economic Development, Vol. 8, No. 1-2, pp. 15-678. Kontic, L., and Cabrilo, S. (2009). A Strategic Model for Measuring Intellectual Capital in Serbian Industrial Enterprises. Economic Annals, Vol. LIV, No. 183, pp. 89-117. Liu, C.L., Ghaurib, P.N. and Sinkovics R.R. (2010). Understanding the impact of relational capital and organizational learning on alliance outcomes. Journal of World Business, 45, pp. 237–249. Macerinskiene, I. and Aleknaviciute, G. (2011). The Evaluation of Intellectual Capital Influence on Entrepreneurship. Economic and Management, Vol. 16, pp. 558-566. Manfredi, S., Celenza, D. and Lombardi, R. (2011). The Relational Capital as a key Factor for a Company’s Success: General Insights. Proceedings of the 12th European Conference on Knowledge Management, Germany, pp. 52. Miller, M., DuPont, B.D., Fera, V., Jeffrey, R., Mahon, B., Payer, B.M. and Starr, A. (1999). Measuring and Reporting Intellectual Capital from a Diverse Canadian Industry Perspective: Experiences, Issues and Prospects. Amsterdam. OECD Symposium. Moslehi, A., Mohagharl, A., Badie1, K., and Lucas, C. (2006). Introducing a Toolbox for IC Measurement in the Iran Insurance Industry. Tehran University. The Electronic Journal of Knowledge Management, Vol. 4, Issue 2, pp. 169-180. Namvar, M., Fathian, M., Gholamin, M.R. and Akhavan, P. (2011). Exploring the role of human capital on firm’s structural capital in Iranian e-business industry. 3rd International Conference on Information and Financial Engineering IPEDR, Vol.12, IACSIT Press, Singapore, pp. 145-150. Ngah, R. and Ibrahim, A.A. (2011). The Influence of Intellectual Capital on Knowledge Sharing: Small and Medium Enterprises’ Perspective. IBIMA Publishing Communications of the IBIMA. Vol. 2011, pp. 13-26. Rahman, S. (2012). The Role of Intellectual Capital in Determining Differences between Stock Market and Financial Performance. International Research Journal of Finance and Economics, Issue 89, pp. 46-77. Roos, G. (2003). An Intellectual Capital Primer. Centre for Business Performance (online). Roos, G., Bainbridge, A. and Jacobsen, K. (2001). Intellectual Capital Analysis as a Strategic Tool. International Capital Services (ICS) ltd. London. United Kingdom. Strategy and Leadership Journal, Vol. 29, Nr. 4. pp. 21-26. Sallebrant, T., Hansen, J., Bontis, N. and Hofman-Bang, P. (2007). Managing risk with intellectual capital statements. Management Decision, Vol. 45, No. 9, pp. 1470-1483.
99
European Journal of Business and Innovation Research Vol. 1, No. 2, pp.85-100, June 2013 Published by European Centre for Research Training and Development, UK (www.ea-journals.org)
Salleh, A. and Selamat, F. (2007). Intellectual Capital Management in Malaysian Public Listed Companies International. Review of Business Research Papers, Vol. 3, No. 2, pp.262274. Santoso, E. (2012). Intellectual Capital in Indonesia: The Influence on Financial Performance of Banking Industry. UMI Dissertation Publishing, ProQuest LLC, University of Phoenix. Shakina, E., Barajas, A. (2012). The Relationship between Intellectual Capital Quality and Corporate Performance: An Empirical Study of Russian and European Companies. Economic Annals, Vol. LVII, No. 192, pp. 79-97. Sharabati, A., Jawad, S., and Bontis, N. (2010). Intellectual Capital and Business Performance in the Pharmaceutical Sector of Jordan, Management Decision, Vol. 48, No. 1, pp. 105-131. Sharafi, M., Moghadam Y.M., and Sharafi T. (2012). The Relationship between Dimensions of Intellectual Capital and Knowledge Creation: Case Study of the Headquarters of National Gas Corporation of Iran. Management Science Letters 2, pp. 147–160. Sofian, S., Tayles, M.E., and Pike, R.H. (2004). Intellectual Capital: An Evolutionary Change in Management Accounting Practices. Working Paper Series: Working Paper No 04/29. Produced by the Bradford University School of Management. Stewart, T.A. (2003). Intellectual Capital: the New Wealth of Organizations. London. Nicholas Brealey Publishing. St-Pierre J. (2010), Intangible Assets and Performance: An Exploratory Analysis on Manufacturing SMEs. AGSE, pp. 163-177. Su, S.C., Lin, W.C. and Dosaey, Z. (2009). Constructing Enterprises Intellectual Capital Selecting Model - A Application of Expert Simulation System. ICLT, Thai Researchers’ Consortium of Value Chain Management and Logistics, pp. 1-10. Talebi, K. and Bahamir, A. (2012). Identification of Intellectual Capital Effects on Promoting Organizational Entrepreneurship (Charmahal-E Bakhtiari Ministry of Cooperatives, Labour and Social Affiars). ZENITH International Journal of Business Economics & Management Research, Vol. 2, Issue 6, pp 37-48. Titko, J. and Lace, N. (2010). Customer Satisfaction and Loyalty in Latvian Retail Banking. Economic and Management, pp. 1031-1038. Tumwine, S., Kamukama, N. and Ntayi, J.N. (2012). Relational capital and performance of tea manufacturing firms. African Journal of Business Management, Vol. 6, No. 3, pp. 79981. Wang, W.Y. and Chang, C. (2005). Intellectual Capital and Performance in Causal Models: Evidence from the Information Technology Industry in Taiwan. Journal of Intellectual Capital, Vol. 6, No. 2, pp. 222-236. Welbourne, T.M. and Val P.M. (2012). Relational Capital: Strategic Advantage for Small and Medium-Size Enterprises (SMEs) Through Negotiation and Collaboration. Group Decis Negot (2009) Vol. 18, pp. 483–497. Westhuizen, C.V.D. (2005). Intellectual Capital Management in Retail Company in South Africa. Unpublished Dissertation, Department of Information and Knowledge Management at the University of Johannesburg. Zambon, S. (2002). Accounting, Intangible and Intellectual Capital: an Overview of the Issues and some Considerations. Working Paper No. 4, University of Ferrara. Corresponding email addressl:
[email protected]
100