previous work on watermarking vector map data, to improve the ro- bustness to ... the watermark from the host GIS data in order to retrieve the original map.
A Clustering Approach for Protecting GIS Vector Data Ahmed Abubahia and Mihaela Cocea School of Computing, University of Portsmouth Portsmouth, PO1 3HE, United Kingdom {ahmed.abubahia,mihaela.cocea}@port.ac.uk
Abstract. The availability of Geographic Information System (GIS) data has increased in recent years, as well as the need to prevent its unauthorized use. One way of protecting this type of data is by embedding within it a digital watermark. In this paper, we build on our previous work on watermarking vector map data, to improve the robustness to (unwanted) modifications to the maps that may prevent the identification of the rightful owner of the data. More specifically, we address the simplification (removing some vertices from GIS vector data) and interpolation (adding new vertices to GIS data) modifications by exploiting a particular property of vector data called a bounding box. In addition, we experiment with bigger maps to establish the feasibility of the approach for larger maps. Keywords: Geographic Information System; Vector Map Data; Cluster Analysis; Data Protection; Security; Digital Copyright
1
Introduction
Research in the area of Geographic Information Systems (GIS) has been growing in recent years, and digital GIS data is now widely available on numerous Internet websites. Consequently, this valuable GIS data is liable to be illegally copied, modified or distributed due to its digital nature. This stands for a compelling need of copyright protection to combat illegal use of GIS data. A popular solution for the protection of GIS data is using digital watermarking systems that enable the identification of unauthorized use of GIS data. GIS data can be divided into two main models1 : raster data model and vector data model. The raster model (image) stores the geographic information into a form of grid cells, and each cell represents the natural corresponding value on the ground (e.g. color scale). On the other hand, the vector data model stores the geographic information into geometrical entities which have properties such as length, a starting point and an ending point [15]. GIS vector data is defined by a sequence of coordinates, and includes shapes such as points, polylines and polygons [1]. This paper focuses on the vector format of GIS data. 1
http://www.ordnancesurvey.co.uk/support/understanding-gis/raster-vector.html
2
A. Abubahia and M. Cocea
Data mining in general and clustering in particular, have been recently used for analysing GIS data for a variety of applications such as government and public services; business and service planning; logistics and transportation; and environmental studies [5], [6], [19]. There are, however, only a limited number of approaches using clustering methods in the watermarking field [2]. In addition, although many watermarking methods have been proposed for digital multimedia data (e.g. images, audio, texts and videos) copyright protection, e.g. [20], [23], [25], digital vector data received less attention, as pointed out in several recent review papers [1], [4], [28]. Our previous work is based on the use of k-medoids clustering for watermarking ESRI(Environmental Systems Research Institute) shapefiles of polygon type [2]; which is discussed in more detail in Sect. 2. In this paper, we propose an improvement to our previous work [2], by using the bounding box property of vector map data, to achieve: (a) robustness to simplification (i.e. deletion of some vertices) [14] and interpolation (i.e. adding new vertices) [26] attacks, and (b) preservation of the balance between the map fidelity (the imperceptibility of the inserted watermark) and capacity (distribution of the watermark bits within the data) for GIS vector map copyright protection. These terms are discussed in more detail in Sect. 2. The rest of this paper is organized as in the following. In Sect. 2, the GIS map watermarking process is briefly explained and a detailed overview of relevant previous work is presented. Sect. 3 describes the GIS vector data format and the platform used for the experimental evaluation of the proposed approach. Sect. 4 presents in detail our approach, while Sect. 5 discusses the experimental results. Sect. 6 concludes the paper.
2
Research Background
A digital GIS watermarking system consists of three main stages: embedding, attack/ modification and extraction (Fig. 1). The embedding stage aims to insert a watermark (e.g. digital binary sequence) into the GIS vector map points, by using a specific computing approach; the embedding space is normally the Cartesian coordinates [14], [22]. The attack or modification stage is the process of distorting the digital map content. The extraction stage refers to obtaining the watermark from the host GIS data in order to retrieve the original map. There are three key requirements for reliable GIS watermarking system: fidelity, capacity and robustness [1], [4]. The fidelity requirement refers to the quality of the watermarked GIS data, in the sense that the watermark embedding process should not affect the quality of the host data and that the watermark should not be noticeable to the human eye [21]. The fidelity also indicates the similarity between the original data and the watermarked data. In the case of GIS raster data (image), which offers an extended range (color-scale) for a pixel, this can be solved easily by maintaining the pixel value within a specific range. In contrast, the fidelity requirement stands as a crucial issue in GIS vector data context due to their Cartesian coordinates
A Clustering Approach for Protecting GIS Vector Data
3
Fig. 1: Digital GIS Map Watermarking System
values sensitivity; which if changed will affect the map shape, and consequently will affect the usability of GIS map. The capacity requirement refers to the number of watermark bits that can be embedded in the host map data. The more watermark bits are embedded, the more secure the watermark becomes. Moreover, it is important not only to have high capacity, but also to have the watermark distributed across the entire map [2]. This could also leads to a loss of fidelity: the more watermark bits are embedded, the more the host vector map is changed, thus, leading to a loss of map quality. Consequently, the fidelity and capacity requirements need to be balanced to achieve both map quality and watermark quality, in order to ensure the effectiveness of the watermarking method. We refer to this relation between fidelity and capacity as a trade-off, given that an increase in one leads to a decrease in the other, and vice versa. The robustness requirement refers to the ability of the watermarked data to withstand malicious modifications to the host GIS map, called attacks. There are many types of attacks [31], of which geometric modifications are particularly important for GIS vector data; such modification processes are rotation, translation and scaling. Rotation means turning the vector map around its center by a specific angle [16]. Translation means moving the whole map by a specific distance towards a specific direction [29]. Scaling refers to altering the size of the map, in both axes by a specific value [16]. Other relevant types of attacks are interpolation [26] and simplification [14] attacks. Simplification attacks refer to the process of removing vertices from the map [14], while interpolation attacks refer to the process of adding new vertices in the map [26]. In the following, research using clustering approaches for watermarking GIS vector data are reviewed in relation to the trade-off between fidelity and capacity.
4
A. Abubahia and M. Cocea
Haowen [11] developed an algorithm for embedding a binary image watermark into GIS vector data of point geometry type. The evaluation of the watermark robustness was measured by the similarity degree between the extracted watermark and the original watermark. However, this algorithm lacks the consideration of both capacity and fidelity measurements, which have crucial implications on the security and usability of the digital map. Jianguo et al. [14] used fuzzy spatial clustering analysis for embedding a binary watermark into GIS vector data, and applying some optimization rules for selecting the watermark locations based on the coordinates’ values and their associated attributes, which led to high fidelity, but low capacity. Lee and Kwon [17] presented an approach for watermarking CAD (computeraided design) drawing by using the k-means++ clustering method. CAD drawings share the vector structure format with GIS vector data. In terms of speed and accuracy, k-means++ method outperforms the standard k-means in the way of selecting the initial centers. However, in this approach, only a small number of watermark bits can be embedded into the host data, thus leading to a low capacity. Huo et al. [12] used a k-means partitioning clustering method for inserting a watermark into GIS vector data, based on ESRI shapefile format, according to the polygons’ mean centers. Although their fidelity achievement is considerably high, the capacity of the watermark was relatively low for the size of the map they used. Therefore, their approach, like the previous ones, does not achieve a good trade-off between fidelity and capacity. All previously mentioned approaches have three limitations: (a) low capacity, which leads to vulnerability to simplification and interpolation attacks; (b) lack of balance between the fidelity and capacity requirements, which has an impact on the map usability and security, and (c) experimentation with small maps, i.e. with small number of polygons, which questions the ability of the proposed approaches to deal with the higher computational complexity brought by bigger maps; as data nowadays is increasing in size, there is a need to demonstrate that the proposed approaches can deal with bigger maps. To address the trade-off issue, our previous work [2] introduced the use of k-medoids-based partition clustering for embedding watermark bits into three digital GIS vector maps of 27, 53 and 132 polygons, and using mean polygons’ centers for locating the optimum position to embed watermark bits into the digital map; the aim was mainly to improve the approach of Huo et al. [12]. Although our approach achieved a considerable improvement in terms of the balance between capacity and fidelity, like the other approaches, it is still vulnerable to simplification and interpolation attacks, and has not been shown to work on larger maps. In this paper, we build on our previous work to address the vulnerability to simplification and interpolation attacks and to show that the proposed approach is feasible for larger maps. Thus, we argue that using a particular property of vector data called a bounding box in combination with our k-medoids approach,
A Clustering Approach for Protecting GIS Vector Data
5
addresses the vulnerability to the two mentioned attacks, while also preserving a good trade-off between fidelity and capacity.
3
GIS Vector Data
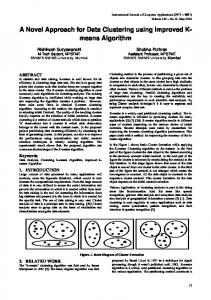
This section describes the GIS vector data that has been used for testing the proposed approach. As shown in Fig. (2a), (2b) and (2c), the used GIS maps are polygon-based maps that represent administrative boundaries of 3 countries in Africa: Benin, Angola and Burkina Faso. These GIS vector maps are freely available, in ESRI shapefile format, from the Natural Earth website.2 ESRI Shapefiles (.shp) are produced by ESRI 3 , and considered as a popular format for geographic information system applications [18]. It has several key prominent features: small storage space, easy reading and writing, fast shape editing, storing both spatial and attribute information, and supporting point, polyline and polygon geometry types [7].
13
−4
16
12
−6
15
−8
11
14
−10 10
13 −12
9
12 −14
8
11
−16
7
−18
6 0.5
−20 10
1
1.5
2
2.5
3
3.5
4
(a) Benin (222 polygons)
10
15
20
25
(b) Angola (501 polygons)
9 −6
−5
−4
−3
−2
−1
0
1
2
3
(c) Burkina Faso (1046 polygons)
Fig. 2: The GIS maps used in the experiments.
Despite the use of ESRI shapefiles in GIS vector data watermarking research [24], [12], the advantage of the shape bounding box feature in the shapefile header has not yet been exploited in this context. As shown in Fig. 3, the bounding box properties we are interested in are the minimum and maximum coordinates’ values in both horizontal and vertical axes. For the watermark embedding and extraction processes, we implemented our approach in MATLAB version R2013b (8.2.0.701). For more information regarding MATLAB, see the Mathworks website4 . 2
3 4
http://www.mapmakerdata.co.uk.s3-website-eu-west-1.amazonaws.com/ library/stacks/Africa/index.htm http://www.esri.com/ http://www.mathworks.co.uk/
6
A. Abubahia and M. Cocea
Fig. 3: The Header of Polygon-based Shapefile, ESRI [7]
The following section presents our approach based on k-medoids clustering and using the bounding box information in the ESRI shapefile. We compare the results of this approach with our previous work [2], which used k-medoids clustering with mean polygon centers, to establish the role of the bounding box property in addressing the vulnerability to simplification and interpolation attacks, and to investigate if the trade-off between fidelity and capacity is preserved.
4
The Proposed GIS-Map Copyright Protection Approach
This section presents our approach following the three stages outlined earlier in Fig. 1: embedding (Sect. 4.1), attack (Sect. 4.2) and extraction (Sect. 4.3). 4.1
Embedding Stage
The embedding approach, as illustrated in Fig. 4, consists of several steps. First, the locations for inserting the watermark are identified by computing the polygon’s centers using the bounding box information for each polygon, and then applying k-medoids to cluster the computed centers. The number of clusters establishes in how many polygons the watermark will be inserted. We experimented with three different proportions of numbers of polygons in the vector map, i.e. 25%, 33% and 50%. After identifying the locations for watermark insertion, the mean distance length is calculated for the selected polygons and the watermark is inserted into the means distance length by utilizing an odd-even indexing rule. Embedding Location Identification The approaches given by our previous work [2] and Huo et al. [12] calculate polygons’ centers by summing up all vertices coordinates, in both axes, for each polygon and dividing the sum by the number of vertices minus one; the minus one is due to the the last vertex coordinates being the same as for the first vertex, according to the polygon shapefile format [7].
A Clustering Approach for Protecting GIS Vector Data
7
In this approach we exploit polygons’ Bounding Boxes property for calculating polygons’ centers. Bounding Boxes refer to the stored values that represent the extent of the geometry shape in the shape file [7]. Polygons’ bounding box centers are calculated in both axes, as shown in Equation(1) and Equation(2), respectively. xmin + xmax (1) 2 ymin + ymax yc = (2) 2 where: xc and yc are the coordinates of polygon’s center in both x and y axes respectively; xmin is the minimum vertex coordinate in x-axis; xmax is the maximum vertex coordinate in x-axis; ymin is the minimum vertex coordinate in y-axis; ymax is the maximum vertex coordinate in y-axis. xmin , xmax , ymin and ymax are each of 8-byte length [7]. The key characteristics of the k-medoids partitioning clustering method are robustness to outliers and the fact that the medoids (representative objects) of clusters are represented by actual points in the dataset [9], [10], unlike other methods, such as k-means, where the representative objects of clusters are artificial points which are not present in the dateset [12]. Therefore, the k-medoids approach can efficiently manage most forms of GIS Vector data. We use a k-medoids based clustering method called PAM (Partitioning Around Medoids), as shown in Algorithm(1), to cluster the bounding box centers in order to determine the best positions for embedding the watermark. The PAM method assigns seeds, i.e initial representative objects, for the given polygons’ centers. These seeds are replaced by other representative objects, called medoids, through a number of iterations until the resulting medoids can not be improved or changed. Polygons’ centers are clustered into k-clusters and the resulting xc =
Fig. 4: The Proposed Embedding-based Cluster Analysis Framework.
8
A. Abubahia and M. Cocea
Algorithm 1 k-medoids method for GIS vector data clustering Input: k: the number of clusters, Dcn : a data set containing number of polygons’ centers. Output: k clusters. M ethod: – select k polygons’ centers in Dcn as the initial representative polygons’ centers; arbitrarily – repeat – each remaining polygon’s center is assigned to the cluster with the nearest representative polygon’s center, measured by Euclidean distance; – choose, randomly, a non-representative polygon’s center, Cprandom ; – calculate the total cost, T , of swapped representative polygon’s center, Cpj , with Cprandom ; – if T < 0 then swap Cpj with Cprandom to form the new set of k representative polygons’ centers; – continue until no change;
medoids are kept as a secret key (key1). The polygons corresponding to the medoids resulted from clustering are then used for watermark insertion. Watermark Insertion The concept of zero watermarking [27] is utilized in our proposed watermark embedding process. Zero watermarking aims to exploit some of the host GIS data characteristics in order to generate a more robust watermark. In this case, the topological characteristic of the host GIS data that is used, is the mean-distance length of polygons. This is calculated for the polygons identified through the clustering process. The watermark is constructed by adding or subtracting a bit value of 1 from the mean-distance length of polygons. The mean-distance length of each polygon is defined by the average value of distance lengths from that polygon’s vertices to its center [12], [29], where the center is calculated as described in Equation(1) and Equation(2). This is illustrated in Fig. 5, while Equation(3) demonstrates the way of calculating the mean-distance length of selected polygons. Lc =
n−1 1 Xp (xc − xv )2 + (yc − yv )2 n − 1 v=1
(3)
where: Lc is the mean distance length; n is the number of vertices in a polygon; xc and yc are the center coordinates in x and y axes, respectively; xv and yv are the vertex coordinates in x and y axes, respectively. The values of mean-distance lengths are stored as a secret key (key2) and they represent the selective positions for embedding the watermark. This is based on bounding box centers that are selected as best medoids by using the k-medoids
A Clustering Approach for Protecting GIS Vector Data
9
−5.989 Bounding Box Center Bounding Box Polygon Boundary
−5.99
Y−axis Coordinates
−5.991 −5.992 −5.993 −5.994 −5.995 −5.996 −5.997 −5.998 12.848
12.85
12.852
12.854
12.856
12.858
12.86
12.862
X−axis Coordinates
Fig. 5: Distances from bounding box center to the vertices of polygon
clustering method. The watermark is embedded by applying odd-even indexing [12], [3], as outlined in Equation (4). ( T − 1, if OES(I) = odd (4) Wi = T + 1, if OES(I) = even where: Wi is the ith bit value of the watermark; OES stands for Odd-Even Status; I is the order index of the mean-distance length value in the matrix; T is the value of the 4th digit of the mean-distance length value, after the decimal point [12]. The index of each mean-distance value is used in this approach, instead of using an additional random sequence proposed by [12], to get more consistent positions for embedding the watermark. This consistency sum up both: (a) the indexing as a vital role in the clustering process, and (b) maintaining the security of the watermark position by storing the index values as a key instead of utilizing a random sequence that is not relevant to the used data. This also offers the ability to control the watermark capacity in order to preserve the map fidelity, whereas the use of a random sequence [12] will limit that choice of control. As shown in Equation (4), the watermark is embedded by comparing the OES (Odd-Even Status) of the I and T variables. The conditions are set based on two scenarios as in the following: – If the OES of I is odd, 1 will be subtracted from the value of T . – In contrast, if the OES of I is even, 1 will be added to the value of T . After applying the OES to change the values of Lc , the new values of meandistance length will be represented by L∗c . the indexes of new mean-distance length values are stored as another secret key (key3), to secure the positions in which the watermark is embedded. The change rate αc is calculated as depicted in Equation (5): αc =
L∗c Lc
(5)
10
A. Abubahia and M. Cocea
The change rate αc is used to change all vertices of polygons identified through clustering on the basis of the embedding condition, as given in equations 6 and 7: vx∗ = αc vx + xc (1 − αc ) (6) vy∗ = αc vy + yc (1 − αc ) vx∗
(7)
vy∗
where: and are the new vertices’ coordinates after embedding the watermark according to the aforementioned condition, in Equation (4). 4.2
Attack Stage
Robustness reflects the watermark’s resistance to a set of attacks or modifications. This paper addresses geometric attacks such as rotation, translation and scaling due to their relevance to the geometrical properties of polygons in the GIS vector maps context. Also other relevant attacks such as simplification, interpolation and tracing the positions of watermark bits are taken into account. 1. Rotation Attack: The rotation means turning the vector map around its center by a specific angle [16]. Rotation is of crucial importance because it changes spatial locations of the vector map points. However, this problem is tackled by using the mean distance length which is known for its resilience to the rotation process [2], [12]. 2. Translation Attack: The translation means moving the whole map by a specific distance towards a specific direction [29]. Translation also has the property of changing the positions of vector map points, but has no effect on the mean distance length because the distances between the vector map points will remain unchanged [2], [12]. 3. Scaling Attack: The scaling attack refers to altering the size of the map, in both axes by a specific value [16]. Although the scaling attack could change the distances between the vector map points, the scaling factor could be computed by dividing the mean-distance values of the scaled map by the mean-distance values of the original map [2], [12]. Consequently, the scaled map can be easily retrieved to its original form after it undergoes the scaling attack. 4. Simplification Attack: The simplification attack refers to the process of removing vertices from the map [14]. If the polygons’ centers are calculated as the average of the vertices, removing some vertices, will change that average. The bounding box centers, however, are not affected by the number of vertices in a polygon; consequently, our approach has more robustness to the simplification attack. 5. Interpolation Attack: The interpolation attack refers to the process of adding new vertices to map’s borders [26]. Similary to the simplification attack, when the centers of polygons are calculated by averaging the vertices, adding more vertices will change that average. As the bounding box is independent of the number of vertices in a polygon, out approach will lead to more robustness to interpolation attacks.
A Clustering Approach for Protecting GIS Vector Data
11
6. Tracing watermark bits positions: The positions of the embedded watermark are secured by using a set of three different keys, which are kept secret from the attackers, and stored for the use in the extraction stage. These keys are: (a) the values of computed clusters’ centers, (b) the values of mean-distance lengths and (c) the indexes of the new mean-distance values. 4.3
Extraction Stage
In the literature, the extraction stage is classified into three categories: blind, semi-blind and non-blind approaches [1]. In the blind approach the original map is not needed in the watermark extraction stage. Semi-blind extraction refers to the case in which the original watermark is used instead of the original map in the watermark extraction stage. Non-blind extraction means that the original map is needed in the watermark extraction stage. Our proposed approach is blind extraction and characterized by flexibility, which means that both the watermark embedding and the watermark extraction processes are quite similar. The keys stored in the embedding process are used in the process of extraction. Firstly, the bounding box center of each polygon is recalculated, and then the polygons’ centers are divided into k-clusters by using the k-medoids method, in order to compare with the stored key1 (Sect. 4.1). The assumption here is that the attacker will not change the bounding box information, which identifies the boundaries of the whole map, as well as each polygon in the map, because such a change will destroy the map’s quality and usability. In the next step, the mean-distance length for the watermarked map is calculated in the same way as in the embedding process. By comparing the computed mean-distance to the stored key2 and key3 (Sect. 4.1), it becomes easy to extract the watermark bits (1 or -1), and restore the original map even when the watermarked GIS vector map has undergone the attacks mentioned in Sect. 4.2.
5
Experimental Results and Discussion
A set of experiments was implemented to assess the balance between fidelity and capacity achieved by our proposed approach. These experiments are carried out on GIS vector maps of 222, 501 and 1046 polygons, as shown in Fig. (2a), (2b) and (2c). The capacity and fidelity results are displayed in Table 1. The fidelity metric aims to measure the imperceptibility of the watermark and reflects its degree of invisibility. This metric is significantly important because it has two crucial effects, especially, in the context of GIS vector data: one on the map shape, and another, consequently, on the usability of GIS vector map. The fidelity is measured by using PSNR (Peak Signal to Noise Ratio), in decibels [12]. There is no specific range for PSNR values but a higher PSNR would normally indicate that the data is of higher quality [13]. The typical values are considered to be between 30 and 50 dB, in the context of digital images [8]. In order to use
12
A. Abubahia and M. Cocea
this metric, we stored the watermarked GIS vector maps in JPEG image format (jpg) for the measurement purpose. On the other hand, in the GIS data context, capacity refers to the number of vertices that carry the watermark bits. The importance of the watermark capacity is specified by its vital implication on increasing the watermark robustness to cropping attacks. Cropping is the process of cutting some parts of the watermarked GIS vector map [30]. Consequently, it is important not only to have high capacity, but also to have the watermark distributed across the entire map [2], to avoid having areas of the map with no watermark, which can be then cut off and used without being able to identify ownership. In our approach, the distribution across the map is achieved through the clustering process.
Table 1: The results of bounding box approach versus mean polygon centers using k-medoids k-medoids with box centers No. of Clusters Capacity (= No. of Polygons) (No. of vertices) Benin Map (25%) 1428 Benin Map (33%) 2187 Benin Map (50%) 3226 Angola Map (25%) 4334 Angola Map (33%) 6379 Angola Map (50%) 10062 Burkina Faso Map (25%) 15630 Burkina Faso Map (33%) 21572 Burkina Faso Map (50%) 31680
bounding k-medoids with mean polygon centers [2] Fidelity Capacity Fidelity (PSNR) (No. of vertices) (PSNR) 42.3485 1321 41.1902 41.9815 1730 40.8308 39.2617 2661 38.6129 46.5627 4118 44.6826 44.2873 5823 43.3034 43.6553 9936 41.9183 41.1364 15350 40.6581 41.6359 19044 40.5387 36.8983 31277 36.4201
Table 1 compares the results of our approach described in this paper, using the bounding box centers, with the results of our previous work [2], using polygons’ mean centers, to investigate how the performance of the two approaches compare in terms of the trade-off between fidelity and capacity. There are two considerable differences between our approach and the previous one [2]. The first difference is in the way of calculating the polygons’ centers, i.e. using the bounding box as explained in Sect.( 4.1) versus using the mean of vertices coordinates in our previous approach [2]. Consequently, the given results can be attributed to the use of the bounding box properties. The second difference is the use of GIS vector maps that contain large numbers of polygons in contrary to [2], which was tested only on small number of polygons (27, 53 and 132 polygons). This should indicate if the approach is suitable for maps with large number of polygons. As shown in Table 1, the trade-off between fidelity and capacity is balanced by increasing the watermark capacity (number of vertices) while keeping higher watermark invisibility (PSNR). Three different proportions of map size, i.e. 25%,
A Clustering Approach for Protecting GIS Vector Data
13
33% and 50%, were used to observe the effect of increased capacity and its effect on fidelity. These proportions represent approximately a quarter, a third and (exactly) half of the number of polygons in the used maps. The relation between the map size proportions and the number of clusters is illustrated in the following for each of the three maps used in the experiments. Thus, for the map of Benin, 25%, 33% and 50% corresponds to 56, 74 and 111 clusters, respectively; for the map of Angola, 25%, 33% and 50% corresponds to 126, 167 and 251 clusters, respectively; and for the map of South Africa, 25%, 33% and 50% corresponds to 262, 349 and 523 clusters, respectively. This shows that our approach is valid for GIS maps that contain large numbers of polygons. When looking at the results for the 25% sizes of the three maps in Table 1, we notice that the capacity values for the approach proposed in this paper (bounding box-based k-medoids), i.e. 1428, 4334 and 15630, are higher than those from our previous approach [2], i.e. 1321, 4118 and 15350. At the same time, it is noticeable that the fidelity values are also higher than the approach of [2], despite the increase in capacity. The same can be observed for the 33% and 50% sizes on all three maps. As pointed out in the previous section, one key characteristic of using the bounding box centers is that it does not depend on the number of vertices in a polygon, which has an advantages of more robustness to the interpolation and simplification attacks. Therefore, the approach proposed in this paper improves our previous approach [2] by achieving robustness to simplification and interpolation attacks, while also increasing the fidelity and capacity metrics, and, at the same time, preserving the balance between the two metrics.
6
Conclusions
The influence of using the bounding box properties for protecting the copyright of GIS vector data was investigated in this paper. We introduced the use of bounding box centers in the context of watermarking research, and compared our approach with our previous work [2]. To assess the effectiveness of our approach, we looked at two important aspects: fidelity and capacity. The experimental results show that the use of the bounding box centers has a significant implication on the trade-off between the fidelity and the capacity metrics, and resulted in higher fidelity as capacity increased. In addition to the improvement of the trade-off between fidelity and capacity, the use of bounding box centers adds more robustness to the simplification and interpolation attacks due to their independence from the number of vertices in a polygon. By using vector maps with large numbers of polygons, the approach has been shown to be feasible for large maps. For measuring fidelity, PSNR was used to be consistent with the previous work in this area, including our previous work [2]; which is an improved work of the approach by Huo et al. [12]. This metric, however, is used in image watermarking and is not necessarily the best metric for GIS vector data [22], as it
14
A. Abubahia and M. Cocea
does not exploit the properties of vector data. As there is no current alternative for measuring fidelity, in future work, we will investigate different metrics that would be more suitable for this type of vector map data. Further research and experiments will be carried out on computing a fixed set of initial representatives for our k-medoids-based watermarking approach to achieve more predictability and efficiency, to eliminate the randomness involved in the initial selection of the centers involved in the typical PAM-based k-medoids method [2]. Also, we will experiment with a clustering approaches proposed in the literature, such as grid-based and density-based approaches, to explore the capability of different cluster analysis tools in the research context of GIS vector map data copyright protection.
References 1. Abbas, T., Jawad, M.: Digital Vector Map Watermarking: Applications, Techniques and Attacks. J. Oriental J. Computer Science & Technology. 6(3), 333–339 (2013) 2. Abubahia, A., Cocea, M.: Partition Clustering for GIS Map Data Protection. In: 26th IEEE International Conference on Tools with Artificial Intelligence, pp. 830– 837 (2014) 3. Baiyan, W., Wei, W., Dandan, M.: 2D Vector Map Watermarking Based on Spatial Relations. In: International Conference on Earth Observation Data Processing and Analysis, pp. 728532–728537 (2008) 4. Bhanuchandar, P., Prasad, M., Srinivas, K.: A Survey on Various Watermarking Methods for GIS Vector Data. Int. J. Computer and Electronics Research. 2, 5–7 (2013) 5. Choi, J. Lee, D., Jung, H.: Knowledge Discovery and Integration: A Case Study of Housing Planning Support System. In: Park, J.H. Adeli, H. Park, N. and Woungang, I. (eds.). LNCS, vol. 274, pp. 287–291. Springer Berlin Heidelberg (2014) 6. Croitoru, A., Crooks, A., Radzikowski, J., Stefanidis, A.: Geosocial Gauge: A System Prototype for Knowledge Discovery from Social Media. Int. J. Geographical Information Science. 27(12), 2483–2508 (2013) 7. ESRI.: ESRI Shapefile Technical Description. Technical Report, Environmental Systems Research Institute, Inc., 380 New York Street, Redlands, CA 923738100 USA, July (1998). Available at http://www.esri.com/library/whitepapers/ pdfs/shapefile.pdf. 8. Hamzaoui, R., Saupe, D.: Fractal Image Compression. In: Barni, M. (eds.), Document and Image Compression, CRC. pp. 145–177 (2006) 9. Han, J., Kamber, M., Pei, J.: Data Mining: Concept and Techniques. Morgan Kaufmann, Waltham (2012) 10. Han, J., Lee, J. G., Kamber, M.: An Overview of Clustering Methods in Geographic Data Analysis. Taylor & Francis Group, LLC (2009) 11. Haowen, Y.: Watermarking Algorithm for Vector Point Clusters. In: 7th International Conference on Wireless Communications, Networking and Mobile Computing, pp. 1–4 (2011). 12. Huo, X. J., Moon, K. S., Lee, S. H., Seung, T. Y., Kwon, S. G.: Protecting GIS Vector Map Using The k-means Clustering Algorithm and odd-even Coding. In: 17th Korea-Japan Joint Workshop on Frontiers of Computer Vision, pp. 1–5. IEEE, February (2011)
A Clustering Approach for Protecting GIS Vector Data
15
13. Huynh, Q., Ghanbari, M.: Scope of Validity of PSNR in Image/Video Quality Assessment. In: IEEE Electronic Letters, 44(13), pp. 800–801 (2008) 14. Jianguo, S., Liang, K., Songzhu, X.: Research of Lossless Digital Watermarking Technology. J. Applied Mechanics and Materials. 333, 1219–1223 (2013) 15. Kennedy, M.: Introducing Geographic Information Systems with ArcGIS. John Wiley and Sons (2013) 16. Lee, S.H. and Kwon, K.R.: Vector Watermarking Scheme for GIS Vector Map Management. J. Multimedia Tools and Applications. 63, 757–790 (2013). 17. Lee, S. H., Kwon, K. R.: CAD Drawing Watermarking Scheme. J. Digital Signal Processing. 20(5), 1379–1399 (2010) 18. Longley, P., Goodchild, M., Maguire, D., and Rhind, D.: Geographic Information Systems and Science. John Wiley and Sons (2011) 19. Miller, H. J., Han, J.: Geographic Data Mining and Knowledge Discovery. CRC Press (2009) 20. Mohammed, G., Yasin, A., Zeki, A.: Robust Image Watermarking Based on Dual Intermediate Significant Bit. In: 6th International Conference on Computer Science and Information Technology, pp. 18–22 (2014) 21. Nin, J., Ricciardi, S.: Digital Watermarking Techniques and Security Issues in The Information and Communication Society. In: 27th International Conference on Advanced Information Networking and Applications Workshops, pp. 1553–1558 (2013) 22. Niu, X. M., Shao, C. Y., Wang, X. T.: A Survey of Digital Vector Map Watermarking. Int. J. Innovative Computing, Information and Control. 2(6), 1301–1316 (2006) 23. Peng, F., Liu, Y., Long, M.: Reversible Watermarking for 2D CAD Engineering Graphics Based on Improved Histogram Shifting. J. Computer-Aided Design. 49, 42–50 (2014) 24. Sha-Sha, L., Wei, Z., An-Bo, L.: Image Watermark Similarity Calculation of GIS Vector Data. Procedia Engineering, 29:1331–1337 (2012) 25. Urvoy, M., Goudia, D., Autrusseau, F.: Perceptual DFT Watermarking with Improved Detection and Robustness to Geometrical Distortions. IEEE Trans. on Information Forensics and Security. 9(7), 1108–1119 (2014) 26. Wang, N. and Men, C.: Reversible fragile watermarking for locating tampered blocks in 2D vector maps. J. Multimedia Tools and Applications. Springer 67, 709– 739 (2013) 27. Wang, X., Huang, D., Zhang, Z.: A Robust Zero-Watermarking Algorithm for vector digital maps based on statistical characteristics. J. Software. 7(10), pp.2349– 2356 (2012) 28. Wu, J., Yang, F., Wu, C.: Review of Digital Watermarking for 2D-Vector Map. In: IEEE International Conference on Green Computing and Communications and IEEE Internet of Things and IEEE Cyber, Physical and Social Computing, pp. 2098–2101 (2013) 29. Xun, W., Ding-jun, H., Zhi-yong, Z.: A Robust Zero-Watermarking Algorithm for 2D Vector Digital Maps. In: He, X., Hua, E., Lin, Y., Liu, X. (eds.). LNEE, vol. 107, pp. 533–541. Springer, Netherlands (2012) 30. Zhao, Q., Sui, L., Wang, C., Yin, X.: Publicly Verify The Integrity of The Geographical Data Using Public Watermarking Scheme. In: Bian, F., Xie, Y., Cui, X., Zeng, Y. (eds.) Geo-Informatics in Resource Management and Sustainable Ecosystem Communications in Computer and Information Science. 398, pp. 646–652. Springer, Berlin Heidelberg (2013)
16
A. Abubahia and M. Cocea
31. Zope-Chaudhari, S., Venkatachalam, P.: Evaluation of Spatial Relations in Watermarked Geospatial Data. In: 3rd ACM SIGSPATIAL International Workshop on GeoStreaming, pp. 78–83 (2012)