A Common Polymorphism near the ESR1 Gene Is Associated with Risk of Breast Cancer: Evidence from a Case-Control Study and a Meta-Analysis Hui Guo1., Jie Ming1., Chunping Liu1, Zhi Li1, Ning Zhang1, Hongtao Cheng3, Wei Wang3, Wei Shi1, Na Shen1, Qunzi Zhao1, Dapeng Li1, Pengfei Yi1, Longqiang Wang1, Rui Wang1, Yue Xin1, Xiangwang Zhao1, Xiu Nie2*, Tao Huang1* 1 Department of Breast and Thyroid Surgery, Union Hospital, Tongji Medical College, Huazhong University of Science and Technology, Wuhan, People’s Republic of China, 2 Department of Pathology, Union Hospital, Tongji Medical College, Huazhong University of Science and Technology, Wuhan, People’s Republic of China, 3 Department of Breast Surgery, Hubei Cancer Hospital, Wuhan, People’s Republic of China
Abstract Background: Genome-wide association studies have reported that a polymorphism near the estrogen receptor gene (ESR1) (rs2046210) is associated with a risk of breast cancer, with the A allele conferring an increased risk. However, considering the controversial results from more recent replicated studies, we conducted a case-control study in an independent Chinese Han population and a meta-analysis to clarify the association of this polymorphism with breast cancer risk. Method and Findings: A hospital-based case-control study including 461 cases and 537 controls from a Chinese Han population was conducted initially, and this study showed that the rs2046210 A allele was significantly associated with breast cancer risk, with an OR of 1.32 (95% CI = 1.10–1.59). Subsequently, a meta-analysis integrating the current study and previous publications with a total of 53,379 cases and 55,493 controls was performed to further confirm our findings. Similarly, a significant association between this polymorphism and breast cancer risk was also observed in the overall population especially among Asians, with ORs for per A allele of 1.14 (95% CI = 1.10–1.18) in the overall population and 1.27 (95% CI = 1.23–1.31) in the Asian population. Conclusion: Our results provide strong evidence to support that the common polymorphism near the ESR1 gene, rs2046210, is associated with an increased risk of breast cancer in Asian and European populations but not in Africans, although the biological mechanisms need to be further investigated. Citation: Guo H, Ming J, Liu C, Li Z, Zhang N, et al. (2012) A Common Polymorphism near the ESR1 Gene Is Associated with Risk of Breast Cancer: Evidence from a Case-Control Study and a Meta-Analysis. PLoS ONE 7(12): e52445. doi:10.1371/journal.pone.0052445 Editor: Xiao-Ping Miao, Huazhong University of Science and Technology, China Received September 1, 2012; Accepted November 13, 2012; Published December 18, 2012 Copyright: ß 2012 Guo et al. This is an open-access article distributed under the terms of the Creative Commons Attribution License, which permits unrestricted use, distribution, and reproduction in any medium, provided the original author and source are credited. Funding: This work was supported by the National Natural Science Foundation of China (grants 30972935, 81001171 and 81202094) and Key Technologies R & D Program of Hubei Province (grant 2007AA302B07). The funders had no role in study design, data collection and analysis, decision to publish, or preparation of the manuscript. Competing Interests: The authors have declared that no competing interests exist. * E-mail:
[email protected] (TH);
[email protected] (XN) . These authors contributed equally to this work.
have revealed that rare but high-penetrance mutations in BRCA1/2 and a few other inherited variants explain only up to 5% of overall BC incidence, whereas more common but lowpenetrance susceptibility alleles may be responsible for a substantial fraction of BC [3–5]. Recent genome-wide association studies (GWAS) have demonstrated numerous low-penetrance susceptibility loci were significantly associated with BC [6–17]. Among them, a common single nucleotide polymorphism (SNP) in the vicinity of the ESR1 gene was highlighted for its potentially biological plausibility in the development of breast carcinogenesis. ESR1 gene encodes estrogen receptor a (ERa), which stimulates proliferation and differentiation of mammary epithelial tissue through combining with estrogen, an established risk factor for BC [18]. Because the biological roles of estrogen are achieved through a high-affinity
Introduction According to global cancer statistics in 2008, breast cancer (BC) is the most common malignant tumor among women worldwide, accounting for 23% of new cancer cases and 14% of cancer deaths. In several developing countries, such as China, BC has surpassed cervical cancer and become the leading cause of cancer death among females [1]. Although the underlying mechanism of BC pathogenesis is still unclear, accumulating evidence shows that development of BC is a multifactorial complex process influenced by multiple genetic variants and environmental factors [2]. Given that only a few individuals receiving the same environmental exposure will develop BC, and that women with a family history of BC are at high risk for the cancer, it appears that genetic factors may play an important role in the etiology of BC. Previous studies
PLOS ONE | www.plosone.org
1
December 2012 | Volume 7 | Issue 12 | e52445
Polymorphism near the ESR1 Gene and Breast Cancer
Table 1. Characteristics of the study population.
Variables
Case (N = 461) No. (%)
Control (N = 537) No. (%)
P Value
Age (years)
48.4169.85
49.04612.45
0.369
Premenopausal
252(54.7)
250(46.6)
Postmenopausal
209(45.3)
287(53.4)
a
Menopausal status 0.011b
ER status ER Positive
266(59.5)
ER Negative
181(40.5)
PR status PR Positive
242(54.1)
PR Negative
205(45.9)
Abbreviations: ER, estrogen receptor; PR, progesterone receptor. a P value was calculated by the t test. b P value was calculated by the x2 test. doi:10.1371/journal.pone.0052445.t001
combination with ERs, the genetic variants in ER genes have become the focus of molecular epidemiological studies on BC susceptibility [19,20]. rs2046210, which is located 180 kb upstream of the transcription initiation site of the first coding exon of the ESR1 gene, was firstly reported by Zheng et al. [21], to be associated with an increased risk of BC. However, several subsequent replication studies could not reach consistent results; for example, Stacey et al. [22] failed to validate the association in Europeans, and similarly, Campa et al. [23] were also unable to replicate the findings in Asians. Potential explanations for the discrepancy could be the modest effect of this SNP and the diverse genetic backgrounds of the different ethnic groups. Additionally, due to the ‘‘winner’s curse’’ phenomenon, the replication studies were likely to be underpowered and possibly failed if the sample size calculations were based on the overestimated effect sizes generated from the initial study [24]. Nevertheless, meta-analysis, a powerful tool that combines data to give the exponential increase
in sample sizes, could resolve the discordances in genetic association studies [25]. Thus, in this study, we carried out a case-control study to validate the association of rs2046210 and BC risk in the Han Chinese population along with a meta-analysis that integrated the current study and previous publications about this polymorphism, to derive a more accurate estimation of the association between this polymorphism and BC risk.
Materials and Methods Study population A total of 461 incident cases and 537 controls were enrolled between June 2009 and December 2011 from Union Hospital of Huazhong University of Science and Technology, Wuhan, China. All the cases were histopathologically confirmed with primary BC and none of them had received neo-adjuvant treatment. The controls were randomly selected from a health check-up program at
Table 2. Association between rs2046210 and breast cancer risk in a Han Chinese population.
All women
No. of cases
No. of controls
GG/GA/AA
GG/GA/AA
Genetic models
OR (95% CI)
164/222/75
236/240/61
A VS. G
1.32(1.10–1.59)
a
0.003
a
GA VS. GG
1.34(1.02–1.76)
a
0.036
a
AA VS. GG
1.74(1.17–2.57)
a
0.006
a
1.42(1.10–1.84)
a
0.008
a
1.49(1.03–2.14)
a
0.034
a
Additive model
1.32(1.10–1.59)
a
0.003
a
A VS. G
1.36(1.05–1.77)
b
0.020
b
0.048
b
Dominant model Recessive model
P value
Menopausal status Premenopausal Postmenopausal
87/123/42
117/97/36
77/99/33
119/143/25
A VS. G
1.30(1.00–1.70)
b
93/135/38
236/240/61
A VS. G
1.27(1.03–1.58)
a
0.029
a
1.38(1.08–1.77)
a
0.009
a
ER status ER Positive ER Negative
68/76/37
236/240/61
A VS. G
Abbreviations: OR, odds ratio; 95%CI, 95% confidence interval. a Data were calculated by multivariate logistic regression model after adjusting for age and menopausal status. b Data were calculated by multivariate logistic regression model after adjusting for age. doi:10.1371/journal.pone.0052445.t002
PLOS ONE | www.plosone.org
2
December 2012 | Volume 7 | Issue 12 | e52445
Polymorphism near the ESR1 Gene and Breast Cancer
Table 3. Characteristics of the studies included in the meta-analysis.
First Author
Published Year
Country
Ethnicity
Study Design
Study Method
Control Source
Case/Control
Zheng [21]
2009
China
Asian
GWAS and Replication
CC
PB
6472/3962
2009
USA
European
Replication
CC
PB
1591/1466
Stacey [22]
2010
Iceland
European
Replication
CC
PB
2638/3506
2010
USA
European
Replication
CC
PB
1753/1487
2010
Spain
European
Replication
CC
PB
1009/1719
2010
Netherlands
European
Replication
CC
PB
727/1830
2010
Sweden
European
Replication
CC
PB
818/1750
2010
Sweden
European
Replication
CC
PB
954/942
2010
Nigeria
African
Replication
CC
PB
851/781
2010
USA
African
Replication
CC
HB
300/153
2010
Taiwan
Asian
Replication
CC
HB
1126/1118
2011
Multinational
European
Replication
Nested CC
PB
5515/5302
2011
Multinational
European
Replication
Nested CC
PB
3381/2807
2011
China
Asian
Replication
CC
HB
1532/1583
2011
China
Asian
Replication
CC
HB
1001/1013
2011
China
Asian
Replication
CC
HB
407/421
2011
Japan
Asian
Replication
CC
HB
644/644
2011
Japan
Asian
Replication
Nested CC
PB
541/507
2011
Japan
Asian
Replication
CC
HB
403/403
2011
USA
European
Replication
CC
PB
1828/1438
2011
USA
European
Replication
CC
PB
953/979
2011
Multinational
European
Replication
Nested CC
PB
1145/1142
2011
USA
African
Replication
Nested CC
PB
522/1046
2011
USA
African
Replication
CC
PB
290/176
Jiang [47]
2011
China
Asian
Replication
CC
PB
493/510
Han [46]
2011
Korea
Asian
Replication
CC
PB
3251/3493
Stevens [44]
2011
Multinational
European
Replication
CC
PB and HB
2707/1385
Campa [23]
2011
USA
European
Replication
Nested CC
PB
603/817
2011
Multinational
European
Replication
Nested CC
PB
2315/3217
2011
USA
European
Replication
Nested CC
PB
2008/3710
2011
Multinational
European
Replication
Nested CC
PB
666/668
2011
Multinational
European
Replication
Nested CC
PB
1780/2168
2011
Multinational
African
Replication
Nested CC
PB
402/426
Antoniou [48]
Cai [42]
2011
Multinational
Asian
Replication
Nested CC
PB
524/537
Han [43]
2011
China
Asian
Replication
CC
PB
1768/1850
Guo
2012
China
Asian
Replication
CC
HB
461/537
Abbreviations: GWAS, genome-wide association studies; CC, case-control study; PB, population based; HB, hospital based. doi:10.1371/journal.pone.0052445.t003
estradiol in the postmenopausal range; (4) if taking tamoxifen or toremifene, and age ,60 y, then FSH and plasma estradiol level in postmenopausal ranges. This study was approved by the institutional review boards of Union Hospital of Huazhong University of Science and Technology and Tongji Medical College of Huazhong University of Science and Technology.
the same hospital during the same period. The inclusion criteria for controls were that they had to be cancer-free individuals who were frequently age-matched (65 years) to the BC cases. All subjects were unrelated ethnic Han Chinese from Wuhan and its surrounding region in the central region of China. Written informed consent was signed by each participant, and 2-ml peripheral blood samples were collected on recruitment. According to the NCCN (National Comprehensive Cancer Network) guidelines for BC [26], the criteria for determining menopause include any of the following: (1) prior bilateral oophorectomy; (2) age $60 y; (3) age,60 y and amenorrheic for 12 or more months in the absence of chemotherapy, tamoxifen, toremifene, or ovarian suppression and FSH and
PLOS ONE | www.plosone.org
Genotyping For each subject, genomic DNA was extracted from a 2-ml peripheral blood sample using the RelaxGene Blood System DP319-02 (Tiangen, Beijing, China) according to the manufacturer’s instructions. The genotype of rs2046210 was carried out
3
December 2012 | Volume 7 | Issue 12 | e52445
Polymorphism near the ESR1 Gene and Breast Cancer
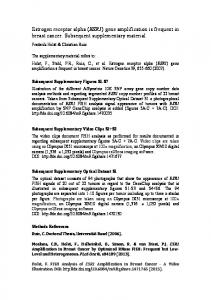
Figure 1. Forest plot of association between rs2046210 and BC risk under allelic model. doi:10.1371/journal.pone.0052445.g001
using the Taqman SNP Genotyping Assay (Applied Biosystems, Foster city, CA) on a 7900HT Fast Real-Time PCR System (Applied Biosystems, Foster city, CA). To assess the quality of genotyping, we conducted re-genotyping of a randomly selected 5% of the samples and obtained 100% concordance rate.
analyses by menopausal status, estrogen receptor (ER) and progesterone receptor (PR) status were further carried out to evaluate the role of rs2046210 in BC risk. All statistical tests were two-sided and performed using the SPSS 12.0 computer program.
Meta-analysis of rs2046210 in association with BC risk Statistical Analysis
To further investigate the association between rs2046210 and BC risk, we carried out a meta-analysis combining previous publications and the current study. We searched PubMed, EMBASE, ISI Web of Science databases and CNKI (China National Knowledge Infrastructure) for literature published in any language up to June 2012 using the keywords combinations of ‘‘rs2046210 or 6q25.1’’ and ‘‘breast cancer, breast carcinoma or breast neoplasm’’. The references of retrieved articles and reviews were also checked for missing information. The literature that was included needed to meet the following criteria: (1) the study evaluating the association between rs2046210 and BC risk; (2)
Differences in the distribution of demographic characteristics between the cases and controls were evaluated by using the x2 test and t-test. The Hardy-Weinberg equilibrium (HWE) for genotypes in the controls was assessed by the goodness-of-fit x2 test. An unconditional multivariate logistic regression model was used to estimate the associations between genotypes and BC risk by calculating the odds ratios (ORs) and 95% confidence intervals (CIs) after adjusting for age and menopausal status. To avoid the assumptions of genetic models, dominant, recessive and additive models for rs2046210 were also assessed. In addition, stratified PLOS ONE | www.plosone.org
4
December 2012 | Volume 7 | Issue 12 | e52445
Polymorphism near the ESR1 Gene and Breast Cancer
Table 4. Meta-analysis of the rs2046210 in association with breast cancer risk under different genetic models.
P for Egger’s test
Genetic model
OR(95%CI)
P
I2 (%)
P
A VS. G
1.14(1.10–1.18)
,0.001
69.9
,0.001
AG VS. GG
1.17(1.11–1.24)
,0.001
59.1
,0.001
0.420
AA VS. GG
1.33(1.24–1.44)
,0.001
57.9
,0.001
0.798
heterogeneity
Overall Overall(n = 36) Overall (n = 26)
a
Overall(n = 25)
0.464
Dominant model
1.21(1.14–1.28)
,0.001
66.1
,0.001
0.537
Recessive model
1.21(1.15–1.28)
,0.001
35.1
0.044
0.891
Additive model
1.15(1.11–1.20)
,0.001
64.9
,0.001
0.495
A VS. G
1.27(1.23–1.31)
,0.001
0.0
0.486
0.661
AG VS. GG
1.30(1.24–1.37)
,0.001
11.6
0.331
0.773
AA VS. GG
1.58(1.47–1.69)
,0.001
0.0
0.600
0.690
Ethnicity Asian Asian(n = 13) Asian(n = 12)
a
Asian(n = 11)
Dominant model
1.36(1.30–1.42)
,0.001
14.3
0.305
0.931
Recessive model
1.36(1.28–1.45)
,0.001
0.0
0.546
0.539
Additive model
1.26(1.22–1.31)
,0.001
0.0
0.517
0.966
European European(n = 18)
A VS. G
1.09(1.07–1.12)
,0.001
47.8
0.013
0.299
European (n = 11)
AG VS. GG
1.11(1.07–1.16)
,0.001
37.3
0.101
0.082
AA VS. GG
1.20(1.14–1.28)
,0.001
0.0
0.670
0.331
Dominant model
1.13(1.09–1.18)
,0.001
34.9
0.120
0.084
Recessive model
1.14(1.08–1.20)
,0.001
0.0
0.844
0.885
Additive model
1.10(1.07–1.13)
,0.001
11.4
0.335
0.141
African(n = 5)
A VS. G
1.01(0.92–1.09)
0.977
0.0
0.553
0.287
African(n = 3)
AG VS. GG
1.03(0.82–1.28)
0.826
66.5
0.051
0.596
AA VS. GG
1.03(0.82–1.30)
0.799
47.1
0.151
0.556
Dominant model
1.03(0.84–1.27)
0.785
65.3
0.056
0.562
Recessive model
1.02(0.87–1.19)
0.837
0.0
0.888
0.221
Additive model
1.02(0.91–1.13)
0.782
18.6
0.293
0.549
ER positive(n = 7)
A VS. G
1.12(1.04–1.20)
0.002
77.2
,0.001
0.942
ER negative(n = 8)
A VS. G
1.23(1.14–1.32)
,0.001
73.6
,0.001
0.424
African
ER status
b
Menopausal status
c
Premenopausal(n = 5)
A VS. G
1.18(1.13–1.24)
,0.001
45.7
0.118
0.945
Postmenopausal(n = 5)
A VS. G
1.22(1.10–1.36)
,0.001
79.8
0.001
0.907
a
Included a study that only offered the adjusted ORs for AG vs. GG, AA vs. GG and dominant model, both crude and adjusted ORs were combined. Compared to cases with ER positive cancer, crude OR(95% CI) for ER negative cancer was 1.11(1.06–1.15) for the model of A VS. G (P = 8.2761027). Compared to premenopausal cases, crude OR(95% CI) for postmenopausal cases was 0.99(0.95–1.04) for the model of A VS. G (P = 0.706). doi:10.1371/journal.pone.0052445.t004 b c
providing data for calculating genotypic ORs with corresponding 95% CI; (3) the genotypes in control conforming to HardyWeinberg equilibrium (P.0. 05). Reviews, simple commentaries and case reports were excluded. If the studies had overlapping subjects, the one with the largest samples was finally included. For each study, the following data were extracted: first author, year of publication, geographic location, ethnicity of the study population, study design, study method, control source, sample size, and frequencies of genotypes in cases and controls. The ORs were calculated for the risk allele A versus the wild allele G. Genotype AG versus GG, AA versus GG, dominant, recessive and additive models were recalculated from parts of the included PLOS ONE | www.plosone.org
studies because some research did not provide sufficient data. The between-study heterogeneity was assessed by Cochran’s Q test and I2 statistics. Heterogeneity was considered significant at P,0.10 for the Q statistic [27]. The I2 statistics was then used to evaluate heterogeneity quantitatively (I2,25%, low heterogeneity; I2 = 25– 75%, moderate heterogeneity; I2.75%, high heterogeneity) [28]. A fixed-effects model of the Mantel-Haenszel method was applied to pool data from studies if the heterogeneity was negligible based on a P value greater than 0.1 for Q statistics; otherwise, a randomeffects model of the DerSimonian and Laird method was used [29]. To explore sources of heterogeneity across studies, a metaregression model was employed [30]. The particular covariates for 5
December 2012 | Volume 7 | Issue 12 | e52445
Polymorphism near the ESR1 Gene and Breast Cancer
Figure 2. Forest plot of association between rs2046210 and BC risk in different ethnicities under allelic model. doi:10.1371/journal.pone.0052445.g002
statistical analyses were carried out in STATA 10.0, and all P values were two-sided with a significance level at 0.05. In order to ensure the rigor of this current meta-analysis, we designed and reported it according to the Preferred Reporting Items for Systematic Reviews and Meta-analyses (PRISMA) statement and the checklist is shown in Table S1 (http://www. prisma-statement.org).
assessment of heterogeneity sources were: ethnicity (Asian, European and African), study design (GWA studies and replication), study method (case-control studies and nested case-control studies), sample size (#2000 and .2000 subjects), source of control (population and hospital based controls). Stratified analysis was then conducted according to the potential sources of heterogeneity evaluated by meta-regression analysis. The subgroup meta-analyses stratified by ER and menopausal status were further performed. Additionally, sensitivity analysis was performed by omission of each study in turn to assess the influence of each study on the overall estimate [31]. Cumulative meta-analysis was performed by assortment of publication times [32]. Publication bias was assessed by a funnel plot and Eegger’s test [33,34]. All
PLOS ONE | www.plosone.org
Results Results of case-control study Population characteristics. The characteristics of the cases and controls were listed in Table 1. A total of 461 BC cases and 537 frequency-matched controls were enrolled in this study. Mean 6
December 2012 | Volume 7 | Issue 12 | e52445
Polymorphism near the ESR1 Gene and Breast Cancer
OR = 1.32, 95% CI = 1.10–1.59, P = 0.003; GA versus GG: OR = 1.34, 95% CI = 1.02–1.76, P = 0.036; AA versus GG: OR = 1.74, 95% CI = 1.17–2.57, P = 0.006). Meanwhile, under dominant, recessive, and additive models, significant associations were also found for SNP rs2046210, with ORs equal to 1.42(95% CI = 1.10–1.84, P = 0.008), 1.49(95% CI = 1.03–2.14, P = 0.034), and 1.32 (95% CI = 1.10–1.59, P = 0.003), respectively. We then stratified the data according to menopausal status and ER status. The results demonstrated that rs2046210 was associated with an elevated risk of BC in an allelic model among both pre- and post-menopausal individuals. The positive association of this SNP with BC risk was also found for both ER positive and ER negative women with adjusted ORs equal to 1.27(P = 0.029) and 1.38(P = 0.009) respectively.
Table 5. Sensitivity analysis of allelic model. I2 (%)
Study omitted
OR(95%CI)
P
Zheng 2009 China [21]
1.13(1.09–1.17)
,0.001
67.0
Zheng 2009 USA
1.14(1.10–1.18)
,0.001
70.7
Stacey 2010 Iceland [22]
1.14(1.10–1.18)
,0.001
67.6
Stacey 2010 USA1
1.14(1.10–1.18)
,0.001
70.2
Stacey 2010 Spain
1.14(1.10–1.18)
,0.001
70.7
Stacey 2010 Netherlands
1.14(1.10–1.18)
,0.001
68.9
Stacey 2010 Sweden1
1.14(1.10–1.18)
,0.001
70.5
Stacey 2010 Sweden2
1.14(1.10–1.18)
,0.001
70.1
Stacey 2010 Nigeria
1.14(1.10–1.18)
,0.001
69.9
Stacey 2010 USA2
1.14(1.10–1.18)
,0.001
70.1
Stacey 2010 China
1.13(1.09–1.17)
,0.001
70.2
Antoniou 2011 CIMBA1 [48] 1.13(1.09–1.18)
,0.001
70.5
Antoniou 2011 CIMBA2
1.14(1.10–1.18)
,0.001
69.5
Cai 2011 China1 [42]
1.13(1.09–1.17)
,0.001
68.6
Cai 2011 China2
1.13(1.09–1.17)
,0.001
70.2
Cai 2011 China3
1.13(1.09–1.17)
,0.001
69.4
Cai 2011 Japan1
1.13(1.09–1.17)
,0.001
69.2
Cai 2011 Japan2
1.14(1.10–1.18)
,0.001
70.7
Cai 2011 Japan3
1.14(1.10–1.18)
,0.001
70.7
Cai 2011 CBCS
1.14(1.10–1.18)
,0.001
69.7
Cai 2011 LIBCSP
1.14(1.10–1.18)
,0.001
70.1
Cai 2011 CGEMS
1.14(1.10–1.18)
,0.001
70.7
Cai 2011 SCCS
1.14(1.10–1.18)
,0.001
70.2
Cai 2011 NBHS
1.14(1.10–1.18)
,0.001
69.5
Jiang 2011 China [47]
1.13(1.09–1.17)
,0.001
69.0
Han 2011 Korea [46]
1.13(1.09–1.17)
,0.001
69.8
Stevens 2011 TNBCC [44]
1.13(1.09–1.17)
,0.001
69.1
Campa 2011 CPS2 [23]
1.14(1.10–1.18)
,0.001
70.7
Campa 2011 EPIC
1.14(1.10–1.18)
,0.001
69.8
Campa 2011 NHS
1.14(1.10–1.18)
,0.001
70.7
Campa 2011 WHS
1.14(1.10–1.18)
,0.001
70.5
Campa 2011 MEC+PLCO1
1.14(1.10–1.18)
,0.001
69.8
Campa 2011 MEC+PLCO2
1.14(1.10–1.18)
,0.001
70.7
Campa 2011 MEC+PLCO3
1.14(1.10–1.18)
,0.001
70.7
Han 2011 China [43]
1.13(1.09–1.17)
,0.001
68.5
Guo 2012 China
1.13(1.09–1.17)
,0.001
70.1
heterogeneity
Result of meta-analyses Characteristics of included studies. As shown in Figure S1, 23 potentially relevant publications were identified through PubMed, EMBASE, ISI Web of Science and CNKI initially, of which 17 publications were judged to preliminarily meet the inclusion criteria mentioned above. Seven articles were excluded because the cases largely overlapped with the samples of previous studies [35–41]. The multicenter research reported by Cai et al. [42] contained samples that duplicated those in the research conducted by Han et al [43]; therefore the corresponding study with less case number was excluded. Finally, 10 previous publications [21–23,42–48] (Table 3) and the current study comprising 36 studies consisting of 53,379 cases and 55,493 controls were included in this meta-analysis based on our search strategy and eligibility criteria. Among them, the publication by Stacey et al. [22] provided only allelic OR value, and was thus only included in the pooled analysis for the allelic model of A VS. G. The study reported by Jiang et al. [47] did not provide the genotype of samples in detail, so we merely put it into the corresponding pooled analysis according to the data it provided. Overall meta-analyses of rs2046210 in associated with BC risk. As shown in Table 4, the P values for heterogeneity were less
than 0.1 in all genetic models, therefore, ORs were pooled under a random-effects model. In the allelic model, A allele conferred a pooled OR of 1.14 (95% CI = 1.10–1.18, P,0.001) compared to G allele (Figure 1). Genotypic ORs of GA versus GG, AA versus GG, and a dominant model combined both crude and adjusted ORs because a study of Asians only provided adjusted ORs of the three models as mentioned previously [47], and the pooled ORs were 1.17 (95% CI = 1.11–1.24, P,0.001), 1.33 (95% CI = 1.24–1.44, P,0.001) and 1.21 (95% CI = 1.14–1.28, P,0.001) respectively. Significant associations between rs2046210 and BC risk were also observed in the recessive model (OR = 1.21, 95% CI = 1.15–1.28, P,0.001) and the additive model (OR = 1.15, 95% CI = 1.11–1.20, P,0.001) in this meta-analysis. Meta-regression analyses and stratified analyses. To investigate the potential sources of between-study heterogeneity under allelic model of A VS. G, meta-regression analyses were performed. A empty regression was initially run to estimate the baseline value for tau2 (tau2 = 0.0073), and then we conducted a series of univariate model by adding single covariates including ethnicity of population, study design, study method, sample size, and source of control. In the univariate analyses, we found that the tau2 value reduced to 0.0014 (adjusted R2 = 81.04%) in the model of ethnicity, suggesting that ethnicity could explain 81.04% of the heterogeneity across studies in this allelic model. Then the stratified analyses by ethnicity were further carried out (Table 4). In Asian and European populations, the polymorphism in all genetic models presented a significantly increased risk of BC;
doi:10.1371/journal.pone.0052445.t005
age was 48.41 (69.85) for cases and 49.04 (612.45) for controls, and there was no significant difference between two groups (P = 0.369). The percentage of premenopausal women was 54.7% among the BC cases compared with 46.6% among controls, and the P value for the distribution of menopause status between the cases and controls was 0.011. Association between SNP rs2046210 and BC risk. The genotype data of rs2046210 in the cases and controls are shown in Table 2. Genotypes in the controls were consistent with the Hardy-Weinberg equilibrium (P.0.05). A multivariate logistic regression model demonstrated that individuals carrying the A allele, GA or AA genotypes presented a significantly elevated risk of BC compared with those carrying the G allele or GG genotypes after adjusting for age and menopausal status (A versus G: PLOS ONE | www.plosone.org
7
December 2012 | Volume 7 | Issue 12 | e52445
Polymorphism near the ESR1 Gene and Breast Cancer
Figure 3. Cumulative meta-analysis of association between rs2046210 and BC risk under allelic model. doi:10.1371/journal.pone.0052445.g003
population-based controls together, the heterogeneity was reduced apparently (I2 = 21.6%, P = 0.202).When we subsequently stratified the data by ER and menopausal status, the between-study heterogeneity was obvious, but it was reduced notably after further stratifying by ethnicity. The pooled ORs of A VS. G were 1.23(95% CI = 1.14–1.32, P,0.001) in the ER negative population and 1.12(95% CI = 1.04–1.20, P = 0.002) in the ER positive population. After comparing to cases with ER positive BC, the OR (95%CI) for ER negative BC was 1.11(95% CI = 1.06–1.15,
however, there was no obvious association between the SNP and BC risk in the African population in any genetic model (Figure 2). It demonstrated that the A variant played disparate roles in different ethnic populations. We found that the moderate heterogeneity still exited in the Europeans under allelic model (I2 = 47.8%, P = 0.013), therefore, the further meta-regression was carried out and it revealed that the source of control could explain 53.61% of heterogeneity. After excluding the multicenter research reported by Steven et al [44] that combined hospital- and
PLOS ONE | www.plosone.org
8
December 2012 | Volume 7 | Issue 12 | e52445
Polymorphism near the ESR1 Gene and Breast Cancer
P = 8.2761027) for allelic model of A VS.G, which indicated that the association was stronger for ER negative BC than ER positive BC. Meanwhile, the positive association of this SNP with BC risk was also found in both pre- and post-menopausal women (OR = 1.18, 95% CI = 1.13–1.24, P,0.001 and OR = 1.22, 95% CI = 1.10–1.36, P,0.001), however, no stronger association was found in post-menopausal cases by comparison with pre-menopausal counterparts (P = 0.706).
was associated with an increased risk of BC with BRCA1 mutation carriers, but not associated in BRCA2 mutation patients. Remarkably, accumulating evidence showed that the large majority of BRCA1 mutation carriers presented with ER negative tumors [49], which could partly explain why ER negative cases were accompanied by a stronger association. Additionally, recent studies in mice have revealed that the mammary stem cell compartment could be regulated by estrogen and progesterone through a paracrine signaling mechanism from ER positive cells to ER negative cells [50,51]. Thus, polymorphisms near the ESR1 locus could affect the occurrence and development of ER negative tumors through the paracrine pathway. In the stratified metaanalysis, we also found that rs2046210 was significantly associated with BC risk in both premenopausal and postmenopausal women for allelic model, which was kept in line with the result of our casecontrol study. However, there was no evidence showing that the association was stronger in post- than pre-menopausal women. Considering the relative vicinity of rs2046210 to the ESR1 gene, it was speculated that the SNP itself or causal variants in LD with it might alter ESR1 gene expression, thus affecting the susceptibility to BC. However, the functional genomic analyses and in vitro functional experiments conducted by Cai et. al [42] provided no support for the potential involvement of this polymorphism in the regulation of ESR1. Although dozens of SNPs have been reported in high LD with this polymorphism, functional evaluations on them and their related genes were still warranted. Herein, we conjectured that this SNP might communicate with the ESR1 gene via a long-range chromatin loop. Nevertheless, it was just a postulation and needed to be confirmed by further longitudinal studies. In conclusion, our case-control study and the subsequent metaanalysis effectively corroborated the impact of rs2046210 near the ESR1 gene on BC risk, and showed that the polymorphism had a larger effect on Asians than on Europeans or Africans. However, the function of this SNP is still unclear; future fine-mapping of the BC susceptibility loci tagged by rs2046210 is warranted and the underlying biological mechanism of this polymorphism still needs further investigation.
Sensitivity analyses and cumulative metaanalyses. Since significant heterogeneity across studies existed
in all genetic models of overall population and in allelic model of European population, we carried out sensitivity analyses to evaluate the effect of each study on the pooled estimate under a randomeffects model by removing each study sequentially. As shown in Table 5 and Table S2, the pooled ORs were similar before and after deletion of each study. We also achieved similar results in other genetic models and no single study changed the OR values markedly, therefore, the current results are stable and credible. Cumulative meta-analyses were carried out in all genetic models via an assortment of studies in chronologic order. As shown in Figure 3, the 95% CIs for the pooled ORs became increasingly narrower with each accumulation of more studies in all models, indicating that the precision of the estimation was progressively boosted by continually adding more samples. Publication bias. A funnel plot (Figure S2) and Egger’s test (all P values for Egger’s test .0.05) reflected that there was no evidence of publication bias in any of the genetic models.
Discussion This study demonstrated a significant association between rs2046210 and an increased risk of BC in a Han Chinese population. The subsequent meta-analysis based on 36 studies consisting of 53,379 cases and 55,493 controls also confirmed the strong association under all genetic models in an overall population. To the best of our knowledge, this is the first metaanalysis seeking to clarify the association between this polymorphism and BC risk, and the sensitivity and cumulative analyses confirmed that the positive finding was stable and the precision of estimation was progressively boosted as more studies were involved. These results clearly revealed the role of this polymorphism, which is near the ESR1 gene, in BC susceptibility. In the overall meta-analyses, all genetic models presented significant heterogeneity. However, the heterogeneity had been mostly explained by the ethnicity of study population according to the result of meta-regression analyses. After being stratified by ethnicity, it demonstrated that this polymorphism had a significant association with BC risk in Asians and only a weaker and unstable association in Europeans. Meanwhile it could not be validated in Africans. The strength of the association with rs2046210 varies greatly across ethnic groups. One probable reason is the considerable differences in genetic architecture across ethnic SNPs. Another plausible hypothesis suggests that rs2046210 is only a marker SNP of causative variants and resides in different linkage disequilibrium (LD) patterns among the three ethnic populations. Intriguingly, in further analysis, we found that this association was more significant in ER negative than in ER positive BC. Two recent interesting studies [45,48] indicated that this polymorphism
Supporting Information Figure S1
Flow diagram of the study selection procedure.
(TIF) Figure S2
Funnel plot for publication bias test.
(TIF) Table S1 PRISMA Checklist.
(DOC) Table S2 Sensitivity analysis of allelic model for Europeans.
(DOC)
Author Contributions Conceived and designed the experiments: TH HG JM. Performed the experiments: HG WS WW QZ PY RW YX XZ. Analyzed the data: HG JM. Contributed reagents/materials/analysis tools: XN CL ZL HC NZ NS DL LW. Wrote the paper: HG JM XN TH.
References 1. Jemal A, Bray F, Center MM, Ferlay J, Ward E, et al. (2011) Global cancer statistics. CA Cancer J Clin 61: 69–90. 2. Nathanson KL, Wooster R, Weber BL (2001) Breast cancer genetics: what we know and what we need. Nat Med 7: 552–556.
PLOS ONE | www.plosone.org
3. Easton DF (1999) How many more breast cancer predisposition genes are there? Breast Cancer Res 1: 14–17. 4. Miki Y, Swensen J, Shattuck-Eidens D, Futreal PA, Harshman K, et al. (1994) A strong candidate for the breast and ovarian cancer susceptibility gene BRCA1. Science 266: 66–71.
9
December 2012 | Volume 7 | Issue 12 | e52445
Polymorphism near the ESR1 Gene and Breast Cancer
5. Wooster R, Neuhausen SL, Mangion J, Quirk Y, Ford D, et al. (1994) Localization of a breast cancer susceptibility gene, BRCA2, to chromosome 13q12-13. Science 265: 2088–2090. 6. Hunter DJ, Kraft P, Jacobs KB, Cox DG, Yeager M, et al. (2007) A genomewide association study identifies alleles in FGFR2 associated with risk of sporadic postmenopausal breast cancer. Nat Genet 39: 870–874. 7. Gold B, Kirchhoff T, Stefanov S, Lautenberger J, Viale A, et al. (2008) Genomewide association study provides evidence for a breast cancer risk locus at 6q22.33. Proc Natl Acad Sci U S A 105: 4340–4345. 8. Kibriya MG, Jasmine F, Argos M, Andrulis IL, John EM, et al. (2009) A pilot genome-wide association study of early-onset breast cancer. Breast Cancer Res Treat 114: 463–477. 9. Thomas G, Jacobs KB, Kraft P, Yeager M, Wacholder S, et al. (2009) A multistage genome-wide association study in breast cancer identifies two new risk alleles at 1p11.2 and 14q24.1 (RAD51L1). Nat Genet 41: 579–584. 10. Zheng W, Long J, Gao YT, Li C, Zheng Y, et al. (2009) Genome-wide association study identifies a new breast cancer susceptibility locus at 6q25.1. Nat Genet 41: 324–328. 11. Turnbull C, Ahmed S, Morrison J, Pernet D, Renwick A, et al. (2010) Genomewide association study identifies five new breast cancer susceptibility loci. Nat Genet 42: 504–507. 12. Cai Q, Long J, Lu W, Qu S, Wen W, et al. (2011) Genome-wide association study identifies breast cancer risk variant at 10q21.2: results from the Asia Breast Cancer Consortium. Hum Mol Genet 20: 4991–4999. 13. Fletcher O, Johnson N, Orr N, Hosking FJ, Gibson LJ, et al. (2011) Novel breast cancer susceptibility locus at 9q31.2: results of a genome-wide association study. J Natl Cancer Inst 103: 425–435. 14. Kim HC, Lee JY, Sung H, Choi JY, Park SK, et al. (2012) A genome-wide association study identifies a breast cancer risk variant in ERBB4 at 2q34: results from the Seoul Breast Cancer Study. Breast Cancer Res 14: R56. 15. Long J, Cai Q, Sung H, Shi J, Zhang B, et al. (2012) Genome-wide association study in east Asians identifies novel susceptibility loci for breast cancer. PLoS Genet 8: e1002532. 16. Shu XO, Long J, Lu W, Li C, Chen WY, et al. (2012) Novel genetic markers of breast cancer survival identified by a genome-wide association study. Cancer Res 72: 1182–1189. 17. Kiyotani K, Mushiroda T, Tsunoda T, Morizono T, Hosono N, et al. (2012) A genome-wide association study identifies locus at 10q22 associated with clinical outcomes of adjuvant tamoxifen therapy for breast cancer patients in Japanese. Hum Mol Genet 21: 1665–1672. 18. Clemons M, Goss P (2001) Estrogen and the risk of breast cancer. N Engl J Med 344: 276–285. 19. Li N, Dong J, Hu Z, Shen H, Dai M (2010) Potentially functional polymorphisms in ESR1 and breast cancer risk: a meta-analysis. Breast Cancer Res Treat 121: 177–184. 20. Cai Q, Shu XO, Jin F, Dai Q, Wen W, et al. (2003) Genetic polymorphisms in the estrogen receptor alpha gene and risk of breast cancer: results from the Shanghai Breast Cancer Study. Cancer Epidemiol Biomarkers Prev 12: 853– 859. 21. Zheng W, Long J, Gao YT, Li C, Zheng Y, et al. (2009) Genome-wide association study identifies a new breast cancer susceptibility locus at 6q25.1. Nat Genet 41: 324–328. 22. Stacey SN, Sulem P, Zanon C, Gudjonsson SA, Thorleifsson G, et al. (2010) Ancestry-shift refinement mapping of the C6orf97-ESR1 breast cancer susceptibility locus. PLoS Genet 6: e1001029. 23. Campa D, Kaaks R, Le Marchand L, Haiman CA, Travis RC, et al. (2011) Interactions between genetic variants and breast cancer risk factors in the breast and prostate cancer cohort consortium. J Natl Cancer Inst 103: 1252–1263. 24. Zhong H, Prentice RL (2010) Correcting ‘‘winner’s curse’’ in odds ratios from genomewide association findings for major complex human diseases. Genet Epidemiol 34: 78–91. 25. Pabalan NA (2010) Meta-analysis in cancer genetics. Asian Pac J Cancer Prev 11: 33–38. 26. Carlson RW, Allred DC, Anderson BO, Burstein HJ, Edge SB (2012) NCCN clinical practice guidelines for breast cancer (version 1.2012) http://www.nccn. org. 27. Lau J, Ioannidis JP, Schmid CH (1997) Quantitative synthesis in systematic reviews. Ann Intern Med 127: 820–826. 28. Higgins JP, Thompson SG, Deeks JJ, Altman DG (2003) Measuring inconsistency in meta-analyses. BMJ 327: 557–560.
PLOS ONE | www.plosone.org
29. DerSimonian R, Laird N (1986) Meta-analysis in clinical trials. Control Clin Trials 7: 177–188. 30. Thompson SG, Higgins JP (2002) How should meta-regression analyses be undertaken and interpreted? Stat Med 21: 1559–1573. 31. Thakkinstian A, McElduff P, D’Este C, Duffy D, Attia J (2005) A method for meta-analysis of molecular association studies. Stat Med 24: 1291–1306. 32. Mullen B MPBB (2001) Cumulative meta-analysis: A consideration of indicators of sufficiency and stability.: Personality and Social Psychology Bulletin. 1450– 1462. 33. Begg CB, Mazumdar M (1994) Operating characteristics of a rank correlation test for publication bias. Biometrics 50: 1088–1101. 34. Egger M, Davey SG, Schneider M, Minder C (1997) Bias in meta-analysis detected by a simple, graphical test. BMJ 315: 629–634. 35. Dai J, Hu Z, Jiang Y, Shen H, Dong J, et al. (2012) Breast cancer risk assessment with five independent genetic variants and two risk factors in Chinese women. Breast Cancer Res 14: R17. 36. Sueta A, Ito H, Kawase T, Hirose K, Hosono S, et al. (2012) A genetic risk predictor for breast cancer using a combination of low-penetrance polymorphisms in a Japanese population. Breast Cancer Res Treat 132: 711–721. 37. Kim HC, Lee JY, Sung H, Choi JY, Park SK, et al. (2012) A genome-wide association study identifies a breast cancer risk variant in ERBB4 at 2q34: results from the Seoul Breast Cancer Study. Breast Cancer Res 14: R56. 38. Long J, Cai Q, Sung H, Shi J, Zhang B, et al. (2012) Genome-wide association study in east Asians identifies novel susceptibility loci for breast cancer. PLoS Genet 8: e1002532. 39. Li G, Xiang YB, Courtney R, Cheng JR, Huang B, et al. (2011) Association of a single nucleotide polymorphism at 6q25.1,rs2046210, with endometrial cancer risk among Chinese women. Chin J Cancer 30: 138–143. 40. Long J, Shu XO, Cai Q, Gao YT, Zheng Y, et al. (2010) Evaluation of breast cancer susceptibility loci in Chinese women. Cancer Epidemiol Biomarkers Prev 19: 2357–2365. 41. Zheng W, Wen W, Gao YT, Shyr Y, Zheng Y, et al. (2010) Genetic and clinical predictors for breast cancer risk assessment and stratification among Chinese women. J Natl Cancer Inst 102: 972–981. 42. Cai Q, Wen W, Qu S, Li G, Egan KM, et al. (2011) Replication and functional genomic analyses of the breast cancer susceptibility locus at 6q25.1 generalize its importance in women of chinese, Japanese, and European ancestry. Cancer Res 71: 1344–1355. 43. Han J, Jiang T, Bai H, Gu H, Dong J, et al. (2011) Genetic variants of 6q25 and breast cancer susceptibility: a two-stage fine mapping study in a Chinese population. Breast Cancer Res Treat 129: 901–907. 44. Stevens KN, Vachon CM, Lee AM, Slager S, Lesnick T, et al. (2011) Common breast cancer susceptibility loci are associated with triple-negative breast cancer. Cancer Res 71: 6240–6249. 45. Mulligan AM, Couch FJ, Barrowdale D, Domchek SM, Eccles D, et al. (2011) Common breast cancer susceptibility alleles are associated with tumour subtypes in BRCA1 and BRCA2 mutation carriers: results from the Consortium of Investigators of Modifiers of BRCA1/2. Breast Cancer Res 13: R110. 46. Han W, Woo JH, Yu JH, Lee MJ, Moon HG, et al. (2011) Common genetic variants associated with breast cancer in Korean women and differential susceptibility according to intrinsic subtype. Cancer Epidemiol Biomarkers Prev 20: 793–798. 47. Jiang Y, Han J, Liu J, Zhang G, Wang L, et al. (2011) Risk of genome-wide association study newly identified genetic variants for breast cancer in Chinese women of Heilongjiang Province. Breast Cancer Res Treat 128: 251–257. 48. Antoniou AC, Kartsonaki C, Sinilnikova OM, Soucy P, McGuffog L, et al. (2011) Common alleles at 6q25.1 and 1p11.2 are associated with breast cancer risk for BRCA1 and BRCA2 mutation carriers. Hum Mol Genet 20: 3304– 3321. 49. Lakhani SR, Van De Vijver MJ, Jacquemier J, Anderson TJ, Osin PP, et al. (2002) The pathology of familial breast cancer: predictive value of immunohistochemical markers estrogen receptor, progesterone receptor, HER-2, and p53 in patients with mutations in BRCA1 and BRCA2. J Clin Oncol 20: 2310–2318. 50. Asselin-Labat ML, Vaillant F, Sheridan JM, Pal B, Wu D, et al. (2010) Control of mammary stem cell function by steroid hormone signalling. Nature 465: 798– 802. 51. Joshi PA, Jackson HW, Beristain AG, Di Grappa MA, Mote PA, et al. (2010) Progesterone induces adult mammary stem cell expansion. Nature 465: 803– 807.
10
December 2012 | Volume 7 | Issue 12 | e52445