Advances in display devices are facilitating the integration of stereoscopic ... development of stereoscopic content (Konrad and Halle 2007, Holliman et al. 2011,.
A comparative study using an autostereoscopic display with augmented and virtual reality Juan-J. Arino, M.-Carmen Juan, Jose-Antonio Gil-Gomez, Ramon Molla Instituto Universitario de Automática e Informática Industrial (ai2), Universitat Politècnica de València, C/ Camino de Vera, s/n Valencia, Spain Advances in display devices are facilitating the integration of stereoscopic visualization in our daily lives. However, autostereoscopic visualization has not been extensively exploited. In this paper, we present a system that combines Augmented Reality (AR) and autostereoscopic visualization. We also present the first study that compares different aspects using an autostereoscopic display with AR and VR, in which 39 children from 8 to 10 years old participated. In our study, no statistically significant differences were found between AR and VR. However, the scores were very high in nearly all of the questions, and the children also scored the AR version higher in all cases. Moreover, the children explicitly preferred the AR version (81%). For the AR version, a strong and significant correlation was found between the use of the autostereoscopic screen in games and seeing the virtual object on the marker. For the VR version, two strong and significant correlations were found. The first correlation was between the ease of play and the use of the rotatory controller. The second correlation was between depth perception and the game global score. Therefore, the combinations of AR and VR with autostereoscopic visualization are possibilities for developing edutainment systems for children. Keywords: augmented reality; virtual reality; comparative study, autostereoscopy
1. Introduction In recent years, advances in display devices have provided great potential for the development of stereoscopic content (Konrad and Halle 2007, Holliman et al. 2011, Konrad 2011). As Froner et al. (2008) concluded, the selection of the 3D display must be done carefully for tasks that rely on human depth perception. There are different ways of showing 3D content, but one of the most interesting is the use of autostereoscopic displays (Dogson 2005, Urey et al. 2011). Autostereoscopic displays allow the perception of 3D content without the need for wearing special glasses or other headgear. Nowadays, autostereoscopic displays are being greatly improved. One of the problems preventing widespread use is that the optical grid needed to generate the 3D view reduces the quality of the image when it is used for 2D. However, several solutions have been proposed to fix this problem (Montgomery et al. 2001). Recently, Kwon and Choi (2012) proposed a method to solve the degradation of resolution in autostereocopic displays using a multi-directional backlight unit and a LCD panel with a time-sequential operation. Currently, most of the autostereoscopic displays are multiview (Zhang et al. 2010). Multiview displays are capable of providing the perception of movement parallax, thus, for the user, the view of a scene changes with the movement of the head. To achieve this, the displays work with several images (usually from 5 to 9) that are visible from different angles. Many fields have benefitted from the possibilities offered by 3D displays. In the field of education, 3D content notably increases the possibilities for using technology in this area. The most basic approach is to use 3D content, but in 2D displays. Following this approach, Jeong et al. (2011) completed a system that helped students understand
the concepts of dynamics more easily, but they used a common monitor; the main drawback of the experiment was the limitation in depth perception because the students were limited to seeing a 2D projection of the 3D content. Recently, Blum et al. (2012) presented an augmented reality magic mirror system for teaching anatomy. This magic mirror concept had previously been used in other fields (Ehara and Saito 2006, Fiala 2007, Eisert et al. 2008), but, in this system, markers for special clothing were unnecessary because the authors used Ms Kinect® to track the user. The limitation of the system was depth perception because the authors used conventional 2D monitors. However, since the system managed the depth data of the scene, it may be possible to use these data to display the contents in a 3D display. Ilgner et al. (2006) evaluated the usefulness of a 3D display in teaching undergraduate medical students. They used stereoscopic video of different microsurgical operations with students that had no experience in such operations. The authors determined that all of the participants noted that the additional depth perception helped them understand the relation of anatomical structures. Later, Kaufmann and Meyer (2008) and Kaufmann and Csisinko (2011) also used 3D displays for an augmented reality application for teaching mechanics. In their set-up, a head-mounted display was used. The main disadvantages of this solution were the problems reported with head-mounted displays. These were problems that had already been identified by a great number of studies (Wenzel et al. 2002, Morphew et al. 2004): eye-strain, dizziness, nausea, etc. To avoid these problems, Petkov (2010) created virtual reality applications for educational purposes using a multiview autostereoscopic display. Petkov (2010) found that, with applications of this kind, the students got absorbed in a real atmosphere that they would not be able to witness in a natural way. To show these 3D contents, there are two options for virtual elements: Virtual Reality (VR) (Burdea and Coffet 2003) or Augmented Reality (AR) (Azuma 1997). In VR, all the elements displayed are virtual, even though the aim is for the user to perceive these virtual environments as real environments. In AR, virtual content is merged with real content. Depending on the specific application, the use of VR, AR, or a combination of the two could be possible. However, choosing the best option is commonly a key factor in determining the level of success of the application. For this reason, there are several studies that compare the use of VR vs. AR in different fields (Botden et al. 2007, Jones et al. 2008, Juan and Pérez 2010). Botden et al. (2007) studied the difference in realism, haptic feedback, and didactic value between AR and VR laparoscopic simulation; they suggested that, in general, the AR laparoscopic simulator is more realistic than the VR laparoscopic simulator. One of the limitations of this study was that the display devices were 2D, not 3D. Jones et al. (2008) measured egocentric depth perception under both VR and AR conditions. In the control condition involving a 3D display, the authors used a head-mounted display. They found that depth perception was underestimated in VR, but no underestimation was observed in AR. This finding is in line with previous studies (Loomis and Knapp 2003, Livingston et al. 2005, Swan et al. 2007). In the field of psychology, Juan and Pérez (2010) developed an AR system and a VR system that included acrophobic scenarios. The users that participated in that study wore head-mounted displays. The authors compared the levels of presence and anxiety in both systems. For the sense of presence and anxiety, the authors did not find significant differences between the two systems. The authors concluded that AR is likely to be as effective as VR for acrophobia treatment. Nevertheless, to our knowledge, no studies comparing the benefits of VR vs. AR using autostereoscopic displays have been published. This is the first work that performs an evaluation of VR versus AR in autostereoscopic displays. To select the
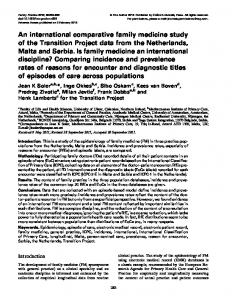
display for this study, we first discarded 2D displays, such as conventional monitors, TVs, or projectors because depth perception is a key factor in our study. We also discarded 3D displays that need special glasses or other headgear due to the limitations of these devices: 1) limitations of natural movement (for instance, if they have wires or if they are heavy); 2) the limit of only one user per device; 3) to avoid the problems associated with head-mounted displays: e.g. eye-strain, dizziness, nausea, etc (Wenzel et al. 2002, Morphew et al. 2004). For all of these reasons, we finally chose autostereoscopic displays. Our study focused on children because we wanted to evaluate depth perception and the usability of AR and VR alternatives in order to apply the results in educational systems. We plan to apply the results of our study in this field because there is great potential for AR and VR in educational contexts according to previous works (Pan et al. 2006, Chittaro and Ranon 2007, Monahan et al. 2008). Our primary hypothesis was that there would be significant differences between the autostereoscopic visualization with AR and the autostereoscopic visualization with VR. Our secondary hypothesis was that the children would prefer the AR system. The rest of the paper is structured as follows. Section 2 presents the materials and methods involved in the work. Section 3 describes the study carried out. Section 4 analyzes the results. Finally, section 5 presents conclusions and future works. 2. Technical characteristics We developed an autostereoscopic application that can work in two modes, AR (Figure 1a) and VR (Figure 1b). It is basically an AR application in which we can enable or disable the integration with the real scene. When the application switches to the VR mode, the object is not seen in the real environment, although the interaction with the object is done in the same way (moving a rotatory controller). Like most AR systems, our AR system is based on markers. A marker is a white square with a black border inside that contains symbols or letters. The system detects the marker and places the virtual object on it, scaling and orientating it correctly. To better integrate the marker with the scene and to make the manipulation of the marker easier, we created a rotating support where the marker is placed. The support and the table were decorated according to the scene that was going to be shown on top of the marker (Figure 1a).
(a)
(b)
Figure 1a. AR version. Table with the marker on the rotator support, camera, and autostereoscopic display. Figure 1b. A child plays with the VR version
2.1. Hardware A Logitech camera (model C905) was used to capture the real world scene with the following configuration: captured image size - 800 x 600 at 30 fps; focal length - 3.7 mm. and automatic focus adjustment. An autostereoscopic XYZ display was used for the visualization. The model used was XYZ3D8V46, with a resolution of 1920x1080 pixels (Full HD) and a size of 46”. This model can generate 8 views. The technology used by this screen to generate the views is known as LCD/lenticular (Omura 1998). The maximum pop-out stereoscopic effect is around 90 cm, and the range where the stereoscopic effect is correctly viewed goes from 1.5 m to 9 m. In the lenticular lens, an array of cylindrical lenses directs light from alternate pixel columns to a defined viewing zone, allowing each eye to receive a different image at an optimum distance (Figure 2).
Figure 2. Method of operation for an autostereoscopic lenticular lens. 2.2. Software Both modes of the application (AR and VR) have been developed with the base of the AR version. The difference is that in the VR version the scene graph is modified to not show the real world scene, only to show the virtual object. The osgART library has been used to develop the game. The osgART library was developed by HITLab NZ (www.artoolworks.com/community/osgart). It is a C++ library that allows developers to build AR applications using the rendering capabilities of Open Scene Graph (OSG) and the tracking and registration algorithms of ARToolKit. OSG is a set of open source libraries that primarily provides scene management and graphics rendering optimization functionality to applications. It is written in portable ANSI C++ and uses the standard OpenGL low-level graphics API. ARToolKit is an open source vision-tracking library that allows a wide range of AR applications to be easily developed. We used OSG version 2.8 and osgART version 2.0. For the autostereoscopic visualization, we used the
Mirage SDK (http://www.mirage-tech.com). This SDK is used to calculate an autostereoscopic view for an OSG scene. It performs the necessary calculations to generate 8 views of a scene and interlace them. 3D Scene
3D Camera
Hud (Camera)
Cameras 1 to 8
Geode
2D Scene
AR Transform (OsgART) Model Transform
Background video (Only for the AR mode)
Proxy Node
Scene Model 1
Scene Model n
Scene Light
Figure 3. OSG graph used to create the stereoscopic scene integrating osgART with a 3D layer that is specific for the autostereoscopic display . The osgART library is not capable of rendering autostereoscopic scenes. To generate the scene for the autostereoscopic display, 8 different views must be generated. To accomplish this goal, we added a new layer to osgART, integrating the Mirage SDK with osgART. Figure 3 (top-down) shows how this integration has been achieved. An OSG scene is defined by a graph composed by a hierarchy of nodes. The nodes can be cameras, scenes, groups of models, transformation matrices, etc. In our case, we created a graph (2D Scene) to integrate the real video (Background video) with the virtual objects using the transformation matrix provided by the marker detection library (AR Transform - OsgART) and the transformations required to create the autostereoscopic image with the use of a shader. We used the transformation matrix (Model Transform) calculated by osgART to place and scale the virtual objects on the real scene. As Figure 3 shows, the scene models (Scene Models 1 .. n), scene light (Scene Light), and scene transformations (Model Transform) depend on the osgART AR transform. Therefore, all the virtual objects that compose the scene are translated and scaled according to the marker. However, instead of using osgART for rendering the scene, we built an OSG graph (2D Scene) where the scene was rendered for 8 virtual cameras (Cameras 1 to 8) and mixed into an autostereoscopic view with the use of the Mirage SDK (3D Scene). Only in the AR mode is the captured video rendered as a background video at the furthest position. Therefore, it does not have a stereoscopic effect. This background is the same for the 8 views. The system renders the virtual object on top of the video background and at the marker position. To get the stereoscopic effect for the virtual
object, 8 different views from 8 different virtual cameras are calculated. The virtual cameras are located around the real camera position. Finally, the 8 views are mixed into one interlaced image that is shown on the autostereoscopic display. With this technique, in the AR mode, we get the effect of having the virtual object floating “outside the TV” in front of the viewer and at the marker position while the captured video stream is displayed at the background without stereoscopic effect. In the VR mode, we have the object without the video background floating in front of the TV, but we can manipulate and interact with the object in the same way as with the AR mode (by moving the marker). OsgART provides the transformation matrix for the marker. We use that matrix to draw the virtual objects. However, besides this matrix, we also apply 8 different transformations to each object, one for each virtual camera. We use a parameter called “fusion distance” to define how much the virtual object pops out of the screen. It defines how close to the viewer the object is seen flying in front of the viewer out of the screen. A high value for this parameter makes the stereoscopic effect more noticeable. However, if the value is too high, the image is not shown correctly; if it is too low, the stereoscopic effect almost disappears. Finally, the 8 views of each object are mixed into one single image that uses the osgART camera view and projection matrix to draw the virtual object, and, in the case of the AR mode, to draw it over the background video. As a consequence of this technique and the characteristics of the autostereoscopic display, in the AR mode, if the users move their head slightly from left to right, or alternatively close one of their eyes, they can see how the virtual object changes its position over the background video as if it were really floating between the viewer and the display. One drawback of this type of display is that the quality of the image is not as good as in a 2D view. We had to adjust the fusion distance parameter to define how much the virtual object pops out of the display. The more the object pops out, the lower the quality, and it is more difficult to get a good point where the viewer can have a clean view of the virtual object. We tried to adjust the fusion distance parameter to get a good and noticeable stereoscopic effect, but without too much loss of quality. The fusion distance parameter optimum value was the same for AR and VR. 3. Study The aim of the study is to test if there are differences between augmented and virtual reality regarding the perception of depth using autostereoscopic displays. This study focuses on simple 3D games for children. For this purpose, the same application was tested by two groups of children: the first group with integration of the virtual objects in the real world (AR); and the other group, displaying the 3D objects without any integration, just floating in front of the screen (VR). The game was a simple application where a scene was displayed over a marker. The children had to move the marker to find specific objects within the scene. We chose a model of the Taj Mahal to which we added some objects to find and count. We decided to develop a very simple game that could be played easily by any children between 8 and 10 years old without previous training. The counting objects where placed so that the user had to rotate the marker completely to have a whole view of the scene. This assured that the children had a complete interaction with the scene. In order for the children to find and count the specific object, the stereoscopic view had to be very clear.
3.1. Participants Thirty-nine children took part in the study. Their ages were between 8 and 10 years old (8.8±0.62). The children attended the school [to complete in the final version]. The participants were divided into two groups of twenty children. 3.2. Procedure The participants entered the activity room one by one to avoid that one child's opinion could affect the others. The participants were assigned to one of these two groups:
Group A: Participants that played with the AR application first and afterwards played with the VR application. Group B: Participants that played the VR game first and afterwards played with the AR application.
Figure 4 shows graphically the procedure for both groups. The protocol is given as follows: (1) The participant came into the room where the study took place. We started the AR or VR application as designated and let the child play for a few seconds to get used to the controller (Figure 1) and to get a correct view angle. (2) We let the user know what he or she had to find and which objects to count inside the scene and the time started to count. (3) If the answer given by the child was not correct, he or she had to look for the objects and count again until he or she was right. (4) The time used to complete the task was stored. After finishing the task, if the child wanted to, the person in charge let him or her play some more. (5) The participant was asked to fill out a questionnaire. The questionnaire has nine questions (Table 1). Q1-Q5 and Q8 use a 5-point Likert scale, where 1 represents the lowest value and 5 the highest value. Q6 uses a 7-point Likert scale. Q7 ranges from 1 to 10, where 10 is the highest score. (6) The test was repeated, but changing the game from VR to AR or vice versa. (7) The participant was asked to fill out another questionnaire for the second test (Table 2). This test has seven questions. Questions from one to four are questions that were already presented in the previous test. Questions five to seven are new questions where participants can indicate any comment to get an overall impression.
Figure 4.Study procedure. Two systems and two questionnaires were used.
Table 1. First questionnaire (1stQ). Q1 Did you have fun playing? (from 1 to 5) Q2 Would you like to play again with other objects? (from 1 to 5) Q3 Do you find it easy to play? (from 1 to 5) Q4 Would you like to use the rotatory controller on more games? (from 1 to 5) Q5 Would you like to use this TV in more games? (from 1 to 5) Q6 Rate from 1 to 7 the feeling of viewing the Taj Mahal out of the screen. (from 1 to 7) Q7 Please rate the game from 1 to 10, where 10 is the highest score. (from 1 to 10) Q8 Did you like to see the Taj Mahal on the black box? (Only for the AR game). (from 1 to 5) Table 2. Second questionnaire (2ndQ). Q1 Did you have fun playing? Q2 Do you find it easy to play? Q3 Rate from 1 to 7 the feeling of viewing the Taj Mahal out of the screen. Q4 Please rate the game from 1 to 10. Q5 What game did you like the most? (AR or VR) Q6 Why? Q7 What do you like the most of the entire experience? The goal of this question is to know the overall impression of the participants. 4. Results This section presents the statistical analysis of the data. This statistical analysis uses parametric tests, such as the t-test and ANOVA, which are robust to violations of equality of variances if the ratio between the largest variance and the smallest variance is not larger than 4:1. Our analysis is within this margin. We also provide effect sizes (Cohen’s d and generalized eta-squared) in order to have a measure that is independent from the sample sizes and to have a magnitude of the significant differences found, which is not measured by p-values. First, we checked if there were statistical differences between the AR and VR games for the first play. All of the participants were considered. The significance level was set to 0.05 in all tests. Table 3 shows the means and the standard deviations comparing the results for the first questionnaire for both groups. The results from all the questions Q1-Q7 did not show statistically significant differences between the two systems when tests were applied. However, from the means, the following can be observed. With regard to the fun experienced (Q1), in both cases, the score was very high. The participants that played the AR game were more willing to play with different objects (Q2). With regard to the difficulty (Q3), the results indicate that it was easy for the children to complete the game in both cases, even though the score was slightly higher for the VR game. Q4 is related to the game controller used to make it easier to move the marker. The participants liked that kind of controller. Since there was a large display in both the AR and the VR games, the participants were enthusiastic and declared that they wanted to use that display with more games (Q5). However, the score was higher for the participants that played with the AR game (4.88 vs. 4.76). When we asked about the feeling of having the virtual object out of the screen (Q6), in both cases, the score was high. The users rated the AR game higher (Q7). However, there was no
statistically significant difference. This is probably because the participants also liked the VR game very much and both scores were around 9.5 on a scale of 10. The participants that played the AR game were asked an additional question. We wanted to know if they liked seeing the virtual object on the marker with the stereoscopic effect (Q8). The score obtained was 4.9 out of 5. With regard to the time that the participants used to complete the game, there were no statistically significant differences between the AR and the VR (a mean of 38.32 seconds for the AR game and 35.28 seconds for the VR game, with t[34]=0.51 and p=0.61, Cohen's d = 0.17). Nevertheless, when the results are displayed in a box plot (Figure 5), note that the distribution is skewed right for the VR values, while the distribution is skewed left for the AR values. Table 3. Means and standard deviations for independent groups that played the AR or VR game first, and t-tests assuming equal variances. Q1
Q2
Q3
Q4
Q5
Q6
Q7
AR
4.68 ± 0.65
3.10 ±0.44
4.68 ±0.57
4.86 ±0.36
4.86 ± 0.36
6.18 ± 1.18
9.64 ± 0.66
VR
4.76 ±0.56
2.88 ±0.49
4.76 ±0.56
4.94 ± 0.24
4.76 ± 0.44
5.65 ±1.84
9.35 ± 1.06
t
-0.42
1.42
-0.45
-0.82
0.72
1.10
1.03
p
0.68
0.16
0.65
0.42
0.48
0.28
0.31
d.f.
37
36
37
36
36
37
37
Cohen's d
‐0.14
0.46
‐0.15
‐0.27
0.23
0.36
0.33
Max value
5
5
5
5
5
7
10
Figure 5. Time needed to complete the game. In order to determine whether using one of the two systems first has some effect on the scores for the second system, the sample was divided into two groups (the participants who used AR first and the participants who used VR first). Paired t-tests assuming equal variances were applied to the scores given to all the questions. Table 4 shows the means and the standard deviations according to the order of exposure, and for participants that played with the AR game first and later played with the VR game. For all the questions, there were no statistically significant differences. For the fun experienced (Q1), the scores were really high in both cases. With regard to the difficulty
of the game (Q3/Q2), they found both games easy to play. Again, they gave a very high rating to the feeling of viewing the virtual object out in front of the display with the AR game (Q6/Q3) and a bit lower with the VR game. There were also small differences with regard to the global scores (Q7/Q4); the AR game was rated higher than the VR game. In both cases, the scores were really high, around 9.5 on a scale of 10. Table 4. Means and standard deviations according to the order of exposure, participants that played with the AR game first and later played with the VR game. Paired t-tests were applied to the scores given to all of the questions. Q1/Q1
Q3/Q2
Q6/Q3
Q7/Q4
4.68 ± 0.65
4.66 ± 0.57
6.18± 1.18
9.64 ± 0.66
VR 2nd
4.77 ± 0.53
4.73 ± 0.55
5.95 ± 1.33
9.45 ± 0.91
t
-0.49
-0.27
0.74
1.16
p
0.63
0.79
0.47
0.26
d.f.
21
21
21
21
Cohen's d
-0.1
-0.06
0.16
0.25
AR 1
st
Table 5. Means and standard deviations according to the order of exposure, participants that played with the VR game first and later played with the AR game. Paired t-tests were applied to the scores given to all of the questions. Q1/Q1
Q3/Q2
Q6/Q3
Q7/Q4
VR 1
st
4.76 ± 0.56
4.76 ± 0.56
5.65 ± 1.84
9.35 ± 1.06
AR 2
nd
4.82 ± 0.39
4.81 ± 0.40
6.82 ± 0.54
9.82 ± 0.54
t
-0.37
-0.44
-2.91*
-2.22*
p
0.72
0.67
0.01*
0.04*
d.f.
16
15
16
16
Cohen's d
-0.09
-0.11
-0.71
-0.54
* Statistically significant differences.
For the participants that played with the VR game first and later played with the AR game, paired t-tests were applied to the scores given to all of the questions. Table 5 shows the means and the standard deviations according to this order of exposure. In all cases, the children gave a higher score to the AR game. For the fun experienced (Q1), they had fun playing both games. For the ease of play (Q3/Q2), as mentioned above, they found it a bit easier to play the second game. There were statistically significant differences about the feeling of viewing the object out of the screen (Q6/Q3). The game global score (Q7/Q4) was also statistically significantly better for the AR game. This time, after playing the VR game, the AR game got a much higher score. For question Q5 (which game did you like the most?), 81% of the participants declared their preference for the AR version. Figure 6 shows the preference taking into account the order of exposure. Almost all of the participants that liked the VR game the most played with this version first.
Figure 6. User’s visualization preference. With regard to what the participants liked the most about the entire experience, the responses could be divided into three groups. A total of 53% gave responses related to the game itself and the way of interacting with the virtual object with the rotatory controller. A total of 34% of the participants liked the stereoscopic experience the most, and 13% liked how the virtual objects were integrated in the real scene with the AR game.
Figure 7. Significant correlations of the VR questionnaire. The correlation analysis for the responses given by the participants that played the VR game first reported some interesting results (Figure 7). A strong and significant correlation between Q3 and Q4 was found. This means that ease of play is closely related to the use of the rotatory controller. There was also a strong and significant correlation between Q6 and Q7. The results indicate that viewing the virtual object out of the screen is closely related to the game global score. Q6 was also correlated with Q1 and Q2. The correlations were not strong, but they were statistically significant. We found very different correlations for the answers given by the participants that played the AR game first. We found a strong and significant correlation between Q5 and Q8 (0.8, p < 0.001). This indicates that the autostereoscopic visualization is related to the AR experience.. There were no strong correlations, but they were significant between Q6 and Q4 (0.52, p = 0.02); and Q7 and Q1 (0.49, p = 0.02). (Removed)We also performed a mixed design ANOVA test in order to take into consideration several factors simultaneously. The factors of system, gender, grade, and age between subjects were considered. The questions analyzed were: time required to complete the task, Q1 (fun), P3 (play back), P4 (easy to use), P8 (global score). A multifactorial ANOVA revealed that there were only two significant differences. One of them was for Q1 and for the Grade factor (F[1,24]=13.40, p