A COMPARISON BETWEEN CONVENTIONAL TRIAXIAL AND PLANE-STRAIN COMPRESSION ON A PARTICULATE SYSTEM USING 3D DEM Md. MAHMUD SAZZAD and KIICHI SUZUKI about the authors
corresponding author Md. Mahmud Sazzad Rajshahi University of Engineering & Technology, Department of Civil Engineering Rajshahi-6204, Bangladesh E-mail:
[email protected] Kiichi Suzuki Saitama University, Department of Civil and Environmental Engineering Saitama 338-8570, Japan
Abstract Granular materials such as sand are subjected to different stress paths depending on the in-situ conditions. For example, a granular system under the foundations experiences conventional triaxial compression (CTC), while it experiences plane-strain compression (PSC) in the case of the embankment of roads. Due to the difference in the stress paths, the behavior of granular materials also becomes different. This paper aims at comparing the behavior of granular materials under CTC and PSC conditions using the 3D discrete-element method (DEM). An isotropically compressed dense sample consisting of 8000 spheres was prepared numerically using periodic boundaries. The CTC and PSC tests were simulated using the same isotropically compressed dense sample to compare and explore the macro- and micro-mechanical responses of granular materials without any bias from the initial fabric of the numerical sample. Qualitatively, the simulated stress-strain responses are consistent with that observed in the experimental studies. The dilatancy index is found to be independent of the stress paths used in the present study. The b value (defined as b = (σ2 − σ3)/(σ1 − σ3) where σ1, σ2 and σ3 are the stresses in the x1 -, x2 - and x3 - directions, respectively) - axial strain curve has a close similarity with the stress ratio - axial strain curve for the PSC test. The evolution of the coordination number and the sliding contact fraction is independent of the stress paths. A link between the macro- and micro-quantities is observed and a unique macro-micro relationship is noticed, regardless of the stress paths applied in this study.
Keywords conventional triaxial compression, plane-strain compression, micro response, DEM
1 INTRODUCTION Granular materials are often subjected to different stress paths depending on the in-situ conditions. For example, the in-situ condition below a foundation is representative of the CTC stress path (a stress path in which σ1 increases, keeping σ2 and σ3 equal and constant), while the in-situ condition in the case of dams or the embankments of roads corresponds well to the PSC stress path (a stress path in which σ1 increases, keeping σ3 constant and the strain in x2 - direction e2 zero). These variations in the stress path also alter the mechanical behavior of the granular system. Several studies have been carried out in the experimental works considering such variations in the stress path. For example, Cornforth [1] reported that the internal friction angle is more than 4˚ greater for the plane-strain condition than the triaxial condition in the dense state. Terzaghi et al. [2] reported similar results. In another study, Peters et al. [3] reported that shear-band initiation is easier under the plane-strain condition than the axis-symmetric condition. The above-mentioned studies reveal that the mechanical behaviors are different depending on the stress paths applied during the experiments. Although several comparison-based studies were reported earlier in the experimental works, they have several shortcomings. For example, the same sample cannot be prepared for the CTC and PSC tests in the experimental studies. However, it is important that the initial fabric of the tested samples be identical to avoid any discrepancy or biasness of the results in comparisonbased studies. This inherent limitation of the experiments can be avoided by using the numerical methods such as DEM [4], which has already been recognized as a useful tool for a comprehensive study of the behavior of granular materials (e.g., [ 5, 6, 7, 8]). Besides, the evolution of micro features can be studied and compared exclusively
ACTA GEOTECHNICA SLOVENICA, 2012/2
17.
M. M. SAZZAD & K. SUZUKI: A COMPARISON BETWEEN CONVENTIONAL TRIAXIAL AND PLANE-STRAIN COMPRESSION ON A PARTICULATE SYSTEM USING 3D DEM
using DEM. In spite of this fact, limited studies were reported in the literature that considered CTC and PSC using DEM. For example, Ng [9] considered several stress paths with different sample preparation methods to investigate the macro and micro responses of granular materials. His result indicated that the friction angle of the PSC test simulation was the highest for all the samples. However, many macro- and micro-mechanical results were not considered in earlier DEM-based studies. The objective of this paper is to make a comprehensive study for CTC and PSC and to present a comparison of the macro and micro behaviors of granular materials exclusively for CTC and PSC using 3D DEM. The macro responses including the dilatancy index, b value, etc., are presented and the micro responses, such as the coordination number, sliding contact fraction, contact fabric, etc. are reported. The relationship between the macro stress ratio and micro fabric ratio has also been established.
2 DEM AND THE COMPUTER PROGRAM OVAL DEM is a numerical method pioneered by Cundall and Strack [4], which has been used in different disciplines of science and engineering and proved its usefulness. The major advantage of DEM is that the kinematics of each particle can be monitored and extracted at any stage of the simulation. DEM-based studies have been widely used to enhance the understanding of granular matter’s behavior and to explain the experimentally observed phenomena from the micro-mechanical point of view. A detailed explanation of DEM was reported in Cundall and Strack [4]. The basic idea of DEM is very simple. In DEM, each particle is modeled as an element. An element in DEM can make and break contact with other elements involved in the model. The calculation cycle in DEM involves the alternate use of Newton’s second law of motion and a force displacement law. The translational and rotational accelerations of the particles are computed using the following expressions:
mx i = å F i , i = 1,2,3 Iq = å M
(1)
(2)
where Fi are the force components on each particle; M is the moment on each particle; m is the mass; I is the moment of inertia; xi are the components of translational acceleration; and q is the rotational acceleration of the particle. In this study, the computer program OVAL [10] is used. The program is written in FORTRAN and can run on
18. ACTA
GEOTECHNICA SLOVENICA, 2012/2
both the Windows and Linux platforms. The effectiveness of OVAL has already been recognized (e.g., [5, 11]). A simple contact model consisting of two linear springs, one in the normal direction and the other in the tangential direction, and a frictional slider has been incorporated. The viscosity coefficient for translational and rotational body damping used in OVAL represents a fraction of the critical damping 2 mkn and 2r Ikt where r, kn and kt denote the radius, normal and tangential contact stiffness of the particle, respectively.
3 SAMPLE PREPARATION METHOD A cubic sample consisting of 8000 spheres of 16 different sizes (i.e., diameters) ranging from 3 to 4.5 mm was prepared for the simulation of the CTC and PSC tests. At first the spheres were placed at the equally spaced grid points of the cubic frame. The diameters of the spheres were chosen randomly. The initial sample generated in this way was very sparse. The initial sparse sample was compressed isotropically to 100 kPa using periodic boundaries in different stages. The interparticle friction was intentionally set to zero during the preparation of the isotropically compressed sample to ensure the preparation of a dense sample. The desired interparticle friction coefficient was used later during the shear. The void ratio and coordination number of the isotropically compressed dense sample are 0.57 and 5.94, respectively.
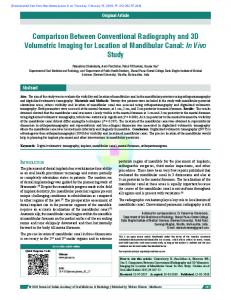
4 SIMULATION OF CTC AND PSC TESTS The same isotropically compressed dense sample was used for the simulation of the CTC and PSC tests so that the initial fabric of the sample prior to the shear remains the same. The simulation of the CTC test was conducted by reducing the sample height slowly downward with a small strain increment of 0.00002% in the vertical direction (x1 - direction) while keeping the stresses in x2 - and x3 - directions equal and constant (i.e., 100 kPa). On the other hand, the simulation of the PSC test was carried out by reducing the sample height slowly with a small strain increment of 0.00002% in the vertical direction (x1 - direction) downward, while maintaining the stresses in the x3 - direction constant (i.e., 100 kPa) and keeping the strain in the x2 - direction zero (i.e., de2 = 0). The simulation condition of the CTC and PSC tests with reference axes is also depicted in Fig. 1 for more clarity. The DEM parameters used in the numerical simulations are presented in Table 1.
M. M. SAZZAD & K. SUZUKI: A COMPARISON BETWEEN CONVENTIONAL TRIAXIAL AND PLANE-STRAIN COMPRESSION ON A PARTICULATE SYSTEM USING 3D DEM
Table 1. DEM parameters used in the numerical study. DEM parameters
Value
Normal contact stiffness (N/m)
1 × 10⁶
Tangential contact stiffness (N/m)
1 × 10⁶
Mass density (kg/m3)
2650
Increment of time step (s)
1 × 10⁻⁶
Interparticle friction coefficient
0.50
Coefficient of viscosity for translational and rotational body damping
0.05
5 MACRO-MECHANICAL BEHAVIOR
Figure 1. A cubic element with simulation conditions and reference axes.
5.1 STRESS-STRAIN RESPONSES The simulated stress-strain response for the CTC and PSC is depicted in Fig. 2. It is clear that the stress ratio σ1/σ3 increases with the axial strain e1 followed by strain softening, whatever the case may be. However, softening behavior is dominant and clear in the case of the PSC test. This tendency is consistent with the experimental evidence (e.g., [1]) in a qualitative sense. Note also that the PSC has a higher stress ratio at the peak state than CTC during the simulation.
The evolution of the volumetric strain ev with e1 for the CTC and PSC tests is shown in Fig. 4. Here, ev = dV V where V represents the initial volume of the dense sample prior to shear and dV represents the change of volume during the shear. A positive value ev in Fig. 4 represents compression, while a negative value of ev indicates dilation. Note that the dilation in the case of the PSC test overrides the dilation in the case of the CTC test although the difference is small.
The evolution of the strains during the CTC and PSC tests is depicted in Fig. 3 where e1 , e2 and e3 represent the strains in the x1 -, x2 - and x3 - directions, respectively. Only 5% of e1 is considered in the plot. It is clear in Fig. 3 that the change of e2 for the PSC test remains zero throughout the test as required. The evolution of e3 is the same as e2 for the CTC test as expected. It demonstrates the ability of the DEM to simulate qualitatively the CTC and PSC tests for the dense sample.
The evolution of the dilatancy index with e1 is depicted in Fig. 5. The dilatancy index is defined here as DI = -dev de1 , where dev represents the change of the volumetric strain and de1 represents the change of the axial strain. Note that the tendency of the evolution of the dilatancy index is independent of the stress paths applied in this study.
Figure 2. Stress-strain response for CTC and PSC tests.
Figure 3. Evolution of strains for CTC and PSC tests.
ACTA GEOTECHNICA SLOVENICA, 2012/2
19.
M. M. SAZZAD & K. SUZUKI: A COMPARISON BETWEEN CONVENTIONAL TRIAXIAL AND PLANE-STRAIN COMPRESSION ON A PARTICULATE SYSTEM USING 3D DEM
Figure 4. Evolution of volumetric strain for CTC and PSC tests. Figure 6. Evolution of the b value with e1 for the CTC and PSC tests.
it reaches a peak value, and beyond the peak the b value reduces with the increase of e1 . The b value at the peak stress state for PSC is 0.396, while the same at 10% axial strain is 0.314.
6 MICRO-MECHANICAL RESPONSES 6.1 EVOLUTION OF THE COORDINATION NUMBER Figure 5. Evolution of dilatancy index for CTC and PSC tests.
5.2 EVOLUTION OF
b
VALUE
The term ‘ b’ was first introduced by Habib [12] and defined in the non-dimensional form as follows: b=
s2 - s3 s1 - s3
(3)
In CTC test, σ2 = σ3. Consequently, the b value should be zero throughout the test. However, in the PSC test, the b value is not constant, rather it is variable. In the present numerical study, the evolution of the b value with e1 is computed and depicted in Fig. 6. It is clear that the b value remains constant throughout the numerical simulation for the CTC test, as expected. However, the b value varies with e1 for the PSC test and the evolution tendency of the b value with e1 has a close similarity to that of σ1/σ3 with e1 , at least in a qualitative sense. The b value gradually increases with the increase of e1 until
20. ACTA
GEOTECHNICA SLOVENICA, 2012/2
The evolution of the coordination number with e1 for the CTC and PSC tests is shown in Fig. 7. The coordination number is defined as twice the total number of contacts to the total number of particles used in the simulation. Note that the coordination number decreases significantly at the beginning stage of simulation, regardless of the stress paths. It is probably due to the rearrangement of the fabric when the isometrically compressed dense sample is subjected to either the CTC or PSC tests. Later, the rate of the change of coordination number becomes very small for large strain. It should also be noted that the evolution of the coordination number is independent of the stress paths applied (i.e., CTC and PSC) during the simulation.
6.2 EVOLUTION OF THE SLIDING CONTACT FRACTION The evolution of the sliding contact fraction for the CTC and PSC tests is shown in Fig. 8. The sliding contact fraction is defined here as the number of sliding contacts to the number of contacts at a given state of the simulation.
M. M. SAZZAD & K. SUZUKI: A COMPARISON BETWEEN CONVENTIONAL TRIAXIAL AND PLANE-STRAIN COMPRESSION ON A PARTICULATE SYSTEM USING 3D DEM
section. The evolution of the contact fabric is usually quantified using the fabric tensor given by Satake [13], considering all the contacts as follows: N
H ij =
Figure 7. Evolution of coordination number with e1 for the CTC and PSC tests.
1 c a a å ni n j , i, j = 1,2,3 N c a=1
(4)
a where ni is the i−th component of the unit normal vector at the α−th contact and Nc is the number of contacts. The contacts in a granular system can be further characterized as the strong contacts and the weak contacts in order to quantify their individual roles (e.g., [8, 14]). In the present study, a contact is defined as a strong contact if the normal contact force for a given contact is greater than the average normal contact force, while a contact is defined as a weak contact if the normal contact force for a given contact is less than or equal to the average normal contact force. The average normal contact force is calculated as follows: n fave =
1 Nc
Nc
å fin
(5)
i =1
where fin is the normal contact force at the i−th contact n and fave is the average normal contact force considering all the contacts. Based on the classification of the total contacts into strong and weak contacts, two additional fabric tensors for the strong and weak contacts can be defined. The fabric tensor for strong contacts can be defined as follows [10]: H ijs
Figure 8. Evolution of sliding contact fraction with e1 for the CTC and PSC tests.
The sliding contact fraction in the plot is expressed as a percentage. The sliding contact fraction peaks at a very early stage of the simulation regardless of the stress paths. Note that the evolution of the sliding contact fraction is independent of the stress paths (i.e., CTC and PSC).
6.3 EVOLUTION OF THE CONTACT FABRIC The DEM is supposed to be the best numerical method to understand the evolution of the fabric and the microstructure of granular materials, because experimentally it is not easy to measure and extract all the fabrics directly for any given state. The evolution of the contact fabric for the CTC and PSC tests is reported in this
1 = Nc
N cs
å nisnsj ,
i, j = 1,2,3
(6)
s =1
where nis is the i−th component of the unit normal vector at the s−th strong contact and N cs is the number of strong contacts. Similar to the fabric tensor for strong contacts, the fabric tensor for the weak contacts can also be defined as follows: Nw
H ijw =
1 c w w å ni n j , i, j = 1,2,3 N c w =1
(7)
w where ni is the i−th component of the unit normal vector at the w−th weak contact and N cw is the number of weak contacts.
Fig. 9 shows the evolution of the fabric ratio H11/H33 with F1 for the CTC and PSC tests considering all the contacts. Note that the fabric ratio H11/H33 is almost 1.0 at the zero strain level, which indicates the isotropic distribution of the contact fabric prior to the shear. A value greater than 1.0 or less than 1.0 indicates the anisotropic distribution of the contact fabric. It should be noted that H11/H33
ACTA GEOTECHNICA SLOVENICA, 2012/2
21.
M. M. SAZZAD & K. SUZUKI: A COMPARISON BETWEEN CONVENTIONAL TRIAXIAL AND PLANE-STRAIN COMPRESSION ON A PARTICULATE SYSTEM USING 3D DEM
Figure 9. Evolution of H11/H33 with e1 for the CTC and PSC tests.
Figure 10. Evolution of H11 H 33 with e1 for the CTC and PSC tests. s
s
gradually increases with F1 until it reaches a peak value, which is followed by a decrease in the fabric ratio, regardless of the stress path. This increase of H11/H33 with F1 is the consequence of the formation of new contacts in the vertical direction (x1 - direction) and the disintegration of contacts in lateral directions. However, the dominant evolution of H11/H33 is noticed for the PSC condition as a constraint in the strain is applied in the x2 - direction during the shear. A comparison of Fig. 9 with Fig. 2 shows that the shapes of the curves of these two figures do not correspond well with each other. For example, the stress ratio peaks at the small strain level as seen in Fig. 2 whereas the fabric ratio peaks at a large strain level as seen in Fig. 9 when all contacts are considered. Fig. 10, on the other hand, shows the evolution of the s s H 33 fabric ratio H11 with F1 for the CTC and PSC tests considering only the strong contacts. A comparison of Fig. 10 with Fig. 2 indicates a strong correspondence between the stress ratio-axial strain curve and the fabric ratio-axial strain curve for strong contacts, regardless of the stress paths. It should also be noted that the anisotropy induced during the PSC test is higher than that during the CTC test. This large difference in the evolution of the induced anisotropy in the PSC test may be a consequence of the restriction of the boundary movement in the x2 - direction. It can be presumed that the higher peak stress in the case of the PSC test may be strongly correlated with such a dominant evolution of the induced anisotropy in the case of the PSC test. w w H 33 Fig. 11 shows the evolution of the fabric ratio H11 with F1 for the CTC and PSC tests considering the weak contacts only. Note that the fabric ratio is even smaller than 1.0 at the very early stage of the simulation. This indicates that the anisotropy induced for weak contacts at the initial stage of the simulation has an opposite
22. ACTA
GEOTECHNICA SLOVENICA, 2012/2
Figure 11. Evolution of H11 H 33 with e1 for the CTC and PSC tests. w
w
privilege direction compared to the privilege direction of the induced anisotropy considering strong contacts. However, such an evolution characteristic changes as the sample is subjected to further deformation. The fabric w w H 33 ratio H11 gradually increases with F1 and becomes greater than 1.0 as the strain increases. It indicates that the privilege direction of the induced fabric anisotropy for weak contacts gradually changes its direction as the strain increases. Note that the induced fabric anisotropy for weak contacts is also dominant in the case of the PSC test; however, the difference is small compared to the difference noticed in the case of strong contacts.
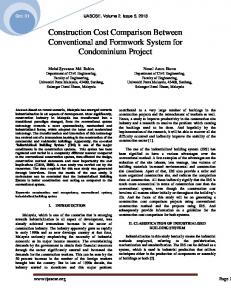
6.4 MACRO-MICRO RELATIONSHIP A strong correlation between the stress ratio-axial strain curve (Fig. 2) and the fabric ratio-axial strain curve for strong contacts (Fig. 10) is noticed. Accordingly, it is
M. M. SAZZAD & K. SUZUKI: A COMPARISON BETWEEN CONVENTIONAL TRIAXIAL AND PLANE-STRAIN COMPRESSION ON A PARTICULATE SYSTEM USING 3D DEM
the fabric ratio exists, regardless of the stress paths applied in the present study.
REFERENCES [1]
[2]
[3] s
s
Figure 12. Relationship between σ1/σ3 and H11 H 33 considering strong contacts for the CTC and PSC tests.
[4]
intended to establish a relationship between the macro s s H 33 quantity σ1/σ3 and the micro quantity H11 during the CTC and PSC, considering only the strong contacts. Fig. 12 shows the relationship between the stress ratio σ1/σ3 and s s H 33 the fabric ratio H11 , considering the strong contacts. For a clear view, data up to 1% of the axial strain is shown in Fig. 12. A unique macro-micro relationship is observed, regardless of the stress paths applied in the present study.
7 CONCLUSIONS A numerical investigation using DEM is carried out to explore and compare the macro- and micro-mechanical behaviors of granular materials. A simulation of the CTC and PSC tests was conducted on the same dense sample without any bias from the initial fabric prior to shear. Different macro results, in particular, the evolution of the b value with axial strain are reported. The evolution of different micro variables is presented as well. A link between the macro and micro quantities is also established. Some of the points of this study can be summarized as follows. These points are valid for dense samples only. i) The b value-axial strain curve resembles the stress ratio-axial strain curve for the PSC test. ii) The evolution of the coordination number and the sliding contact fraction is independent of the stress paths. iii) The fabric ratio that develops during the PSC test is larger than that during the CTC test, regardless of the type of contact. iv) The shape of the fabric ratio-axial strain curve is similar to that of the stress ratio-axial strain curve when strong contacts are considered in quantifying the fabric tensor. v) A unique relationship between the stress ratio and
[5]
[6]
[7]
[8]
[9]
[10]
[11]
[12]
[13]
[14]
Cornforth, D.H. (1964). Some experiments on the influence of strain conditions on the strength of sand. Geotechnique, Vol. 14, No. 2, pp. 143–167. Terzaghi, K., Peck, R.B., Mesri, G. (1996). Soil Mechanics in Engineering Practice, John Wiley & Sons, New York. Peters, J.F., Lade, P.V., Bro, A. (1988). Shear Band Formation in Triaxial and Plane Strain Tests. Advanced Triaxial Testing of Soil and Rock, ASTM STP977, Robert T., Donaghe, Ronald C., Chancy and Marshall L. Silver Eds., Philadelphia, pp. 604-627. Cundall, P.A., Strack, O.D.L. (1979). A discrete numerical model for granular assemblies. Geotechnique, Vol. 29, No. 1, pp. 47-65. Kuhn, M.R. (1999). Structured deformation in granular materials. Mechanics of Materials, Vol. 31, No. 6, pp. 407-429. Ng, T.-T. (2001). Fabric evolution of ellipsoidal arrays with different particle shapes. Journal of Engineering Mechanics, ASCE, Vol. 127, No. 10, pp. 994-999. Radjai, F., Roux, S., Moreau, J.J. (1999). Contact forces in a granular packing. Chaos, Vol. 9, No.3, pp. 544-550. Sazzad, M.M., Suzuki, K. (2010). Micromechanical behavior of granular materials with inherent anisotropy under cyclic loading using 2D DEM. Granular Matter, Vol. 12, No. 6, pp.597–605. Ng, T.-T. (2005). Behavior of gravity deposited granular material under different stress paths. Canadian Geotechnical Journal, Vol. 42, No. 6, pp. 1644–1655. Kuhn, M.R. (2006). OVAL and OVALPLOT: Programs for analyzing dense particle assemblies with the discrete element method. http://faculty. up.edu/kuhn/oval/doc/oval_0618.pdf (last accessed: January 31, 2012) Kuhn, M.R. (2005). Are granular materials simple? An experimental study of strain gradient effects and localization. Mechanics of Materials, Vol. 37, No. 5, pp. 607-627. Habib, P. (1953). Influence of the variation of the average principal stress upon the shearing strength of soils [in French]. Proceedings of the 3rd International Conference on Soil Mechanics and Foundation Engineering, Vol. 1, pp. 131-136. Satake, M. (1982). Fabric tensor in granular materials. Proceeding of IUTAM Symposium on Deformation and Failure of Granular Materials, Delft, Balkema, pp. 63–68. Radjai, F., Wolf, D.E., Jean, M., Moreau, J.J. (1998). Bimodal character of stress transmission in granular packing. Physical Review Letters, Vol. 80, No. 1, pp. 61-64.
ACTA GEOTECHNICA SLOVENICA, 2012/2
23.