A Comparison of International Sustainable Building Tools – An Update The 17th Annual Pacific Rim Real Estate Society Conference, Gold Coast 16-19 January 2011 Richard Reed (contact author) Deakin University Melbourne Victoria Australia 3010
[email protected] Sara Wilkinson Deakin University Melbourne Victoria Australia 3010
[email protected] Anita Bilos International Real Estate Business School (IREBS) University of Regensburg Germany
[email protected] Karl-Werner Schulte International Real Estate Business School (IREBS) University of Regensburg Germany
[email protected]
Key words: Sustainability, green buildings, rating tools, perception, real estate. Abstract: This paper examines international rating tools for sustainable buildings and recent global trends. A rapid increase has been observed in the number of sustainable buildings entering the real estate market. Many of these buildings differ considerably with respect to their sustainable features, either from a design and/or performance basis, although a wide range of sustainable building assessment tools are now promoted and readily available throughout the world. Unfortunately many of these tools differ considerably with regards to what they actually assess, how they operate and whether they can be compared directly with assessment tools from other countries. It is important to undertakes a unique international assessment of global sustainability tools and critique their individual strengths and weaknesses. Most importantly in this paper the focus is placed on which tools from different countries can be directly compared with each other i.e. is a five star building with one rating system directly comparable with another rating system. The results of this paper will lessen much of the confusion and uncertainty that accompanies assessment tools for sustainable buildings, which in turn will assist investors, developers, tenants and government bodies to make informed decisions about green buildings. In addition it is envisaged that removing some of the uncertainty associated with sustainable buildings will increase the transparency for stakeholders and assist them to embrace sustainable buildings with more confidence.
Introduction There is little dispute that buildings are substantial CO2 emitters and contribute substantially to climate change (Reed and Wilkinson 2008). This argument is based on the environmental footprint of buildings, especially the high reliance on resources due to increased use of air conditioning and heating. At the same time it has been demonstrated that the value of a building can be linked to the building’s perceive level of sustainability (Myers et al. 2008), where the stakeholders including building owners, tenants and property valuers. The problem lies with how to distinguish the level of sustainability in a building which will facilitate a more direct comparison between each building. This is where sustainability rating tools can play a major role. Countries have introduced rating tools to improve knowledge about the level of sustainability in the stock. It is argued that the individual characteristics of each country, such as the climate and type of building stock, necessitate an individual sustainability rating tool for that country. The downside is that to varying degrees the rating tools for different countries use different parameters. This has created complications for stakeholders such as investors purchasing buildings in different countries; an understanding of the differences between markets is increasingly harder (Dixon et al. 2008). This paper investigates the evolution of global building rating tools with the emphasis on office buildings. Consideration is given to different tools from different countries. It examines how rating tools have evolved and which specific countries and their respective rating tools have contributed to their global uptake. A comparison of uptake of the BRREAM Europe rating tool and Australia’s Green Star tool is provided.
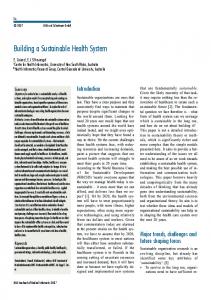
International tools Whilst there are no identical parcels of land in the world (Australian Property Institute 2007), in a similar manner every country is unique. However there are common approaches to valuing land/buildings and analysing property values, though it appears that environmental rating tools have not followed this trend (figure 1). On appearance they are relatively complex. Figure 1. Complex System of International Rating Tools
Although it is possible to compare the value of an office building in New York, Berlin, London or Melbourne which may be valued on a ten year discounted cash flow valuation approach (after allowing for exchange rates), making a similar direct comparison of the rating of the same building is complex.
There has been an unwillingness to compromise or admit a particular rating system may not be the possible best tool, which has been a barrier to developing a global rating system (table 1). The unwillingness to compromise or admit a rating system may be deficient in certain areas may be a lack of knowledge and understanding on the part of those valuing or marketing buildings. A starting point is to reflect on the current development status of rating tools internationally as shown in figure 2. It is observed that most countries with existing or emerging rating tools have developed economies and often a property market where information is available. The diverse range of countries and associated climates is noted. Figure 2. Countries with Established or Emerging Rating Tools
The next step is to identify countries which have expressed interest according to World Green Building Council (WGBC) data (figure3), where it is observed these countries include the Middle East, Africa and Asia which are located relatively close to the equator. Figure 3. Countries with Various Rating Tool Development Levels
Often a rating tool can be linked back to common aspects with other systems, often depending on the particular influences upon each property market. Many rating tools have been modified and adopted from earlier models that were originally developed in other countries. For example it is possible to trace many systems back to the LEED and BREEAM rating systems (figure 4). The benefits of having
a common foundation may assist with moving towards an internationally accepted rating tool, especially when there are recent signs of change and compromise. For example it is reported that three of the most common rating tools, namely BREEAM, LEED and Green Star, are seeking to develop common metrics which will assist international stakeholders to compare buildings in different cities using an ‘international language’ (Kennett 2009). Figure 4. LEED and BREEAM based Rating Tools
Whilst there has been fragmentation of rating systems as shown in figure 1, it is argued that the World Green Building Council has the largest global coverage (figure 5). There are common links in the US and Canada, some parts of Europe, Japan, Australia an South Africa. Figure 5. Countries with Rating Tools only accepted by WGBC
Global tools The importance of sustainable development has been mooted for many years (Bruntland 1987) and gathered momentum, as a result of major economic reports in developed countries, such as the Stern Report to the UK government (Stern 2005) and the Garnaut Report to the Australian Federal Government (Garnaut 2007). Both reports concluded that a ‘business as usual’ approach in respect of
greenhouse gas emissions would lead to global economic and environmental catastrophe in the long term. Both accepted the IPCC predictions on climate change, the impetus to the adoption of sustainability within the built environment gathered pace. It is now the case that a majority of professionals and scientists accept that action is needed to mitigate climate change through the reduction of greenhouse gas emission in particular and the adoption of sustainability practices (Reed and Wilkinson 2008). The importance of sustainable development for the built environment professions has been targeted in taskforces internationally (DETR 1999a; Dixon et al. 2008; Egan 2004). In addition the UK Government’s Sustainable Development Educational Panel set a target of achieving the inclusion of sustainable development criteria within all course accreditation requirements for the professions and industry lead bodies by 2010 (DETR 1999b). In response the major professional body representing land, construction and property globally, the Royal Institution of Chartered Surveyors (RICS), adopted sustainability policy principles with the ” intention to place sustainability at the heart of all its activities” (RICS 2007b). Not only do built environment professionals need to learn of the rationale for sustainable development and to appreciate the key issues, but they need to learn how and when to apply the many environmental assessment tools now out in the marketplace. Research (Upstream 2003; Pett et al. 2004; Sayce et al. 2004), suggested there is an increasing focus on providing a ‘business case’ for sustainable development as a result of the emergence of planning policies and EU Directives (for example, the Energy Performance of Buildings Directive (IPF 2007). This is linked with the internal corporate drivers such as the demand for improved risk management and better governance structures to deal with environmental risk in the real estate sector (Sayce & Ellison 2007). But what assessment tools are at hand for built environment professionals to use to support advice to clients? In addition what areas do the tools cover and omit? EPSRC (BRE, 2004) found approximately 600 tools that measured the social, environmental and economic dimensions of sustainability. In professional practice many of these tools can be used with regards to the use and management of rural and natural resources, as well as across the whole lifecycle of buildings. An example is Australia’s Green Star, which is equivalent to the UK BREEAM (Building Research Establishment Environmental Assessment Method) tool. These tools provide a broad ranging assessment of the environmental impact of a building. Each rating scheme features a suite of tools developed for different land uses such as commercial, industrial, retail and educational and health buildings. The issues covered include those relating to the global, local and internal environments, focusing on design stage assessments (i.e. new build and refurbishment) and also to the ongoing operation and management of the building. Each tool leads to a rating of the building which is used to market the building. Green Star adopts a star rating from 1 to 6, whereas BREEAM adopts a scale from pass to excellent. The question arises: are the tools equal or are the standards embraced by one tool markedly different to those adopted by others? Is a 6 Star Green Star rating equal to an Excellent BREEAM score? Furthermore, with increasingly global financial and property markets, do the tools need to be benchmarked in a clear and transparent way? Clearly some regional variation is appropriate to accommodate local environmental conditions. Many of the tools have been developed to determine whether capacity exists for further development, or whether a development is sustainable, or whether progress is being made towards sustainable development. ‘Indicators’ are an important part of the range of the tools available and relate mainly to parameters that can be measured to show trends or sudden changes in a particular condition. It is important to distinguish between those tools used for measurement (identifying variables measuring sustainable development and collecting relevant data), and those used for assessment (evaluating performance against criteria), as well as those tools which can be used to effect a move towards sustainable development by changing practice and procedures (see BRE 2004, Therivel 2004). The tools attempt to (a) achieve continuous improvement to optimise building performance and minimise environmental impact, (b) provide a measure of a building’s effect on upon the environment and (c) set credible standards’ by which buildings can be judged objectively. There are numerous benefits of using rating tools. The overall goal is to have a common set of criteria and targets, and these are typically embodied in design guides that help professionals to design, construct and manage property more sustainably. One benefit is raising awareness of environmental issues and standards and the assessment tools recognise and encourage best practice and stimulate the market for sustainable construction and property. This is apparent is the marketing and rental levels
achieved by sustainable buildings (PCA 2008). A further benefit of the tools is that they provide a verifiable method and framework for professionals to use. In many cases the tools set criteria and standards which go beyond the building codes and regulations in the countries in which they are used. However it is also possible to link the tools to government policies and regulations such as certification and labels and incentive initiatives. The EU Energy Performance Directive is a good example of this in practice. Finally, on an individual building level the adoption of assessment tools improves property management and prioritization of maintenance and operational needs to enhance sustainability. Despite the many positive aspects, there are perceived shortcoming. One of the developers of the US LEED tool wrote in 2006 that LEED was ‘broken’ and needed to be fixed (Schendler 2006) arguing there was a disconnect between the concept and the reality of the tool in use. The assessment was prohibitively expensive, designers and owners were driven by scoring points and not by sustainability; a phenomenon term ‘LEED brain’. The energy modeling in the tool was ‘fiendishly complicated’ and the process was crippled by bureaucracy. Of greater concern was the ‘overblown claims for green buildings’ - thus was it possible that buildings having high LEED ratings were not actually that sustainable?(Schendler 2006). To-date the overall building assessment tools have been voluntary and not mandatory. Even the 2003 EU Energy Performance Directive is compulsory but requires disclosure of the energy performance rather than attainment of stringent performance targets. In Australia the Mandatory Disclosure Certificate of energy performance at the point of sale was enacted in 2010 and some impact may be expected in the future. The intention of the tools is to benchmark key sustainability standards and over time to increase standards, so whilst some are weak in areas changes will occur. Evidence suggests built environment professionals have embraced the SD agenda across many developed countries and are looking to the increased use of assessment tools. As yet however, we know very little about the equivalence and comparative uptake of the tools used internationally.
The development of rating tools The current era of rating tools commenced in 1990 with the introduction of the BREEAM rating tool, and five years later this was followed by the French system, HQE, and by LEED in 2000 (figure 6). Further analysis of this diagram confirms that the evolution of rating systems into different countries is largely based on the initial rating systems; for example see BREEAM (Netherlands), LEED (Emirates) and Green Star (South Africa). Figure 6. Timeline of the Development of Rating Tools
Table 1. Table of Existing Rating Tools
Comparing BREEAM, LEED, Green Star and CASBEE BRE compared four environmental tools in 2008 and table 2 illustrates the comparisons. The assessment criteria were: launch date, rating scales, information gathering, assessment, third party validation, certification and labelling, update process, governance, required qualification of assessors, assessor CPD requirements, compound annual growth rate, assessment fee, certification fee, cost of appeals, credit interpretation request costs, number of units certified, number of domestic and non domestic building already certified, availability of assessment information. Table 2 highlights considerable variation across the tools. When the process of certification was evaluated, differences existed. For example, CASBEE has a six stage process from start to finish, whereas Green Star has nine steps to certification, LEED has eight and BREEAM has six (BRE 2008).
Table 2. Comparison of BREEAM, LEED, Green Star and CASBEE Launch Date Ratings
Weightings
Information Gathering
BREEAM 1990 PASS/GOOD/VERY GOOD/EXCELLENT/ OUTSTANDING Applied to each issue category (consensus based on scientific/open consultation) Design/management team or assessor
Third Party Valuation
BRE
Certification labelling
BRE
Update Process Governance
Annual UK Accreditation Service (UKAS) Competent persons scheme Carry out at least one assessment per year 93% (1998-2007)
Required qualification Assessor/AP CPD requirements Compound Annual Growth Rate Assessment Collation Fee* Certification fee Cost of credit appeals Credit interpretation requests cost/allowance Number of units certified** Domestic Non-Domestic Availability of assessment information
LEED 1998 Certified/Silver/Gold/Pl atinum All credits equally weighted, although the number of credits related to each issue is a de facto weighting Design/management team or Accredited Professional N/A
USGBC (United States Green Buildings Council) As required USGBC Passed exam No CPD requirements 86% (2002-2007)
Green Star 2003 One Star/Two Star/Three Star/Four Star/Five Star/Six Star Applied to each issue category (industry survey based)
CASBEE 2004 C/B-/B+/A/S
Design team
Design/management team
GBCA (Green Building Council of Australia) nominated assessors GBCA
Third Party Agencies e.g. JSBC (Japan Sustainable Building Consortium) JSBC
Annual GBCA
As required JSBC
Training scheme and exam Status renewed every three years Not available
N/A
£2015-4030 ($4002-8004) £2550-£7185 ($5063-14268) £403 ($800)
Unknown
Highly complex weighting system applied at every level
N/A Not available
£2000-£10000 ($3971-19857) £740-£1500 ($1469-2979) Free
Up to £37,770 ($75000)
Free/unlimited number
£111 ($220) unlimited number
Free/Maximum of two
Unknown
110808
1823
50
23
£1133-£11331 ($2250-22500) £252 ($500)
Unknown Unknown
109450 540 N/A N/A 1358 1283 50 23 Estimator tools are The tools are available The tools are available The assessment tool available free of charge. free of charge and free of charge and the and guidance is Guidance is currently technical guidance is technical manual is available free of charge only available to people available for £100 available for £224 in Japanese and who attend the training ($200) ($444) English. courses [Note: Amounts are in £ and US$ using these exchange rates: £0.50360 = US$1, £0.40311=AUS$1; US$0.80445=AUS$1. *Assessment costs for different schemes may include varying tasks. This makes a direct comparison difficult.** As of February 2008]. (Source: BRE 2008)
Table 4 shows that when BREEAM, LEED, Green Star and CASBEE are compared there is variation in the standards of each scheme. BREEAM sets higher standards for building management compared to LEED and Green Star. LEED and BREEAM score equivalent scores for energy and transport whilst Green Star falls behind. In terms of health and well being issues BREEAM again exceeds the other schemes. Not surprisingly given the record breaking drought conditions in Australia up to 2010, the water conservation standards in Green Star are highest compared to the other schemes. BREEAM in the UK has the highest standards in respect of land use and ecology where the density of the population
is highest. Overall the schemes promote standards reflecting local sustainability issues and environmental conditions.
Table 3. Issue weighting comparison table
(Source: BRE 2008) When BRE assessed the schemes under normalised conditions across all the rating criteria the following results were found as shown in table 4 (BRE, 2008). LEED, Green Star and CASBEE assessments are not equivalent to BREEAM. In a particular scenario a six star Green Star building (the highest Green Star rating possible) is less sustainable than a Platinum LEED building (the highest LEED rating possible) and approximately equal to a ‘very good’ BREEAM rated building.
Table 4. Comparison of Rating Tools
(Source: BRE 2008)
Baseline assumptions Building code or building regulation standards vary from country to country and an assumption in comparisons has been that all countries start from the same baseline standard. This is not the case, for example building code standards in the USA are lower than those found in the UK Building Regulations (BRE 2008). The reliance on local building standards as a minimum starting point for the systems means that the ratings they subsequently award are affected. Therefore the LEED system sets lower standards than the UK BREEAM system. The Australian Green Star system has lower standards than the UK BREEAM system. This is an issue for businesses wishing to set global standards across their portfolios, because choosing one standard may lead to lower rating for their properties in some countries than if they followed the local system.
Uptake of BREEAM Europe. Being the first environmental building rating tool developed, BREEAM clearly lead the field in the total number of buildings assessed overall (Reed et al, 2010), however this paper makes an examination of the extent and nature of buildings assessed in Europe in 2008 and 2009 on a country basis. Note that the UK is excluded from these figures as there is a separate UK BREEAM rating tool for that market. The analysis examines uptake of the BREEAM tools in the office, retail and industrial sectors. Table 5 BREEAM certified buildings in Europe 2008 (source: BRE 2011) 1. 2. 3. 4. 5. 6. 7. 8. 9. 10. 11. 12.
2008 Austria Belgium France Germany Hungary Italy Poland Romania Russia Spain Sweden Turkey
Total certified
Offices 0 6 5 0 2 2 1 1 1 1 0 0 19
Retail 1 1 2 1 0 0 0 0 0 2 0 1 8
Industrial 0 0 1 0 0 0 0 0 0 0 1 0 2
Table 5 above shows the total number of buildings certified in 2008 in Europe in a total of twelve nations. Projects certified in 2008 would have had commitment prior to the Global Financial Crisis of 2008-2009. Thirty two office, retail and industrial buildings were certified in 2008. Table 5 shows that overall the office sector is leading the way with 19 buildings certified, followed by retail and then industrial. On a country basis clear leaders in the sustainable office sector were Belgium and France, followed by Hungary and Italy. Within the retail sector again France had the equal highest number of sustainable retail buildings with Spain. Other countries certifying retail buildings were Austria, Belgium, Germany and Turkey. With regards to industrial buildings only two were certified in 2008 with France and Sweden leading the way. Figure 7 BREEAM Europe Certified Buildings 2008 (source BRE 2011). 7 6 5 4 3
offices
2
retail
1
industrial
0
When the level of ratings achieved within the office sector is considered it is clear that most offices achieved a ‘Very Good’ rating followed by ‘Excellent’ and then ‘Good’, no ‘Pass’ ratings were recorded
in 2008 (figure 8). The market appears to have aimed for high ratings in the period leading up to 2008. Figure 8 Number and level of office building ratings 2008 (Source: BRE, 2011). 12 10 8 6 4 2 0
Number of office buildings rated
Pass
Good
Very good Excellent
The ratings for retail buildings showed that most achieved a ‘very good’ rating but no ‘excellent’ was achieved (figure 9). The level of attainment overall is lower with a higher proportion of ratings at ‘good’ and ‘pass’. Figure 9 Number and level of retail building ratings 2008 (Source: BRE 2011). 5 4 3 Number of retail buildings rated
2 1 0 Pass
Good
Very good Excellent
When the ratings of industrial buildings are examined, the Swedish building achieved a pass and the French building was awarded a ‘good’ rating. Such results indicative the challenges of achieving high ratings in this sector. In 2009 the total number of certified building under the BREEAM Europe tools increases significantly from 29 to 55 (table 6). As with 2008, most (some 52) are in the office sector. It is considered that the buildings which achieved certification in 2009 would have been committed largely prior to the GFC, however given the shorter overall construction times the absence of any buildings rated within the industrial land use indicates the GFC had taken effect possibly in this sector. In addition three retail buildings were certified in 2009, compared to eight in 2008. Table 6. Total BREEAM Europe certified buildings by type and country 2009 (Source BRE 2011). 1. 2. 3. 4. 5. 6. 7. 8. 9. 10.
2009 Austria Belgium Czech Republic Finland France Germany Iceland Ireland Jersey Luxembourg
offices 1 12 2 4 13 0 2 2 1 7
retail 0 0 0 0 2 1 0 0 0 0
industrial 0 0 0 0 0 0 0 0 0 0
11. 12. 13. 14.
Poland Romania Russia Turkey
2 2 2 2 52
Total number
0 0 0 0 3
0 0 0 0 0
On a country basis the clear leaders in the sustainable office sector were Belgium and France as in 2008, followed by Luxembourg (figure 10). There is however a reasonable, and growing albeit modestly, number of nations certifying sustainable offices in 2009. Within the retail sector again France had the highest number of sustainable retail buildings with Germany achieving one building. No other European countries certified retail buildings in 2009. Figure 10 BREEAM Europe Certified Buildings by type and country 2009 (source BRE 2011). 14 12 10 8 6
offices
4
retail
2
industrial
0
In 2009 the level of ratings achieved within the office sector is not listed on the BRE website and it is not possible to determine whether the overall level of ratings increased from 2008 to 2009. The ratings for retail buildings showed that two of three achieved a ‘very good’ rating and one ‘excellent’ was achieved. The level of attainment overall has higher than 2008 with no ratings at ‘good’ and ‘pass’ level (figure 11). Figure 11 Number and level of retail building ratings 2009 (Source: BRE, 2011). 2.5 2 1.5 1 0.5 0 Pass
Good
Very good
Excellent
No ratings of industrial buildings were undertaken in 2009. To date no data has been made publicly available on the BRE website for 2010 certifications; however it is considered that the impact of the GFC would have had an effect reducing numbers of certified buildings especially in the countries affected more severely by the economic situation and who had started to certify stock such as Spain, Portugal and Ireland.
Uptake of Green Star in Australia In Australia the data is not listed on an annual basis for certified Green Star projects. According to the Green Star website there are a total of 375 listed projects which include health and education buildings as well as office interiors and ratings for ‘design’ and ‘as built’. Only office, retail and industrial buildings with as built rating are used in this analysis. To date a total of 30 offices buildings are listed as rated, with two retail projects and two industrial buildings. On a star rating basis, the 5 Star level of attainment is most frequently occurring, with 17 buildings achieving this rating (figure 12). Four and six star ratings are fairly equal. Figure 12. Total number of office buildings with As Built Green Star Certification in Australia as of 2011 (source: ABGC, 2011). 18 16 14 12 10 8 6 4 2 0 4 Stars
5 Stars
6 Stars
On a state analysis, most rated office buildings are located in New South Wales, followed by Queensland and then Victoria and South Australia (figure 13). No certified as built offices are found in Western Australia. The number of buildings certified in Queensland is surprisingly high given that Victoria has a higher population and larger Metropolitan and business district. Figure 13. Total number of office buildings with As Built Green Star Certification by State as of 2011. (Source: ABGC, 2011). 12 10 8 6 4 2 0 ACT
NSW
QLD
SA
VIC
Analysis of certified buildings to total population, total land area and population density. A nations land size does not appear to influence the uptake of certified buildings largely however population density does (see table 8). Not surprisingly it is countries with higher population densities such as France and Belgium which have embraced sustainable buildings and certification. This would be explained by the number of people which have to be accommodated within a relatively small amount of space per person. With Australia however the situation is different; it has a large land area and a very low population density and yet has delivered, relatively speaking a large number of certified projects to the market. In total 34 ‘as built’ offices, and retail and industrial buildings have been certified since the
rating tool was developed and launched. For office building rating the profile of level of ratings is similar with most in the second highest tier (Very Good for BREEAM and 5 Stars for Green Star). It is not possible to compare industrial and retail ratings as the data is missing or incomplete. Table 8. Population, Land Area and Population Density. (Source: Countries of the World, 2011).
1. 2. 3. 4. 5. 6. 7. 8. 9. 10. 11. 12. 13. 14. 15.
Country Austria Belgium France Germany Hungary Italy Portugal Poland Romania Russia Spain Sweden Turkey Czech republic Luxembourg
Total Europe Australia Total
Population 8372930 10827519 65447374 81757600 10013628 60340328 10636888 38167329 21466174 141927297 46951532 9366092 72561312 10512397 502207 588850607 22421417
Area (sq. Km) 83858 30510 547030 357021 93030 301230 92391 312685 237500 17075200 504782 449964 780580 78866 2586 20947233 7686850
Density (sq. Km) 99.85 354.88 119.64 229 107.64 200.31 115.13 122.06 90.38 8.31 93.01 20.82 92.96 133.29 194.2 2.92
Conclusion BRE concluded there a high levels of variation between the systems for the same ‘grade’ or ‘rating’ that might be expected – that is BREEAM Excellent and a 6 Star Green Star office building are not equivalent in terms of sustainability features or environmental impact (BRE, 2008). Green Star when applied to UK building rated those buildings higher than the UK BREEAM assessment method. BRE stated none of the systems they examined (BREEAM, CASBEE, LEED and Green Star) travelled well in terms of comparison. For the international assessment market to mature more transparency is required between rating tools. Transparency should lead to increased competition, and produce an environment that tends towards improvement of standards as owners compete to demonstrate their commitment to the environment and the highest possible standards of performance. Standards work more effectively if common metrics are agreed for key issues such as greenhouse gas emissions. Common standards are a pre-requisite for the next stage of development. Eventually a market may emerge where licensing, cross certification and multiple labelling occurs. Such a system would allow owners to buy into local market standards and regional and international standards (BRE, 2008). This paper has conducted an investigation into the international evolution of sustainable rating tools for buildings, predominantly office buildings. In an era of international investment where it is possible to compare valuations of buildings in different countries, unfortunately rating tools do not exhibit the same level of comparability due to their unique characteristics and focus. This may hinder the take-up rate of sustainable rating tools and be a barrier to increasing the knowledge. The comparison of the uptake of the BREEAM Europe tool and Australia’s Green Star showed that the impact of the GFC was not apparent in the office sector for Europe in 2008 and 2009, however results
for 2010 and beyond may show lower growth and uptake. Significantly this paper has taken another perspective that of population size, density and land area to view the uptake of certified sustainable buildings. European countries with high population densities appear to have embraced the sustainable office tool. Up take of the retail and industrial tools is lower, partly reflecting the later development of the tools and the overall number of new buildings constructed in the sector. Australia, with its low population density bucks the European trend and performance reflects a strong commitment in the property and construction sector to deliver sustainability within the built environment. Given that the Green Star tool does lead to lower levels of sustainability compared to BREEAM the challenge is to increase the proportion of 6 Star rated stock.
References ABGC (2011). See http://www.gbca.org.au/greenstar-projects/ accessed January 14th 2011. Australian Property Institute (2007), The Valuation of Real Estate, R.Reed (ed.), Australian Property Institute, Canberra. BRE. (2011). See http://www.breeam.org/page.jsp?id=205 accessed January 13th 2011. BRE (2008) A Discussion Document Comparing International Environmental Assessment Methods for Buildings. BRE, Glasgow. BRE (2004) Assessment of Sustainability Tools, BRE, Glasgow. BRE (2003) Carbon Dioxide Emissions from non-domestic buildings 2000 and Beyond, BRE, Watford. Brundtland Commission (1987) Our Common Future, World Commission on Environment and Development, New York. Corenet Global (2004) Corporate Real Estate 2010: Sustainability and Corporate Social Responsibility. Countries of the World (2011). http://www.worldatlas.com/aatlas/populations/ctypopls.htm accessed January 14th 2011. DETR (1999) Urban Taskforce Report: Towards an Urban Renaissance, DETR, London. Dixon, T., Colantonio, A., Shiers, D., Reed, R., Wilkinson, S. & Gallimore, P. (2008), ‘A green profession? A global survey of RICS members and their engagement with the sustainability agenda’ in Journal of Property Investment and Finance, vol.26 no.6, pp. 460-481. Egan, R. (2004) Skills for Sustainable Communities, Office of the Deputy Prime Minister. IPD (2007) Occupier Satisfaction Index, Investment Property Databank (IPD) (available from: http://www.occupier-satisfaction.co.uk/). IPF (2007) The Energy Performance of Buildings Directive and Commercial Property: A Situation Review, Investment Property Forum (IPF). Jansen, M. (2007), ‘Seen to be Green’ in Property Week, 26 January, pp.66-69. Keeping, M., and Shiers, D.E. (2004) Sustainable Property Development: A guide to real estate and the environment, Blackwell Science Ltd, Oxford. Kennett S. (2009), ‘BREEAM and LEED to work together on new global standard’ in Building UK, www.building.co.uk (date accessed 03/03/09). Kinge Sturge (2009), European Property Sustainability Matters – benchmark tools and legal requirements, London. Morley (2005) Building for the Future: Investing for Sustainable Development in the UK Residential Property Sector, Morley Fund Management Limited, http://www.morleyfm.com/uk/morley/groups/internet/documents/salessupportmaterial/pdf_0 00503.pdf (date accessed 21/12/05) Myers, G., Reed, R.G. & Robinson, J. (2008), ‘Sustainable property – the future of the New Zealand Market’ in Pacific Rim Property Research Journal, vol.14 no. 3, pp.298-321. Pett, J., Guertler, P., Hugh, M., Kaplan, Z., and Smith, W. (2004) Asset Value Implications of Low Energy Offices: Phase 2 Report, Association for the Conservation of Energy, London. Pivo, G. and McNamara, P. (2005) Responsible Property Investing, International Real Estate Review 8, Issue 1, pp128-143. Reed R & Wilkinson S. J. (2006), “Melbourne’s 2020 Vision: Towards Carbon Neutral Office Space in the CBD” in Proceedings of Enviro 06 Conference, Melbourne, 10-12/05/06. Reed, R.G. and Wilkinson, S.J. (2008), How green can you go? Increasing the value of your home through sustainability, John Wiley and Sons, Brisbane. RICS (2005) Green Value, RICS, London.
RICS (2007) A Green Profession?: RICS Members and the Sustainability Agenda, RICS, London (available at: http://www.rics.org/AboutRICS/RICSworldwide/RICSEurope/Property%20professionals%E 2%80%99%20contribution%20to%20the%20sustainability%20agenda.html). Sayce, S., Ellison, L., and Smith, J. (2004) Incorporating Sustainability in Commercial Property Appraisal: Evidence from the UK, Paper at European Real Estate Society Conference, 2-5 June, Milan. Strong, W. A. and Hemphill, L. (2006) Sustainable Development Policy Directory. Sustainable Buildings Task Group (2004), Department for Business Innovation and Skills, www.berr.gov.uk (date accessed 01/04/09). Sustainable Construction Taskforce (2001), Reputation, Risk and Reward: the Business Case for Sustainability in the UK Property Sector, DTI, London. Therivel, R. (2004), Sustainable Urban Environment-Metrics, Models and Toolkits-Analysis of Sustainability/social tools, Levett-Therivel, Oxford. UNEP (2007) Sustainable Building and Construction Initiative (available at www.enep.fr ). Upstream (2003), Sustainability and the Built Environment: An Agenda for Action, RICS Foundation, London. Wilkinson, S.J, Reed, R.G and Cadman, D. (2008), Property Development, Taylor and Francis, London.