58, 253–269 (2000) Copyright © 2000 by the Society of Toxicology
TOXICOLOGICAL SCIENCES
A Computationally Based Identification Algorithm for Estrogen Receptor Ligands: Part 1. Predicting hER␣ Binding Affinity S. Bradbury,* ,1 V. Kamenska,† P. Schmieder,* G. Ankley,* and O. Mekenyan† *U.S. Environmental Protection Agency, National Health and Environmental Effects Research Laboratory, Mid-Continent Ecology Division, 6201 Congdon Boulevard, Duluth, Minnesota 55804; and †Bourgas University “Prof. As. Zlatarov,” Laboratory of Mathematical Chemistry, Department of Physical Chemistry, 118010 Bourgas, Bulgaria Received April 17, 2000; accepted July 31, 2000
The common reactivity pattern (COREPA) approach is a 3-dimensional, quantitative structure activity relationship (3-D QSAR) technique that permits identification and quantification of specific global and local stereoelectronic characteristics associated with a chemical’s biological activity. It goes beyond conventional 3-D QSAR approaches by incorporating dynamic chemical conformational flexibility in ligand-receptor interactions. The approach provides flexibility in screening chemical data sets in that it helps establish criteria for identifying false positives and false negatives, and is not dependent upon a predetermined and specified toxicophore or an alignment of conformers to a lead compound. The algorithm was recently used to screen chemical data sets for rat androgen receptor binding affinity. To further explore the potential application of the algorithm in establishing reactivity patterns for human estrogen receptor ␣ (hER␣) binding affinity, the stereoelectronic requirements associated with the binding affinity of 45 steroidal and nonsteroidal ligands to the receptor were defined. Reactivity patterns for relative hER␣ binding affinity (RBA; 17-estradiol ⴝ 100%) were established based on global nucleophilicity, interatomic distances between electronegative heteroatoms, and electron donor capability of heteroatoms. These reactivity patterns were used to establish descriptor profiles for identifying and ranking compounds with RBA of > 150%, 100 – 10%, 10 –1%, and 1– 0.1%. Increasing specificity of reactivity patterns was detected for ligand data sets with RBAs above 10%. Using the results of this analysis, an exploratory expert system was developed for use in ranking relative ER binding affinity potential for large chemical data sets. Key Words: structure activity relationships; expert systems; human estrogen relative binding affinity; estrogen receptor ligands.
Recent reports that a wide variety of natural and synthetic compounds are capable of acting as hormonal agonists and antagonists serve as timely examples of the need to advance mechanistically based prioritization schemes to support human health and ecological risk assessments (Ankley et al., 1997; This paper has been reviewed according to EPA guidelines. Mention of modeling or modeling approaches does not indicate endorsement by the EPA. 1 To whom correspondence should be addressed. Fax: (218) 529-5015. E-mail:
[email protected]. 253
Kavlock et al., 1996). Structure activity relationships (SARs) can serve as screening tools to help prioritize untested compounds for more intensive and costly empirical evaluations based on in vitro or in vivo bioassays (Ankley et al., 1997; Bradbury et al., 1998). In response to this need, a wide variety of SARs have been developed to predict hormone receptor binding affinity (see Bradbury et al., 1998, and references cited therein), as a critical initial endpoint in problem formulation and hazard identification stages of ecological and human health risk assessments, respectively. However, developing SARs suitable for screening large data sets of diverse chemical structures for toxicological activity in a mechanistically sound manner is challenging. Models capable of identifying relevant molecular characteristics that result in similar biological activity require a clear definition of the toxicological endpoint(s) of concern as a basis for defining mechanistically sound assumptions regarding the xenobiotic interaction(s) in question (Bradbury, 1994; Bradbury et al., 1998). Typical approaches to quantifying 3-D similarity in the context of ligand-receptor interactions encompass pharmacophore (or toxicophore) search methods and receptor site mapping. However, selecting appropriate molecular conformations and obtaining structural alignments can be quite challenging with these methods. The use of the lowest-energy conformers to assess similarity in pharmacophore search and receptormapping algorithms is common, but inappropriate, because in complex systems such as biological tissues and fluids, chemicals are likely to exist in a variety of conformational states. In fact, the lowest-energy gas-phase conformations might be the least likely to interact with macromolecules (Eliel, 1993), and solvation and binding interactions could more than compensate for energy differences among the conformers of a chemical (Bradbury et al., 1996, 1998; Mekenyan et al., 1994a, 1996a,b; Wiese and Brooks, 1994). In terms of appropriate chemical alignment, most modeling algorithms explore hundreds of alignments to reach an optimum outcome which, if not carefully evaluated in the context of a presumed mechanism of interaction with the receptor, may be susceptible to violation of the criteria of Topliss and Edwards (1979) for causality in SAR
254
BRADBURY ET AL.
models. Alignment errors also can lead to models that are incorrect or are poorly predictive. To address these issues, we recently described a technique to generalize the use of multiple conformers in an active analogue approach (Mekenyan et al., 1997, 1999). The common reactivity pattern (COREPA) approach circumvents the problems of conformer alignment and selection, and initial assumptions concerning specific atoms/fragments in a pharmacophore are not obligatory. In this respect, the method implicitly defines the common reactivity pattern across global and local reactivity descriptor(s) potentially associated with the specific biological endpoint under study. As described by Mekenyan et al. (1997, 1999), the 3 principal steps of the algorithm are: (1) definition of a training set of chemicals; (2) evaluation of stereoelectronic descriptors hypothesized to be associated with compounds exerting similar biological activity; and (3) recognition of the common reactivity pattern for those compounds. In the most recent version of the technique (COREPA-C), the common reactivity patterns are described in terms of probabilistic functions (Mekenyan et al., 1999; Schmieder et al., 2000). This feature improves the means of quantifying chemical similarity and expressing prediction uncertainties based on relative differences in the measured biological activity, in this case relative binding affinity. To initially develop the COREPA algorithms, stereoelectronic requirements associated with the binding of 28 steroidal and nonsteroidal ligands to the androgen receptor (AR) were defined (Mekenyan et al., 1997, 1999). In the present study, the COREPA algorithm was further evaluated by assessing stereoelectronic requirements for the binding of 45 diverse structures to the human estrogen receptor ␣ (hER␣). Specifically, the algorithm was employed to establish reactivity patterns for ligand subsets derived from a training set of chemicals with relative binding affinities (RBAs) of ⬎150%, 100 –10%, 10 – 1%, and 1– 0.1%. Based on the results of this analysis, an exploratory expert system was developed for use in assigning potential hER␣ RBA to chemicals for ranking and prioritizing large chemical data sets for subsequent testing.
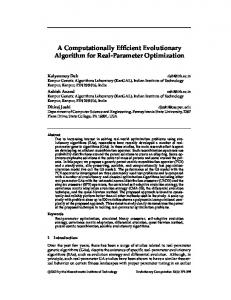
MATERIALS AND METHODS ER ligands and binding affinity. The ER ligands examined in this study consist of 26 steroids and 19 nonsteroids (Fig. 1). The RBAs of the ligands were reported by Kuiper et al. (1997) and Bolger et al. (1998) based on a competitive binding assay using hER␣ protein. The RBA is calculated as the ratio of the concentrations of 17-estradiol (E 2) and competitor required to reduce the specific binding of radiolabeled E 2 (Kuiper et al., 1997) or a fluorescent nonsteroidal estrogen (Bolger et al., 1998) by 50% (i.e., ratio of IC 50 values; Table 1). The data set of Kuiper et al. (1997) consists of 37 chemicals, whereas that of Bolger et al. (1998) is for 15 chemicals. Seven compounds were common to both studies. For these compounds, the RBA values listed in Table 1 were obtained by averaging values from both sources. In the case of estrone, the reported RBA values from the 2 studies differed by more than an order of magnitude, which, as noted below, affected the definitions of training sets.
Consequently, this compound was included in the data set twice, as compounds 8 and 21. ER ligand conformations. Conformer generation was based on a combinatorial procedure that initiates from molecular topology and generates all conformers consistent with steric constraints and expert rules (Ivanov et al., 1994). In generating conformers, the torsion resolution around “saturated” (sp 3-sp 3) bonds was 120°, using an initial torsion angle of 60° with respect to the plane of the preceding 3 atoms (Bradbury et al., 1996; Mekenyan et al., 1997, 1999). Distance between nonbonded atoms was set at 1.5 Å, while a range of 1.2 to 1.8 Å was imposed for ring closure. Due to the rigidity of the natural steroids and their derivatives, less restrictive geometric constraints for ring closures (1.0 –2.5 Å) were imposed to generate a sufficiently large number of conformations with the same stereospecificity as the natural enantiomers (i.e., B/C trans and C/D trans ring fusion). Combinatorial problems were encountered for chemicals 4, 7, 10, 12, 13, 36, and 43, due to the high degree of flexibility in their acyclic fragments. The number of conformers initially generated for those chemicals was reduced by not permitting rotation around the 2 most peripheral C–C bonds. Up to 500 of the sterically most distinct points from the conformational space for each chemical were selected. Geometric dissimilarity was assessed, based on Euclidean distances between the sums of interatomic distances for the conformers. Each of the generated conformations was submitted to a strain minimization technique (pseudo-molecular mechanics, PMM) based on a simple energy-like function, where only the electrostatic terms are omitted (Ivanov et al., 1994). Subsequently, conformational degeneracy, due to molecular symmetry and geometry convergence was detected within a 30° range of torsion angle differences. Next, geometry optimization was achieved by employing MOPAC 93 (Stewart, 1990, 1993), using the AM1 Hamiltonian with the key words “PRECISE” and “NOMM”. As a result of the optimizations, some of the conformations quenched into the same energy minima, further reducing the number of conformers. Finally, conformers were screened to eliminate those whose ⌬H f° was ⱖ 20 kcal/mol more than the conformer with the absolute energy minimum. This 20 kcal/mol threshold was based on experimental evidence that the free energy of binding for steroid hormones is in the range of –10 to –20 kcal/mol (Anstead et al., 1989, 1997; Wiese and Brooks, 1994), which can provide the necessary energy to elevate conformers from the low(est) energy state during binding. As reported previously, conformers selected within this range of ⌬⌬H f° are energetically reasonable from a thermodynamic and kinetic perspective (Bradbury et al., 1998; Ivanov et al., 1998; Mekenyan et al., 1997, 1999). For a given compound, conformers within the specified 20 kcal/mol range of ⌬⌬H f° often exhibited significant variation in potentially relevant electronic descriptors (Table 1). For example, conformers of -zearalanol (chemical 13) had a range 0.449 eV for the energy of lowest unoccupied molecular orbital (E LUMO), 0.189eV for energy of highest occupied molecular orbital (E HOMO), 0.425 eV for E HOMO-LUMO, and 3.89 D for dipole moment (). Similar variations were observed for other nonsteroidal compounds. Descriptor ranges for the steroids, while smaller, are also noteworthy. For example, conformers of moxestrol (compound 11) had a range of 0.460 eV for E LUMO, 0.470 eV for E HOMO, 0.648 eV for E HOMO-LUMO, and 0.92 D for . The observation that relatively small energy differences between conformers can result in significant variations in electronic structure highlights the necessity of including all energetically reasonable conformers when defining common reactivity patterns. To aid in interpretation of conformational flexibility for this data set, Table 1 provides the range of root mean square (RMS) differences between atoms of the conformers for each compound, based on comparisons of each conformer with the lowest-energy structure. Consistent with their greater rigidity, smaller RMS ranges were associated with steroid derivatives than with the nonsteroids. For example, RMS ranges of 2.423 to 8.641, 0.152 to 0.564, and 0.318 to 0.577 were derived for hexestrol (1), estrone (8), and estriol (14), respectively. Molecular descriptors. The global and local electronic descriptor pool used in this study was restricted to those hypothesized to be associated with ER binding affinity, based on previous studies with a variety of model receptors
PREDICTING hER␣ BINDING AFFINITY
FIG. 1.
255
Chemical names, structures, and hER␣ relative binding affinities (RBA; %) for compounds used to establish training and validation sets.
(e.g., Bradbury et al., 1996; Mekenyan et al., 1997, 1999; VanderKuur et al., 1993; Waller et al., 1995, 1996a,b; Wiese and Brooks, 1994; Wurtz et al., 1996). Stereoelectronic descriptors were calculated with MOPAC 93, augmented by a computing module that provides additional reactivity descriptors (Mekenyan et al., 1994b), using the AM1 all-valence electron, semi-empirical Hamiltonian. Electronegativity, dipole moment, energy of frontier orbitals, and the electronic gap were used as global electronic descriptors; whereas atomic charges, donor and acceptor superdelocalizability indices, and atomic selfpolarizabilities were calculated as local electronic indices. In the present study, atomic reactivity indices were not restricted to specific rings in steroidal or nonsteroidal derivatives when searching common patterns based upon local descriptor distributions. Conformer structures were also assessed based on steric descriptors, including the sum of geometric distances (Mekenyan et al., 1986), the greatest interatomic distance, steric distance between atoms, and planarity (the normalized sum of torsion angles in a molecule; Mekenyan et al., 1996b). These descriptors were selected because hydrophobicity, steric bulk, and size constraints also have been reported as important in predicting and interpreting ligand binding for nuclear receptors (e.g., Bradbury et al., 1998; Goldstein et
al., 1993; Lewis et al., 1995; Waller et al., 1995, 1996a; Wurtz et al., 1996). Finally, volume polarizability, defined as a sum of atomic self-polarizabilities, and thus, the averaged ability of a compound to change electron density at its atoms during chemical interactions (Lewis, 1989; Schu¨u¨rman, 1990), was also employed. The use of volume polarizability was based on previous observations suggesting that more polarizable conformers generally had greater ER binding affinities (Bradbury et al., 1996). The COREPA-C method. A brief summary of the COREPA method is provided below. The conceptual basis and detailed mathematical formulations, algorithm, and illustrations of the method are reported elsewhere (Mekenyan et al., 1997, 1999; Schmieder et al., 2000). To employ the COREPA method, an exhaustive conformer generation routine (described previously) is used to establish conformers of each chemical within a certain energy range of the lowest energy structure. In the present study, it was assumed that conformers of each chemical could be considered as a statistical ensemble, based on the Boltzman’s statistics. As described previously, the electronic and steric attributes of the conformers then are assessed using a predetermined set of global and local molecular descriptors. All
256
BRADBURY ET AL.
TABLE 1 Estrogen Receptor Ligands, Observed Relative Binding Affinities (RBA) for hER␣, Number of Conformers Generated (N), and Ranges for Some Significant Stereoelectronic Descriptors (see Appendix) No.
Ligand
1 2 3 4 5 6 7 8 9 10 11 12 13 14 15 16 17 18 19 20 21 22 23 24 25 26 27 28 29 30 31 32 33 34 35 36 37 38 39 40 41 42 43 44 45 46
Hexestrol Diethylstilbestrol Dienestrol 4–OH–Tamoxifen E2 Coumestrol ICI–164,384 Estrone 17␣–Estradiol Nafoxidine Moxestrol Clomifene –Zearalanol Estriol 4–OH–Estradiol 2–OH– Estradiol 5–Androstenediol Tamoxifen Genistein 3–Androstanediol Estrone HPTE Estrone–3–sulfate Norethynodrel 4–Androstenediol o,p⬘–DDT 4–Nonylphenol 4–t–Octylphenol Kepone Norethindrone 3␣–Androstanediol p,p⬘–DDT Bisphenol A Dehydroepiandrosterone 5␣–Dihydrotestosterone BBP Methoxychlor 4–Androstenedione 5–Androstanedione Testosterone 5␣–Androstanedione 19–Nortestosterone Dieldrin –Sitosterol Corticosterone Progesterone
RBA (%)
Ref.
N
E HOMO (eV)
E LUMO (eV)
E GAP (eV)
(D)
⌬⌬HE °f (kcal/mol)
RMS
302 294 223 178 100 94 85 60 58 44 43 25 16 14 13 7 6 5.1 5 3 2.1 1.7 1 0.7 0.5 0.4 0.3 0.2 0.2 0.07 0.07 0.06 0.045 0.04 0.03 0.015 0.012 0.01 0.01 0.01 0.01 0.01 0.003 0.001 0.001 0.001
K A K K K K K K* K K K K K K K K K A K K B* B K K K B B B B K K B A K A B A K K K K K B K K K
6 21 5 64 4 11 102 4 3 27 5 74 49 3 3 3 4 149 8 3 4 2 22 8 3 14 196 3 1 4 3 5 2 3 5 64 20 3 9 6 3 5 2 25 18 22
–8.8437 to –8.8093 –8.8624 to –8.6576 –8.5153 to –8.4897 –8.8412 to –8.4253 –8.8578 to –8.8205 –9.2505 to –9.1203 –8.8722 to –8.7077 –8.9227 to –8.8932 –8.8686 to –8.8392 –8.3715 to –8.0751 –9.1350 to –8.6652 –9.0695 to –8.5537 –9.4623 to –9.2738 –8.9236 to –8.8598 –8.7643 to –8.7578 –8.6400 to –8.6187 –9.3863 to –9.2248 –9.1227 to –8.4268 –9.0673 to –8.9987 –10.3538 to –10.3427 –8.9227 to –8.8932 –9.1103 to –9.1082 –9.4472 to –9.2501 –9.3442 to –9.2786 –9.5801 to –9.4047 –9.6365 to –9.4485 –8.9090 to –8.8433 –8.8563 to –8.8436 –10.9158 –10.0310 to –9.9034 –10.3513 to –10.3410 –9.6414 to –9.5429 –8.8280 to –8.8277 –9.5002 to –9.2931 –10.2655 to –10.2510 –9.7360 to –9.2760 –9.0840 to –8.9372 –10.1009 to –10.0417 –10.1810 to –10.0949 –10.0267 to –9.9249 –10.1720 to –10.1677 –10.0353 to –9.9107 –9.6308 to –9.6305 –9.3560 to –9.2532 –10.1670 to –9.9727 –10.0473 to –9.9135
0.3590 to 0.4287 0.1396 to 0.3232 0.1223 to 0.1396 –0.1057 to 0.2634 0.3658 to 0.3841 –0.3162 to –0.2201 0.3273 to 0.4869 0.3032 to 0.3271 0.3576 to 0.3752 –0.4468 to –0.0239 0.2926 to 0.7526 –0.3317 to –0.0726 –0.4605 to –0.0112 0.3050 to 0.3657 0.2665 to 0.2809 0.3085 to 0.3239 1.1200 to 1.2422 –0.1369 to 0.3952 –0.4102 to –0.3829 3.0560 to 3.0658 0.3032 to 0.3271 –0.2878 to –0.2786 –0.9899 to –0.8709 0.7497 to 0.7763 1.1006 to 1.1157 –0.4841 to –0.4045 0.4262 to 0.4613 0.4595 to 0.4741 –0.6736 –0.0506 to 0.0036 3.0608 to 3.0800 –0.5314 to –0.4893 0.4235 to 0.4262 0.9397 to 1.0095 0.9054 to 0.9191 –0.8517 to –0.6068 –0.2849 to –0.2156 –0.0917 to –0.0614 0.8633 to 0.8873 –0.0423 to 0.0468 0.8631 to 0.8754 –0.0466 to 0.0380 –0.3160 to –0.3156 1.1276 to 1.2315 –0.1727 to 0.0264 –0.0822 to 0.0527
9.1779 to 9.2673 8.7972 to 9.1856 8.6211 to 8.6522 8.3762 to 8.9907 9.1927 to 9.2419 8.8611 to 8.9900 9.1912 to 9.2364 9.1964 to 9.2434 9.1967 to 9.2438 7.7615 to 8.2998 9.1244 to 9.7722 8.3257 to 8.9785 8.8738 to 9.2990 9.1975 to 9.2442 9.0308 to 9.0400 8.9272 to 8.9639 10.4670 to 10.5062 8.3564 to 9.3397 8.5885 to 8.6823 13.3995 to 13.4174 9.1964 to 9.2434 8.8226 to 8.8296 8.3480 to 8.5541 10.0469 to 10.1125 10.5102 to 10.6807 8.9743 to 9.1926 9.3017 to 9.3425 9.3158 to 9.3177 10.2423 9.9070 to 10.0032 13.4018 to 13.4313 9.0536 to 9.1237 9.2515 to 9.2539 10.3027 to 10.4400 11.1584 to 11.1821 8.5428 to 9.0296 8.7143 to 8.8202 9.9803 to 10.0103 10.9608 to 11.0616 9.9337 to 10.0735 11.0351 to 11.0450 9.9112 to 10.0240 9.3145 to 9.3152 10.4731 to 10.5097 9.9749 to 10.0668 9.9315 to 10.0877
0.0745 to 2.2581 0.3224 to 2.2524 1.3996 to 2.3618 0.5881 to 3.5145 0.4245 to 1.4682 2.3950 to 2.9649 2.8307 to 3.9659 1.6185 to 1.6617 0.4257 to 0.7296 1.0278 to 3.6806 1.5500 to 2.4746 1.0463 to 2.8148 0.8722 to 4.7633 1.3697 to 2.0776 1.2013 to 1.5457 0.8646 to 1.0037 0.3037 to 1.5500 0.9061 to 2.6028 1.6339 to 3.7822 1.1000 to 1.7852 1.6185 to 1.6617 2.2772 to 2.4602 0.6285 to 3.8948 2.1164 to 2.8173 0.3828 to 0.4736 1.8880 to 2.8927 1.2421 to 1.4087 1.3207 to 1.3853 1.0214 3.3012 to 3.7926 1.2052 to 1.9015 0.9793 to 1.1487 1.7223 to 1.7509 1.2516 to 2.5177 2.0342 to 2.6688 1.4469 to 6.5925 0.9810 to 4.1578 2.5531 to 3.5163 1.3669 to 4.5516 2.6602 to 4.0441 2.0771 to 2.8417 3.0115 to 3.6615 1.6775 to 1.6800 1.3765 to 1.9632 0.7706 to 5.1227 1.8217 to 5.2240
–70.5100 to –60.7920 –47.5190 to –45.0619 –20.5471 to –20.4045 3.8088 to 8.5407 –107.6159 to –96.8975 –129.2098 to –110.0525 –217.1750 to –202.5838 –87.0704 to –77.0100 –107.8579 to –97.6046 6.7683 to 19.9743 67.5834 to 83.6861 43.8285 to 48.4708 –247.8439 to –235.4246 –152.4492 to –141.5218 –150.9908 to –140.3515 –151.5650 to –140.9350 –136.9920 to –132.5624 48.6071 to 56.0690 –148.1643 to –146.9973 –163.9969 to –151.6313 –87.0704 to –77.0100 –56.7081 to –56.7009 –207.2948 to –204.0818 –54.1622 to –42.7666 –135.5870 to –130.8778 21.0963 to 32.7428 –83.0323 to –78.3822 –54.1565 to –53.4612 18.3543 –52.0198 to –43.5817 –163.5126 to –153.1779 18.8319 to 20.4237 –48.3145 to –48.2939 –116.4078 to –111.9875 –143.5292 to –134.0742 –127.9410 to –117.1117 –43.4469 to –39.5937 –97.2669 to –93.9401 –121.9455 to –114.8201 –115.2860 to –104.9688 –122.8986 to –113.9359 –118.9736 to –110.5364 224.2979 to 224.5710 –141.9888 to –128.8104 –193.4743 to –175.3467 –105.6481 to –88.6579
2.4234 to 8.6410 0.4577 to 7.9498 2.7467 to 6.6118 1.0723 to 7.5811 0.3343 to 0.8533 0.0667 to 5.3936 1.3514 to 20.9967 0.1520 to 0.5643 0.2646 to 0.5818 1.0717 to 8.1075 0.5914 to 1.6961 0.7899 to 7.4314 1.1712 to 4.5059 0.3175 to 0.5773 0.2064 to 0.4481 0.2805 to 0.5710 0.3646 to 0.5040 0.9294 to 14.9980 1.3756 to 7.0188 0.3975 to 0.6857 0.1520 to 0.5643 3.0428 to 3.0428 0.1223 to 1.1860 0.1350 to 0.7622 0.4571 to 0.5244 1.9169 to 7.3511 0.8358 to 11.7658 3.3483 to 7.3376 0.0000 to 0.0000 0.3341 to 0.8900 0.4067 to 0.7326 1.3120 to 6.7854 3.9247 to 3.9247 0.3429 to 0.5017 0.2358 to 0.4780 2.0314 to 9.7750 2.2637 to 6.1257 0.3922 to 0.5518 0.1622 to 2.0415 0.4094 to 1.6236 0.2282 to 0.4743 0.2366 to 0.7519 6.6002 to 6.6002 0.4640 to 9.5201 0.3557 to 1.4333 0.3760 to 1.9107
Note. K ⫽ Kuiper et al. (1997); B ⫽ Bolger et al. (1998); A ⫽ data from both sources are averaged. *Chemical in more than one RBA range.
conformers of a given chemical are plotted across a molecular descriptor axis, thus forming a discrete distribution for the chemical relative to the selected descriptor. For the global molecular descriptors, each conformer is represented by single point value, whereas for atomic descriptors, several values for each conformer are allocated across the descriptor axis. These values are associated with various local sites (atoms) of the conformer. These descriptor point estimates are considered to be midpoints of a continuous (gamma) distribution that approximates the discrete distribution. Subsequently, a conformer distribution of a chemical is represented by a continuous function obtained by summing all gamma distributions corresponding to conformers of the specified chemical. Conformer distributions of a chemical are normalized by dividing the total distribution area by the number of conformers (i.e., normalizing the distribution area to unity for each chemical), thus providing a probabilistic characterization of the distributions. The COREPA algorithm consists of 3 steps: First, two subsets of chemicals are selected as training sets (Step 1). The first subset consists of chemicals having activity (here, in terms of RBA) above a user-defined high activity threshold (HAT). The second subset includes chemicals having activity below a predetermined non-active threshold (NAT). Next, a set of descriptors associated with the biological activity of interest are established by evaluating the degree of overlap (in %) between the distributions associated with the HAT
and NAT patterns (denoted as HAP [high activity pattern] and NAP [nonactive pattern, i.e., the reactivity pattern based on the learning set of non-active chemicals], respectively) (Step 2). The descriptors are evaluated based on the normalized sum of dynamic similarity indices, S(AP/NAP), the portion of the non-active pattern exceeded by the maximum of the active pattern (3-D similarity measure between reactivity patterns of active between each pair of molecules in the training set (Mekenyan et al., 1999). The cutoffs, i.e., the part of the non-active area in common with the active pattern maximum (Cutoff(AP/NAP)), can also be used as a measure of similarity. We assume the stereoelectronic descriptors that provide the maximal measure of similarity among chemicals in the training sets, and have least overlap between HAP and NAP (i.e., most distinct HAP and NAP), to be related to biological activity. Finally, common reactivity patterns for biologically similar molecules (e.g., chemicals within a defined range of RBA values) are obtained as products of the probabilistic distributions for specific stereoelectronic descriptors associated with chemicals in training sets of the active and non-active chemicals (Step 3). Well defined, or distinct, patterns for descriptors are observed when the conformer distributions for the chemicals from the same training set are in phase. The dissimilarity between overall patterns of active and non-active chemicals, as well as between overall patterns and chemical-specific distributions,
PREDICTING hER␣ BINDING AFFINITY can be evaluated by Euclidean distance based on the squared differences between distribution densities over the entire range of the descriptor variation. The Euclidean distance metric can also be used to compare distributions derived from different chemical training sets or for training sets derived from different weighting schemes (e.g., different ⌬⌬H f° thresholds for conformer selection). The Euclidean metric distance can be used to ascertain the extent to which an overall conformer distribution of active or non-active chemicals is influenced by a specific chemical(s). In this respect, the “stability” of a pattern can be assessed by a “leave-one-out” procedure. The metric is used to iteratively assess differences between patterns derived for n vs. n-1 chemicals in the training subsets. Variation of similarity indices, cutoffs between HAP and NAP, and descriptor ranges can also be quantified. More stable patterns are associated with smaller Euclidean distances, reduced variations in similarity indices, and equivalent smaller descriptor ranges. The common reactivity patterns are described in terms of molecular descriptor ranges around the probability maxima of the distributions. The width of these ranges depends on values of ⌫, which is related to the half-width of the gamma function, and confidence limits chosen around the probability maxima. Based on our previous study (Mekenyan et al., 1999), default ⌫ values of 0.1 to 0.125 of the variation range for global descriptors, and 0.01 or 0.05 of the variation for local indices were used. Ultimately, a common reactivity pattern is a collection of the specified ranges of each molecular descriptor determined to be associated with the biological activity of concern. In the present study, atomic sites with differing levels of generality were used in establishing reactivity patterns. Wild-card heteroatoms are denoted by R, where R stands for all (or a specified subset) of the heteroatoms in the molecules. In subsequent analyses, R was assumed to represent the following 3 groups of atoms: O; O, N; and O, N, Cl, F. Rule interpreter. To facilitate screening of large chemical data sets, common reactivity patterns were coded into a decision tree (Schmieder et al., 2000). The decision tree consists of multiple hierarchically ordered rules that capture specific stereoelectronic descriptors that comprise common reactivity patterns. Each energetically reasonable conformer of a chemical is processed through the decision tree by making use of an interpreter that is based on an extended SMILES notation that permits the use of stereoelectronic structurebased rules. Boolean logic operators are used to establish “rules” in the decision tree. In the context of this study, a rule statement results in the assignment of the likelihood of binding to the hER␣ which is the probability of having a RBA value equal to or greater than a predetermined threshold. If the value of a parameter calculated for a conformer falls in a range of the molecular descriptor defined by a confidence limit with a probability of P%, around the pattern maximum, then it is assumed that the conformer meets the specific requirement with a probability (100-P)%. If a chemical has to meet 2 successive stereoelectronic requirements to equal or exceed an activity threshold (with probabilities n A and n B, respectively), the total probability of meeting both requirements (P A and B) is obtained as a product of the probabilities of meeting the two requirements separately, i.e., P A and B ⫽ n A.n B. The total probability (P A or B) of meeting either one of the requirements, in case of “or” binary logic, is obtained as P A or B ⫽ n A ⫹ n B – n A.n B. If the value of the descriptor calculated for a conformer falls outside of at least one of the parameter ranges, then the overall probability of having an RBA above that threshold is 0. As seen, the approach offers flexibility in establishing hazard ranking protocols for unknown compounds based on choices of RBA thresholds and confidence limits around pattern maxima. It must be stressed that the probability outcomes from the decision tree should not be viewed in absolute terms. Rather, the output from the algorithm permits a relative ranking of unknown chemicals in terms of their likelihood to have an RBA above a user-defined threshold. To simplify presentation of the rule interpreter, a binary version of the decision tree was employed in the present study. In the binary version, a value of 100% is assigned to a chemical if at least one conformer falls within the range of the molecular descriptor defined by a confidence limit with a proba-
257
bility of P% around the pattern maximum. This simplified version provides a discrimination of chemicals as being active or non-active. Thus, chemicals with similar hER␣ affinity (within an RBA range) have at least one conformer that meets all the specified parameter ranges, whereas those from the other RBA ranges should have no conformers that meet all the multiparameter requirements simultaneously.
RESULTS AND DISCUSSION
COREPA Algorithm for hER␣ Ligands Step 1. Definition of the training set of chemicals. Training sets were established by selecting subsets of active and nonactive chemicals differing in their RBA by one order of magnitude. The following RBA ranges were associated with active ligands: greater than 150% (denoted as HAR1), from 100 to 10% (HAR2), from 10 to 1% (HAR3), and from 1 to 0.1% (HAR4). Two ranges were associated with non-active ligands: from 0.1 to 0.01% (NAR1) and from 0.01 to 0.00% (NAR2). Although user-defined, the ability of different RBA ranges to discriminate active and non-active chemicals can be assessed by estimating similarity between the respective reactivity patterns defined in Steps 2 and 3. Lower similarity between the patterns associated with HAP and NAP indicates a low probability of incorrectly assigning a conformer to an RBA range. Step 2. Identification of stereoelectronic descriptors associated with biologically similar compounds. As discussed previously, Step 2 of the algorithm consists of evaluating normalized pairwise similarity (S(AP/NAP)) between chemicals in the different RBA ranges across the steric and electronic indices. The calculated indices are listed in Table 2. Average similarity (S yz(x)) among the chemicals within the training sets (withingroup similarity) are also presented in Table 2. The global indices of E HOMO, E GAP, and EN showed the greatest S yz(x), but also the largest distinction (lowest similarity) between HAPs and NAPs and the HAP/NAP combinations. The similarity between HAPs and NAPs for these global indices gradually increases with an increase in the biological similarity between chemicals (i.e., smaller RBA range separation). Thus, the lowest S(AP/NAP) values were obtained between HAR1 and NAR2, with a S(HAP1/NAP2) of 0.02 and 0.1% for E HOMO and EN, respectively. Consistent with this, the greatest similarity between patterns was observed for the most biologically similar ranges: for HAP4 and NAR2, an S(HAP4/ NAP2) of 1.0 and 2.5% for E HOMO and EN were observed, respectively. Among the local electronic descriptors, charges (Q(R)) and donor-delocalizabilities (SE(R)) of heteroatoms had lowest between-group similarities for a wide range of HAR/NAR comparisons. Consistency between RBA and pattern similarities was also observed for local electronic indices. Again, the lowest between-group similarities for Q(R) and SE(R) were obtained for the training sets derived from the largest activity threshold separations (e.g., S(HAP1/NAP2) ⫽ 3.2 and 4.2%
258
BRADBURY ET AL.
TABLE 2 Averaged “Within Group” Similarity (%) between Chemicals Included within Different RBA Ranges; “Between Group” Similarity (%) between Patterns Associated with Active (HAR) and Non–Active (NAR) Chemicals Within group similarity (%)
Between group similarity (%)
Descriptors
⌫
HAR1
HAR2
HAR3
HAR4
NAR1
NAR2
HAR1/NAR2
HAR2/NAR2
HAR3/NAR2
HAR4/NAR2
E HOMO (eV) E LUMO (eV) Egap (eV) Max distance (Å) GW (Å) EN (eV) (D) Q(O) (a.u.) Q(R) (a.u.) SE(O) ((a.u.) 2/eV) SE(R) ((a.u.) 2/eV) d(O_O) (Å) d(R_R) (Å)
0.55 0.55 0.93 2.67 5517 0.37 0.88 0.05 0.05 0.05 0.05 2.21 2.47
78.2 77.6 75.8 64.0 60.5 90.4 79.0 91.2 95.4 96.5 92.5 65.1 72.8
71.1 66.4 74.8 60.3 57.4 70.3 55.6 70.0 72.0 92.0 89.3 60.6 64.6
53.9 38.6 38.6 71.1 69.7 50.9 60.0 7.5 56.1 91.6 82.4 5.2 54.8
51.9 40.7 53.1 53.9 79.6 43.1 54.2 39.6 29.3 80.5 62.6 8.6 49.1
47.1 34.5 40.8 79.0 79.7 41.9 52.7 60.3 48.7 75.4 61.7 60.2 55.3
71.0 55.8 64.9 59.7 63.8 60.5 60.0 69.5 67.2 78.4 76.1 78.1 67.5
0.015 29.6 0.71 17.1 67.4 0.1 25.5 2.8 3.2 6.3 4.2 45.2 31.8
0.001 24.8 0.32 56.8 85.9 0.03 8.9 2.1 3.1 6.5 4.6 75.7 90.5
0.06 47.3 1.3 86.2 85.1 0.6 6.2 18.9 21.7 7.4 5.6 4.7 64.3
1.0 18.3 28.4 72.7 55.1 2.5 5.0 32.3 30.5 12.8 30.4 71.8 58.0
Note. RBA ranges for HAR1, HAR2, HAR3, HAR4, NAR1, and NAR2 are ⬎ 150, 10 –100, 1–10, 0.1–1, 0.01– 0.1, and 0.001– 0.01%, respectively.
for Q(R: O, N, Cl, F, S) and SE(R: O, N, Cl, F, S), respectively). Alternatively, the largest between-group similarity was obtained for training sets with greatest biological similarity (e.g., S(HAP4/NAP2) ⫽ 30.5 and 30.4% for Q(R: O, N, Cl, F, S) and SE(R: O, N, Cl, F, S), respectively). No significant differences were found in similarity assessments based on Q(R) and SE(R) for the different types of R. Among the steric descriptors, distances between heteroatoms, d(R_R), were found to provide the lowest betweengroup similarity, which was observed for the training sets derived from the largest RBA separations (i.e., S(HAP1/ NAP1) ⫽ 20.4% (data not shown) and S(HAP1/NAP2) ⫽ 31.8%). Moreover, between-group similarity assessments were found to depend on the types of heteroatoms included in d(R_R). Thus, the highest discrimination ability between HAPs and NAPs was for R: O, N, Cl, F, S, with the lowest discrimination when R was restricted to O only. Based on these results, E HOMO was employed as the global descriptor in the COREPA analyses. In addition, the local electronic descriptors Q(R) or SE(R) where used, as well as the distances between heteroatoms, as a local steric descriptor. COREPA analysis of similarity within and between a variety of pairings of HAPs and NAPs, with respect to E HOMO, Q( R), SE(R), and d(R_R) suggested that the greatest discrimination between patterns was associated with largest RBA range separation, i.e., between HAR1 or HAR2, and NAR2 (Table 2). A leave-one-out analysis based on the above parameters also indicated that patterns derived from training sets with the highest RBA ranges (HAR1 or HAR2) were more “stable” than those obtained for the lower RBA ranges of HAR3 and HAR4. For example, with HAR1, the 10% confidence limit for d(R_R) was 11.74 to 11.91 Å (⌫ ⫽ 2.47). The mean distance range
from the leave-one-out analysis was 11.75 (11.59 –11.91) Å to 11.91 (11.81–12.10) Å. The 10% confidence limit d(R_R) with HAR4 was 10.46 to 10.72 Å, while the associated meandistance range from the leave-one-out analysis was 10.13 (2.86 –10.70) to 10.40 (3.27–10.90) Å. The stability of patterns also can be assessed in terms of Euclidean distance. The mean Euclidean-distance values for active patterns derived from leave-one-out analyses for HAR1, compared to the pattern for the intact training set, were 0.019 and 0.0027, respectively, for E HOMO (⌫ ⫽ 0.55) and d(R_R) (⌫ ⫽ 2.47). The same analysis, based on chemicals in HAR4, resulted in mean Euclidean distance values of 0.032 and 0.0074 for E HOMO and d(R_R), respectively. Thus, the COREPA analysis supports the biologically reasonable hypothesis that ligands with higher RBA values are associated with more specific receptor interactions. Consequently, these ligands are associated with more stable reactivity patterns and are more reliable in determining hER␣ ligand binding affinity for this data set. Step 3. Recognition of the common reactivity pattern based on relevant molecular descriptors. The variation of parameter ranges of the relevant molecular descriptors are given in Table 3, parts a– d, for the 4 different HARs, respectively. A collection of these ranges forms the reactivity patterns that were used to define rules in the hER␣ ligand decision tree. Patterns based on the global electronic descriptors were derived for different RBA ranges at a constant ⌫value of 1 eV or 3 eV. To increase the specificity of d(R_R)-based patterns, the latter were analyzed within smaller descriptor distances from 9 to 10 Å, 9 to 10.5 Å, 10.0 to 11.5 Å, 10.3 to 10.7 Å, or 11.5 to 13 Å. Following is a detailed discussion of the reactivity patterns associated with each molecular descriptor.
PREDICTING hER␣ BINDING AFFINITY
259
TABLE 3 The Variation of Parameter Ranges for the Relevant Molecular Descriptors with Confidence Limits (CL) around the Maximum Probability Values for (a) RBA > 150%, (b) 10 < RBA < 100%, (c) 1 < RBA < 10%, and (d) 0.1 < RBA < 1% CL (%)
E HOMO ⌫ ⫽ 1 eV
E HOMO ⌫ ⫽ 3 eV
Q(R) ⌫ ⫽ 0.05 a.u.
SE(R) ⌫ ⫽ (0.05 a.u.) 2/eV
SE(R) ⌫ ⫽ (0.01 a.u.) 2/eV
d(R_R)
d(R_R)
d(R_R)
a
10 30 50 70 90
–8.69 to –8.64 –8.75 to –8.58 –8.81 to –8.52 –8.89 to –8.44 –9.04 to –8.29
–8.72 to –8.60 –8.85 to –8.47 –8.99 to –8.37 –9.15 to –8.17 –9.54 to –8.08
–0.254 to –0.251 –0.256 to –0.248 –0.260 to –0.245 –0.264 to –0.241 –0.272 to –0.233
0.246 to 0.249 0.244 to 0.251 0.240 to 0.254 0.236 to 0.259 0.229 to 0.260
–a – – – –
11.98 to 12.01 b 11.95 to 12.04 11.91 to 12.08 11.86 to 12.13 11.77 to 12.22
– – – – –
– – – – –
b
10 30 50 70 90
–8.90 to –8.87 –8.94 to –8.83 –8.98 to –8.79 –9.03 to –8.74 –9.11 to –8.65
–8.92 to –8.83 –9.01 to –8.75 –9.11 to –8.65 –9.23 to –8.53 –9.44 to –8.32
–0.254 to –0.252 –0.256 to –0.250 –0.259 to –0.248 –0.262 to –0.245 –0.268 to –0.239
0.255 to 0.257 0.253 to 0.259 0.251 to 0.261 0.248 to 0.264 0.244 to 0.269
– – – – –
10.44 to 10.45 c 10.43 to 10.46 10.43 to 10.46 10.41 to 10.48 10.38 to 10.51
11.54 to 11.55 d 11.53 to 11.56 11.52 to 11.57 11.50 to 11.59 11.50 to 11.80
10.79 to 10.81 e 10.77 to 10.83 10.74 to 10.86 10.71 to 10.89 10.62 to 10.95
c
10 30 50 70 90
–9.04 to –8.99 –9.09 to –8.94 –9.14 to –8.88 –9.22 to –8.81 –9.35 to –8.68
–9.16 to –9.04 –9.28 to –8.92 –9.41 to –8.79 –9.59 to –8.61 –9.87 to –8.32
–0.265 to –0.261 –0.269 to –0.257 –0.273 to –0.252 –0.280 to –0.246 –0.292 to –0.233
0.254 to 0.256 0.251 to 0.258 0.249 to 0.260 0.245 to 0.264 0.240 to 0.269
– – – – –
9.64 to 9.68 f 9.60 to 9.72 9.55 to 9.77 9.49 to 9.83 9.38 to 9.93
10.08 to 10.12 g 10.02 to 10.17 9.96 to 10.23 9.87 to 10.31 9.75 to 10.44
10.88 to 10.93 h 10.83 to 10.97 10.78 to 11.02 10.71 to 11.09 10.56 to 11.28
d
10 30 50 70 90
–9.36 to –9.31 –9.41 to –9.25 –9.47 to –9.19 –9.55 to –9.11 –9.69 to –8.97
–9.45 to –9.33 –9.57 to –9.21 –9.72 to –9.07 –9.90 to –8.89 –10.21 to –8.57
–0.270 to –0.266 –0.275 to –0.262 –0.280 to –0.257 –0.287 to –0.250 –0.298 to –0.233
0.263 to 0.264 0.262 to 0.265 0.260 to 0.267 0.257 to 0.270 0.248 to 0.279
0.245 to 0.250 0.239 to 0.260 0.239 to 0.263 0.239 to 0.265 0.239 to 0.269
– – – – –
– – – – –
– – – – –
[⌫ values (Å) are specified in footnotes]
a
Estimate not performed. ⌫ ⫽ 0.5 Å, 11.5 to 13 Å. c ⌫ ⫽ 0.1 Å, 10.3 to 10.7 Å. d ⌫ ⫽ 0.1 Å, 11.5 to 13 Å. e ⌫ ⫽ 0.5 Å, 10.0 to 11.5 Å. f ⌫ ⫽ 0.5 Å, 9.0 to 10.0 Å. g ⌫ ⫽ 0.5 Å, 9.0 to 10.5 Å. h ⌫ ⫽ 0.5 Å, 10.0 to 11.5 Å. b
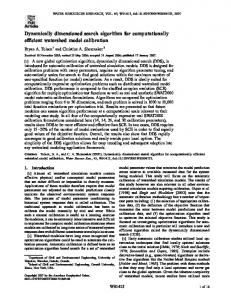
Reactivity Pattern Based on E HOMO The reactivity patterns of training sets based on HAR1, HAR2, HAR3, and HAR4 as compared with the pattern of non-active ligands (NAR2) are illustrated in Figure 2. The E HOMO ranges (in eV), obtained as a function of the confidence limit (%) around the E HOMO probability maximum (Table 3, parts a– d, Fig. 2), clearly show a shift in the E HOMO pattern toward higher global nucleophilicity with increasing RBA values. This result is consistent with the hypothesis that more active ER ligands have higher nucleophilicity (Bradbury et al., 1998; Waller et al., 1996a). The discrimination ability of E HOMO tended to decrease with decreasing separation between RBA ranges. For example, with ⌫ ⫽ 1 eV, S(AR/NAR), values of 0.41, 0.1, 1.5, and 7.9%, for HAR1/NAR2, HAR2/NAR2, HAR3/NAR2, and HAR4/ NAR2, respectively, were observed (data not shown). With ⌫ ⫽ 0.55 eV, S(AR/NAR) values of 0.015, 0.001, 0.06, and 1.0%, respectively, were noted (Table 2).
Reactivity Pattern Based on Donor Delocalizabilities and Charges The comparison between activity patterns based on donor delocalizability, SE(R: O, N, Cl, F), for different HARs and NAR2 is illustrated in Figures 3a– d, for ⌫ ⫽ 0.05 (a.u.) 2/eV (also see Table 3, parts a– c). The discrimination ability of the SE patterns decreases with a decrease in RBA values (e.g., S(HAR1/ NAR2) ⫽ 4.2%, whereas S(HAP4/NAP2) ⫽ 30.4%). An analysis of the HAPs indicate this pattern is predominantly due to R attached to a phenyl moiety. If a lower ⌫ (0.01 (a.u.) 2/eV) is employed on a restricted SE(R) range, additional probability maxima were detected (Figs. 4, Table 3d). This analysis indicates that the probabilistic distribution maximum with the lowest SE(R) value (around 0.247 (a.u.)2/eV) is associated with an electronwithdrawing R attached to aromatic fragments. The maximum with an SE(R) value of about 0.26 (a.u.)2/eV is associated with an R attached to non-aromatic rings, while the highest SE(R) maximum of about 0.30 (a.u.)2/eV (identified in the SE(R) range of 0.3
260
BRADBURY ET AL.
FIG. 2. The reactivity patterns based on E HOMO, at ⌫ ⫽ 1.0 eV, for: (a) RBA ⬎ 150%, (b) 10 ⬍ RBA ⬍ 100%, (c) 1 ⬍ RBA ⬍ 10%, and (d) 0.1 ⬍ RBA ⬍ 1%; in this and other figures the integral reactivity pattern of active ligands is gray, whereas the pattern of non-active ligands in white.
to 0.4 (a.u.) 2/eV; data not shown) is associated with halogen heteroatoms (ligands included in HAR4). The charge-based pattern (analyzed for negative charge values only) is consistent with that observed for delocalizability, as illustrated in Figure 5 and summarized in Table 3, for R ⫽ O, N, Cl, F, S, and ⌫ ⫽ 0.01 a.u. The difference between Q(R)-based HAPs and NAPs was mainly associated with electronic charges (i.e., electron donor properties) of an R attached to an aromatic fragment. The lower donor delocalizability of the electronegative sites associated with ligands in HARs (Figs. 3 and 4) is consistent with the more positive charge located at those sites. Apparently, higher binding affinity requires specific, but not extreme, ranges of charge and/or donor delocalizability. In this data set, non-active ligands have larger negative charges and donor delocalizabilities distinct from parameter ranges associated with active ligands. Reactivity Pattern Based on Interatomic Distances between Electronegative Sites The reactivity patterns of active (HAR1–HAR4) and nonactive (NAR2) ligands based on interatomic distances, d(R_R), for R ⫽ O, N, Cl, F, S (i.e., all heteroatoms) at a value of ⌫ ⫽ 0.1 Å are illustrated in Figures 6a– 6d, respectively. The maximum probability of d(R_R) for HAR1 (Fig. 6a, Table 3, part
a) occurred at 12 Å (over the distance of 11.5–13 Å). There was a 6.9% overlap between this pattern and that associated with NAR2. The activity pattern obtained for HAR2 had a maximum probability at about 10.8 Å (Fig. 6b, Table 3, part b) over the distance of 10.0 to 11.5 Å. This distance pattern had a 12.9% overlap with the pattern for NAR2. Over the same distance, from 10.0 to 11.5 Å, a multiplicity of maxima were observed for the HAR3 pattern, as well as an increase in the overlap with the non-active range (25.1%). A maximum-distance value of about 10.9 Å was observed between 10.0 and 11.5 Å (Fig. 6c, Table 3, part c), with another maximum at about 9.6 Å noted between 9.0 and 10.0 Å (Fig. 6d). However, the similarity between this active pattern and the non-active pattern reached 40.6%. Finally, the activity pattern associated with HAR4 had multiple maxima for distance ranges of 10.0 to 11.5 Å and 9.0 to 10.0 Å, (Fig. 6e and f, respectively). The intensity of those maxima were lower than those associated with HAR1–HAR3. In summary, maximum probability values were shifted to lower distances with decreasing RBA values. Thus, the largest maximum probability distance of 12 Å was associated with HAR1, whereas for HAR3 and HAR4, the maximum distances ranged from 9 to 10 Å. The donor delocalizability, charge, and distance-based patterns are consistent with previous studies (e.g., Anstead et al.,
PREDICTING hER␣ BINDING AFFINITY
261
FIG. 3. The reactivity patterns based on SE(R: O, N, Cl, F, S), at ⌫ ⫽ 0.05 (a.u.) 2/eV, for: (a) RBA ⬎ 150%, (b) 10 ⬍ RBA ⬍ 100%, (c) 1 ⬍ RBA ⬍ 10%, and (d) 0.1 ⬍ RBA ⬍ 1%.
1997; Wurtz et al., 1996). These studies reported that ER ligands should possess 2 electronegative sites, capable of forming donor and acceptor H-bonds in the ER ligand-binding domain, and of being separated by about 10.9 Å. As summarized above, 10.9 Å coincides with the distance ranges reported in the present work for ligands with RBA ranges of 1 to 10% (HAR3) and 10 to 100% (HAR2). Derivation of hER␣ Ligand Reactivity Patterns Mekenyan et al. (1999) reported previously that distributions based on larger ⌫ values, or larger confidence limits, will lead to wider ranges in E HOMO, d(R_R) and Q(O) (or SE(R)) maximum probability values. In general, larger descriptor ranges are associated with a greater likelihood that ligands will be incorrectly identified as having an RBA value within the specified HAR (i.e., an increasing rate of false positive identifications). Conversely, smaller descriptor ranges increase the rate of false negative identifications. It is important to note that due to the probabilistic nature of the algorithm, it is possible that the choice of an active pattern based on a small ⌫ or confidence limit can lead to incorrect classifications of conformers from an active ligand. For example, when using an E HOMO profile derived for the most potent hER␣ ligands in this
data set (HAR1) in a single descriptor screen of – 8.72 to – 8.60 eV (⌫ ⫽ 3.0 eV; 10% confidence limit; see Table 3a), all of the conformers of ligands 1 and 3 were incorrectly identified as having an RBA ⬍ 100%. Consequently, larger confidence limits were required to establish patterns that would include conformers for all of the ligands included in HAR1. Thus, if the 50% confidence limit of – 8.99 to – 8.37 eV (at ⌫ ⫽ 3.0 eV) is used, all conformers of the 4 ligands in HAR1 were screened correctly, except for one conformer of ligand 3. The similarity between a ligand distribution for all conformers of one chemical and the E HOMO reactivity pattern for all chemicals in HAR1 (S(k/AP) ranged from 70.2% for ligand 1 to 76.2% for ligand 4. This single descriptor screen, however, does lead to false positive classifications (i.e., prediction of RBA ⬎ 150%) for less active chemicals: HAR 2 ligands 5, 7–12, 14, and 15; HAR 3 ligands 16, 18, and 21; HAR 4 ligands 27 and 28; and NAR1 ligands 33 and 37, respectively. For these compounds, the similarity in ligand distributions for E HOMO with the corresponding activity pattern ranged from 69.1% for ligand 11 to 78.8% for ligand 12. Similarly, if a d(R_R) range of 11.98 to 12.01 Å (⌫ ⫽ 0.5 Å; 10% CL; see Table 3, part a) derived for HAR1 is used as a single descriptor screen, all of the conformers of ligands 1–3
262
BRADBURY ET AL.
FIG. 4. The reactivity patterns based on SE(R: O, N,Cl, F, S), at ⌫ ⫽ 0.01 (a.u.) 2/eV, derived within the range of 0.2 to 0.3 (a.u.) 2/eV, for: (a) RBA ⬎ 150%, (b) 10 ⬍ RBA ⬍ 100%, (c) 1 ⬍ RBA ⬍ 10%, and (d) 0.1 ⬍ RBA ⬍ 1%.
were incorrectly identified as having an RBA ⬍ 100%. However, after using the 90% confidence limit of 11.77 to 12.22 Å (at ⌫ ⫽ 0.5 Å), conformers of chemicals 1– 4 were correctly identified. The similarity between ligand distributions and this reactivity pattern ranged from 47.1% for ligand 4 to 68.0% for ligand 1. The larger descriptor screen, however, resulted in false positive classifications of ligands 7, 10, 19, 23, 45, and 46, respectively. The similarity between individual ligand distributions and the d(R_R)-based activity pattern ranged from 41.5% for ligand 10 to 67.0% for ligand 19. The selection of specific ⌫ and/or confidence limit values for deriving HAR1 screening rules was based on a strategy to first minimize the probability of false negative identifications, while secondarily minimizing the number of false positive identifications. Ultimately, a 3-descriptor screen based on E HOMO, d(R_R) and Q(R) (or SE(R)) was used to minimize the rate of false negative identifications, while maintaining a low rate of false positive identifications. For a ligand to be classified as active within a specified RBA range, at least one conformer was required to fall within all 3 of the descriptor ranges. For HAR1, a screening pattern with E HOMO of a – 8.99 to – 8.37 eV(⌫ ⫽ 3.0 eV; 50% confidence limit, Table 3, part a) combined with the least conservative d(R_R) range of 11.77 to 12.22 Å (confidence limit ⫽ 90%) and a Q(R) range of – 0.272 to – 0.233 a.u. (⌫ ⫽ 0.05 a.u; 90% confidence limit, Table 3, part a), imposed on both electronegative sites forming the
d(R_R), correctly discriminated chemicals 1– 4 from chemicals 5– 46. The above classification of an “unknown” ligand was based on whether or not one or more conformers for the compound fell within any of the E HOMO, d(R_R), and Q(R) activity patterns. Alternatively, values of Euclidean distance or S(k/AP) for comparisons of distributions of unknown compounds to an HAR could be used to screen ligands. For the E HOMO-based pattern, Euclidean distance and S(k/AP) values for ligands included in HAR1 varied from 0.18 to 0.21 and from 72.5 to 77.2%, respectively. For d(R_R), Euclidean distance and S(k/ AP) values varied from 0.58 to 0.91 and 47.1 to 68.0%, respectively, whereas for Q(R), the Euclidean distance and S(k/AP) values ranged from 3.04 to 3.56 and from 45.9 to 54.2%. Based on S(k/AP), thresholds of 72.5%, 47.1%, and 45.9% for E HOMO, d(R_R), and Q(R), respectively, could be used in a 3-parameter screen. Employing this as a screen, chemicals 5– 46 were also correctly classified as having RBA values ⬍ 150%. Using Euclidean distance or S(k/AP) to assess unknown ligands facilitates a more quantifiable approach for determining similarity in reactivity patterns. The use of these similarity metrics also permits the sensitivity of different thresholds to be readily evaluated in terms of potential rates of false negative and positive classifications of unknown ligands. A 3-descriptor screen also was developed for HAR2 based on E HOMO, d(R_R), and Q(R). An E HOMO pattern of –9.44 to
PREDICTING hER␣ BINDING AFFINITY
263
FIG. 5. The reactivity patterns based on Q(R: O, N, Cl, F, S), at ⌫ ⫽ 0.05 a.u., for: (a) RBA ⬎ 150%, (b) 10 ⬍ RBA ⬍ 100%, (c) 1 ⬍ RBA ⬍ 10%, and (d) 0.1 ⬍ RBA ⬍ 1%.
– 8.32 eV (⌫ ⫽ 3.0 eV; 90% confidence limit, Table 3, part b) combined with d(R_R) ranges of 10.62 to 10.95 Å (⌫ ⫽ 0.5 Å, confidence limit ⫽ 90%), and the requirement that at least one of these heteroatoms meets the least conservative Q(R) screen of – 0.273 to – 0.236 a.u. (⌫ ⫽ 0.05 a.u; 95% confidence limit [not shown]), successfully discriminated nine out of 11 ligands from the training set (chemicals 5–15) as having RBA values between 10 and 100%. The threshold values for Euclidean distance and S(k/AP) associated with E HOMO, d(R_R), and Q(R) reactivity patterns in the HAR2, were: 0.34 and 58.0%, 1.51 and 22.7%, and 5.56 and 18.4%, respectively. The conformers of chemical 10 (nafoxidine) had higher E HOMO values (from – 8.37 eV to – 8.08 eV), whereas conformers of chemical 9 (17␣-estradiol) had d(R_R) distances shorter than 10.62 Å (the lower boundary of the least restrictive distance screen in the range of 10 –11.5 Å). If the distance screens of 10.38 to 10.51 Å or 11.50 to 11.80 Å, obtained with a more precise continuous approximation (⌫ ⫽ 0.1 Å, 90% CL) using windows of 10.3 to 10.7 Å and 11.5 and 13 Å, respectively, were additionally included in the reactivity pattern, then 17␣-estradiol (9) was correctly identified as having an RBA between 10 and 100%. Conformers of ligands 1– 4 were not identified by this HAR2 reactivity pattern. For ligands in the lower activity ranges, the HAR reactivity pattern (even after inclusion of additional dis-
tance screens) identified 16 (2-hydroxy-estradiol), which lies on the boundary between training sets HAR2 and HAR3 (RBA ⫽ 7%) and 21 (estrone), which was also included in HAR2 as chemical 8, due to the discrepancy in reported RBA values. No ligands with RBA ⬍ 1% were identified as having an RBA value between 10 and 100%. The COREPA associated with HAR3 was based on a E HOMO range of –9.87 to – 8.32 eV (⌫ ⫽ 3.0 eV; 90% confidence limit, Table 3, part c), combined with distance screens of 9.38 to 9.93 Å or 10.56 to 11.28 Å, observed within windows of 9.0 to 10.0 Å and 10.0 to 11.5 Å, respectively (Table 3, part c, for confidence limit ⫽ 90%). The E HOMO and d(R_R) screens were combined with a SE(R) pattern of 0.237 to 0.273 (a.u.) 2/eV (95% confidence limit, data not shown), imposed on at least one of the electronegative sites. This reactivity pattern correctly identified 5 out of 7 chemicals from the training set. It should be noted that a d(R_R) of 9.75 to 10.44 Å in the range of 9.5 to 10.5 Å could also be included in one of the other distance ranges to attain 5 out of 7 correct predictions. Chemical 18 (tamoxifen) was not identified as active in this RBA range because d(R_R) for the 2 electronegative sites was not larger than 5 Å, while chemical 20 (3-androstanediol) had an extremely low global electron donor ability with a E HOMO range of –10.35 to –10.34 eV. The HAR3 pattern also identified 11
264
BRADBURY ET AL.
FIG. 6. The reactivity patterns based on d(R_R); ⌫ ⫽ 0.1 Å, for: (a) RBA ⬎ 150%, in the range of 11.5 to 13.0 Å; (b) 10 ⬍ RBA ⬍ 100%, in the range of 10.5 to 11.5 Å; (c) 1 ⬍ RBA ⬍ 10%, in the range of 10.5 to 11.5 Å; (d) 1 ⬍ RBA ⬍ 10%, in the range of 9.0 to 10.0 Å; (e) 0.1 ⬍ RBA ⬍ 1%, in the range of 10.5 to 11.5 Å; and (f) 0.1 ⬍ RBA ⬍ 1%, in the range of 9.0 to 10.0 Å.
more active chemicals (4 – 8, 10 –15) and 5 less active chemicals (23–25, 34, 37). As mentioned previously, as RBA values decreased, the specificity and stability of reactivity patterns also decreased, which is consistent with an increasing rate of false positive and negative assignments. Use of patterns based on more precise approximations of conformer distributions did not change the rate of false positive or negative identifications (data not shown). The reactivity pattern associated with HAR4 had the lowest specificity. The E HOMO range of –9.95 to – 8.73 eV(⌫ ⫽ 1.0 eV; 99% confidence limit, data not shown) was combined with SE(R) patterns of 0.239 to 0.269 (a.u.) 2/eV or 0.248 to 0.279 (a.u.) 2/eV, defined within the window of 0.2 to 0.3 (a.u.) 2/eV (for ⌫ ⫽ 0.05 a.u. and confidence limit ⫽ 90%; Table 3, part d). No distance screen was included in the HAR4 pattern, due to its limited ability to discriminate ligands. The combined
E HOMO/SE(R) pattern correctly identified 5 out of 7 chemicals in the training set. Ligand 29 (kepone; having a single conformer) was not identified as active due to a E HOMO value of –10.92 eV and 26(o,p⬘-DDT) was not identified due to an SE(R) range of 0.320 to 0.330 (a.u.) 2/eV. The specified pattern does, however, capture basic electronic requirements for eliciting hER␣ binding affinity, as it successfully identified almost all of the chemicals in HAR1–HAR3. Of the compounds with measured RBAs between 0.1 and 0.01%, 4 of 8 chemicals were selected, while 2 of the 9 compounds between 0.01 and 0.00% were selected. Decision Tree for Identification of hER␣ Ligands The stereoelectronic requirements of the reactivity pattern associated with each RBA range were organized in a hierar-
PREDICTING hER␣ BINDING AFFINITY
265
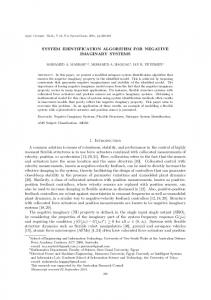
FIG. 7. A decision tree for identification of estrogen ligands with RBA values greater than 0.1%. The decision tree is based on a pre-screen followed by a sequence of rules based on reactivity patterns derived from ligands with RBA values ⬎ 150%, between 10 and 100%, between 1 and 10%, and between 0.1 and 1%.
chical decision tree, whose output was an estimated probability that a conformer would bind to the hER␣ within a given RBA range. The initial part of the tree consists of absolute screens, i.e., the necessary structural requirements for eliciting minimal ER binding affinity, i.e., RBA ⱖ 0.1%. For example, enantiomers of steroids were required to have trans-trans (B/C trans and C/D trans) ring fusion as an absolute steriochemistry screen. Global nucleophilicity was also assumed an absolute electronic requirement, and an E HOMO of –9.95 eV was selected as the necessary nucleophilicity threshold. This value is equivalent to the left side boundary of the E HOMO range for the 99% confidence limit of the pattern associated with the least active training subset (HAR4). The presence of negatively charged (i.e., potential electron donors) atomic sites was also employed as a basic requirement for a ligand to have an RBA ⱖ 0.1%. This requirement was specified as any hetero-atomic site (R ⫽ O, N, Cl, F, S, etc.) with a donor-delocalizability (i.e., atomic nucleophilicity) in the range of 0.239 to 0.279 (a.u.) 2/eV. This range was based on a delocalizability screen derived from the 90% confidence distribution for the active ligands in HAR4 across ⌫ values of 0.05 and 0.01 (a.u.) 2/eV. Alternatively, a charge requirement defined as – 0.298 to – 0.233 a.u. (based on the 90% confidence limit ranges in Table 3) could be used as an absolute electronic site requirement. In our previous study
with androgen ligands, an atomic charge requirement of – 0.322 to – 0.300 a.u. was determined (Mekenyan et al., 1997, 1999), which indicates that active ER ligands in this training set have significantly less negative atomic sites than androgen receptor ligands. Conformers which had E HOMO values of less than –9.95 eV, electronegative sites not meeting the specified donor delocalizability, or steroids not conforming to stereochemical requirements of the natural enantiomer, were assigned a 0% probability to bind to hER␣ with a RBA ⬎ 0.1% (Fig. 7). Conformers that passed these absolute requirements were then compared to the E HOMO, interatomic distance and charge or delocalizability screens associated with HAR1. Using the simplified binary screening approach described in the Methods, the identification of a ligand with a binding affinity within a RBA range requires that at least one conformer meets all three specified parameter ranges. If a compound was not identified as having an RBA ⬎ 150%, it was then screened to determine if it had an RBA between 10 and 100% (HAR2) and so on (Fig. 7). Thus, the decision reflected a sequential ordering of the reactivity patterns derived from HAR1, HAR2, HAR3, and HAR4. With the goal of minimizing the number of false negative identifications, the E HOMO rules used for the different RBA
266
BRADBURY ET AL.
TABLE 4 Predicted RBA Ranges Based on the Decision Tree Described in the Text Predicted RBA ranges (%) a No.
Ligand
Measured RBA (%)
⬎150
1 2 3 4 5 6 7 8 9 10 11 12 13 14 15 16 17 18 19 20 21 22 23 24 25 26 27 28 29 30 31 32 33 34 35 36 37 38 39 40 41 42 43 44 45 46
Hexestrol Diethylstilbestrol Dienestrol 4–OH–Tamoxifen E2 Coumestrol ICI–164,384 Estrone 17␣–Estradiol Nafoxidine Moxestrol Clomifene –Zearalanol Estriol 4–OH–Estradiol 2–OH–Estradiol 5–Androstenediol Tamoxifen Genistein 3–Androstanediol Estrone HPTE Estrone–3–sulfate Norethynodrel 4–Androstenediol o,p⬘–DDT 4–nonylphenol 4–t–octylphenol Kepone Norethindrone 3␣–Androstanediol p,p⬘–DDT Bisphenol A Dehydroepiandrosterone 5␣–Dihydrotestosterone BBP Methoxychlor 4–Androstenedione 5–Androstanedione Testosterone 5␣–Androstanedione 19–Nortestosterone Dieldrin -Sitosterol Corticosterone Progesterone
⬎150 ⬎150 ⬎150 ⬎150 100 ⬎ RBA ⬎ 10 100 ⬎ RBA ⬎ 10 100 ⬎ RBA ⬎ 10 100 ⬎ RBA ⬎ 10 100 ⬎ RBA ⬎ 10 100 ⬎ RBA ⬎ 10 100 ⬎ RBA ⬎ 10 100 ⬎ RBA ⬎ 10 100 ⬎ RBA ⬎ 10 100 ⬎ RBA ⬎ 10 100 ⬎ RBA ⬎ 10 10 ⬎ RBA ⬎ 1 10 ⬎ RBA ⬎ 1 10 ⬎ RBA ⬎ 1 10 ⬎ RBA ⬎ 1 10 ⬎ RBA ⬎ 1 10 ⬎ RBA ⬎ 1 10 ⬎ RBA ⬎ 1 1 ⬎ RBA ⬎ 0.1 1 ⬎ RBA ⬎ 0.1 1 ⬎ RBA ⬎ 0.1 1 ⬎ RBA ⬎ 0.1 1 ⬎ RBA ⬎ 0.1 1 ⬎ RBA ⬎ 0.1 1 ⬎ RBA ⬎ 0.1 0.1 ⬎ RBA ⬎ 0.01 0.1 ⬎ RBA ⬎ 0.01 0.1 ⬎ RBA ⬎ 0.01 0.1 ⬎ RBA ⬎ 0.01 0.1 ⬎ RBA ⬎ 0.01 0.1 ⬎ RBA ⬎ 0.01 0.1 ⬎ RBA ⬎ 0.01 0.1 ⬎ RBA ⬎ 0.01 0.01 ⬎ RBA ⬎ 0.00 0.01 ⬎ RBA ⬎ 0.00 0.01 ⬎ RBA ⬎ 0.00 0.01 ⬎ RBA ⬎ 0.00 0.01 ⬎ RBA ⬎ 0.00 0.01 ⬎ RBA ⬎ 0.00 0.01 ⬎ RBA ⬎ 0.00 0.01 ⬎ RBA ⬎ 0.00 0.01 ⬎ RBA ⬎ 0.00
x x x x
100 ⬎ RBA ⬎ 10
10 ⬎ RBA ⬎ 1
x x x x [x x x x x x x x
1 ⬎ RBA ⬎ 0.1
RBA ⬍ 0.1
x] b
x x x x x x x x x [x x x
x] c
x x x x x x x x x x x x x x x x x x
Note. Chemicals are assigned to the highest RBA range predicted and not further evaluated by patterns associated with lower RBA ranges. a Derived from decision tree described in Figure 7, where the highest predicted range is based on at least one conformer meeting all required E HOMO, Q(R)/SE(R), and d(R_R) screens. Patterns are described in the text section “Derivation of hER␣ Ligand Reactivity Patterns.” b Using the rules described in Figure 7, compound 9 is predicted to have an RBA of 1 to 0.1%. If additional d(R_R) screens of 10.38 to 10.51 Å and 11.50 to 11.80 Å are employed (see section “Derivation of hER␣ Ligand Reactivity Patterns”), the predicted RBA value for compound 9 is between 100 and 10%. c Using the rules described in Figure 7, compound 26 is predicted to have an RBA ⬍ 0.1%. If an additional SE(R) screen of 0.300 to 0.330 a.u./(eV) 2 is employed (see section “Derivation of hER␣ Ligand Reactivity Patterns”), the predicted RBA value for compound 26 is between 0.1 and 1%.
PREDICTING hER␣ BINDING AFFINITY
ranges were based on the minimal electron donating ability noted for each binding affinity range. Thus, E HOMO rules were “one-sided” and required that a minimal electron donating capability be met (i.e., – 8.99 eV ⬍ E HOMO, for HAR1; –9.44 eV ⬍ E HOMO, for HAR2; –9.87 eV ⬍ E HOMO, for HAR3, and –9.95 eV ⬍ E HOMO, for HAR4). The distance patterns require that at least one of the heteroatoms meet a previously specified charge or donor-delocalizability requirement. The distance and delocalizability/charge requirements of the pattern are described in terms of the least restrictive screens based on confidence limits ⱖ 90% around the most probable values determined in the respective distributions. Application of the decision tree to the data set used in this study is summarized in Table 4. In general, most predictions were within an order of magnitude of observed RBA values. Consistent with the conservative bias in selection of reactivity patterns, the majority of predictions that were not within an order of magnitude of the observed RBA values over-predicted binding potential. For the 15 chemicals within observed RBA values ⱖ 10%, only 17␣-estradiol (9) was incorrectly predicted to have 0.1 ⬍ RBA ⬍ 1%. However, this was corrected if additional d(R_R) screens of 10.38 to 10.51 Å and 11.5 to 11.80 Å are used. Two chemicals, 2-OH-estradiol (16; RBA ⫽ 7%), and potentially estrone (8 and 21; RBA ⫽ 60 or 2.1%) were incorrectly predicted as having an RBA ⬎ 10%. Thus, of those compounds with the greatest binding affinity and most specific reactivity patterns there was only one false negative, while two (potentially only one) additional chemicals were falsely predicted to have RBA ⬎ 10%. For compounds with observed RBA values between 1 and 10%, the false negative predictions were for tamoxifen (18; RBA ⫽ 5.1%) predicted to have an RBA between 0.1 and 1% and 3-androstanediol (20; RBA ⫽ 3%) predicted to have RBA values less than 0.1%. False positive identifications for the RBA range between 1 and 10% included estrone-3-sulfate (23), norethynodrel (24), 4-androstenediol (25), dehydroepiandrosterone (34), and methoxychlor (37), with measured RBA values of 1, 0.7, 0.5, 0.04, and 0.012%, respectively. Kepone (29; RBA ⫽ 0.2%) was the only false negative identification in the range of 0.1 to 1%, whereas 4 compounds were false positive identifications for binding affinity, in this range, having measured RBA values of 0.045 (33), 0.015 (36), 0.003 (43), and ⬍ 0.001% (44). As depicted in Table 4, the accuracy of predictions was greatest for RBA values exceeding 10%. This observation is consistent with the specificity of the associated reactivity patterns and the high degree of biological similarity, in terms of RBA values, for the compounds in this portion of the data set. Thus, the exploratory prioritization scheme, based on the current knowledge base, appears to provide a reasonably robust means to identify hER␣ ligands whose binding affinities are at least 10% of E 2. Within the current data set, the specificity of
267
reactivity patterns decreases as RBA values fall below 10% of E 2, which is consistent with expectations; i.e., as compounds become less similar to E 2 in terms of binding affinity, one would expect a decreased basis for establishing chemical similarity to the natural ligand. Several chemicals with low binding affinity are of concern, however, due to their ubiquity. To accurately predict activity for these types of chemicals requires development of models based on a restricted congeneric series. The COREPA approach, in fact, has been used successfully to predict the estrogenicity of alkylphenolic chemicals, a group of relatively weak, but important, environmental estrogens (Schmieder et al., 2000). Prospectus Development of quantitative chemical similarity and structure-activity models requires well defined biological and/or toxicological effect data from chemicals representative of the diversity of structures for which predictions are to be made. The data used in the current study are all based on RBA values of hER␣ derived from 2 laboratories using similar experimental techniques (Bolger et al., 1998; Kuiper et al., 1997). As noted previously, only estrone RBA values differed significantly between the 2 studies. While these RBA values represent a broad range of structures, additional data from a more diverse set of structures would improve the basis for evaluating the reactivity patterns and the prioritization scheme for the ranges of RBA values modeled in the present investigation. Of particular concern is whether the reactivity patterns, and associated decision tree, have been over-specified to the training set. To the extent this may be the case, the results of this study need to be interpreted with caution in terms of immediate use in hazard identification. In our companion paper (Mekenyan et al., 2000), the accuracy of the reactivity patterns for ER binding affinity are explored by comparing predicted values to observed RBAs using receptors obtained from rodents and MCF7 cells. Use of data from outside the hER␣ training set allows a more complete evaluation of the reactivity patterns and decision tree in terms of the its applicability to a more diverse chemical structure space. Inclusion of this additional data “enriches” the chemical structure space for defining chemical similarity in specified RBA ranges, while seemingly providing minimal cross-species variability that could confound the interpretation. The companion paper also discusses how a “mammalian” ER binding affinity chemical prioritization scheme, based on the COREPA–C algorithm, could be applied to chemical data sets reflecting existing inventories in the United States and Europe. APPENDIX
COREPA-C Parameters Cutoff(AP/NAP): The portion of the non-active pattern exceeded by the maximum of the active pattern (3-D similarity
268
BRADBURY ET AL.
measure between reactivity patterns of active and non-active chemicals) ⌫ (gamma): Corresponds to the half-width of a gamma function HAP: High activity pattern, i.e., the reactivity pattern based on the learning set of active chemicals HAR: High activity range HAT: High activity threshold, used to define the “learning” set of active chemicals MaxP kA(x): Value of parameter x with the maximum probability of occurrence based on the distribution of the training set of active chemicals MaxP kNA (x): Value of parameter x with the maximum probability of occurrence based on the distribution of the training set of non-active chemicals NAP: Non-active pattern, i.e., the reactivity pattern based on the learning set of non-active chemicals NAR: Non-active range NAT: Non-active threshold, used to define the “learning” set of non-active chemicals P i(x): Gamma function (probabilistic) distribution of I-th conformer across the axis of molecular descriptor x (single or multiple descriptor values are associated with the conformer when x is a global or local molecular parameter, respectively) P k(x): Gamma function distribution for all conformers of chemical k across the axis of the molecular descriptor x P kA (x): Probabilistic distribution for the training set of active chemicals across the axis of the molecular descriptor x P kNA(x): Overall probabilistic distribution for the training set of non-active chemicals across the axis of the molecular descriptor x S(AP/NAP): 3-D similarity between reactivity patterns of active and non-active chemicals with respect to the molecular descriptor x (overlap of distributions of chemicals within each training set) S(k/AP): 3-D similarity between a chemical k and the active pattern with respect to the molecular descriptor x (overlap between conformer distribution of the chemical and the distribution of the chemicals from the active training set) S(k/NAP): 3-D similarity between a chemical k and the non-active pattern with respect to the molecular descriptor x (overlap between conformer distribution of the chemical and the distribution of the chemicals from the non-active training set) S yz(x): 3-D similarity between two chemicals, y and z, with respect to the molecular descriptor x (i.e., the overlap between conformer distributions of two chemicals across x) QSAR Descriptors d(O_O): Interatomic distances between oxygen atoms (Å) d(R_R): Interatomic distances between all heteroatoms (Å) Egap: Electronic gap (E HOMO-E LUMO) (eV) E HOMO: Energy of highest occupied molecular orbital (eV)
E LUMO: Energy of lowest unoccupied molecular orbital (eV) EN: Electronegativity GW: Sum of geometric distances : Dipole moment (D) Max distance: The greatest interatomic distance Planarity: The normalized sum of torsion angles in a molecule Q(O): Charges of oxygen atoms (a.u.) Q(R): Charges of all heteroatoms (a.u.) RBA: Relative binding affinity to human ER␣ (hER␣) expressed as percent relative to 17-estradiol ⫽ 100% RMS: Root mean square SE(O): Donor delocalizabilities of oxygen atoms ((a.u.) 2/eV) SE(R): Donor delocalizabilities of all heteroatoms ((a.u.) 2/eV) SN(O): Acceptor delocalizabilities of oxygen atoms SN(R): Acceptor delocalizabilities of all heteroatoms ACKNOWLEDGMENTS This research was supported, in part, by a cooperative agreement between Bourgas University “Prof. As. Zlatarov” and the U.S. EPA (CR822306 – 01– 0) and by an agreement between Bourgas University “Prof. As. Zlatarov” and the European Union (EU Project IC20-CT98-0114, EDAEP). The authors thank Dr. Stoyan Karabunarliev for fruitful discussions. Comments on an earlier draft of the manuscript were provided by Chris Russom and Mike Hornung. Diane Spehar and Roger LePage assisted in manuscript preparation.
REFERENCES Ankley, G., Bradbury, S. P., Hermens, J., Mekenyan, O. G., and Tollefsen, K.-E. (1997). Current approaches to the use of structure activity relationships (SARs) in identifying the hazards of endocrine-disrupting chemicals to wildlife. Proceedings of the EMWAT Workshop, pp. 19 – 40. SETACEurope, April 1997, The Netherlands. Anstead, G. M., Carlson, K. E., and Katzenellenbogen, J. A. (1997). The estradiol pharmacophore: Ligand structure-estrogen receptor binding affinity relationships and a model for the receptor binding site. Steroids 62, 268 –303. Anstead, G. M., Wilson, S. R., and Katzenellenbogen, J. A. (1989). 2-Arylindenes and 2-arilindenones: Molecular structures and considerations in the binding orientation of unsymmetrical non-steroidal ligands to the estrogen receptor. J. Med. Chem. 32, 2163–2171. Bolger, R., Wiese, T. E., Ervin, K., Nestich, S., and Checovich, W. (1998). Rapid screening of environmental chemicals for estrogen receptor binding capacity. Environ. Health Perspect. 106, 551–557. Bradbury, S. P. (1994). Predicting modes of toxic action from chemical structure: An overview. SAR QSAR Environ. Res. 2, 89 –104. Bradbury, S. P., Mekenyan, O. G., and Ankley, G. T. (1996). Quantitative structure-activity relationships for polychlorinated hydroxybiphenyl estrogen receptor-binding affinity: An assessment of conformational flexibility. Environ. Chem. Toxicol. 15, 1945–1954. Bradbury, S. P., Mekenyan, O. G. and Ankley, G. T. (1998). The role of ligand flexibility in predicting biological activity: Structure-activity relationships for aryl hydrocarbon, estrogen, and androgen receptor-binding affinity. Environ. Toxicol. Chem. 17, 15–25. Eliel, E. L. (1993). Chemistry in three dimensions. In Chemical Structures (W. A. Warr, Ed.), Vol. 1, pp. 1– 8. Springer, Berlin.
PREDICTING hER␣ BINDING AFFINITY Goldstein, R. A., Katzenellenbogen, J. A., Luthey-Schulten, Z. A., Seielstad, D. A., and Wolynes, P. G. (1993). Three-dimensional model for the hormone binding domains of steroid receptors. Proc. Natl. Acad. Sci. U.S.A. 90, 9949 –9953. Ivanov, J. M., Karabunarliev, S. H., and Mekenyan, O. G. (1994). 3DGEN: A system for an exhaustive 3D molecular design. J. Chem. Inf. Comput. Sci. 34, 234 –243. Ivanov, J. M., Mekenyan, O. G., Bradbury, S. P., and Schu¨u¨rmann, G. (1998). A kinetic analysis of the conformational flexibility of steroids. Quant. Struct.-Act. Relat. 17, 437– 449. Kavlock, R. J., Daston, G. P., DeRosa, C., Fenner-Crisp, P., Earl Gray, L., Kaattari, S., Lucier, G., Luster, M., Mac, M. J., Maczka, C., Miller, R., Moore, J., Rolland, R., Scott, G., Sheehan, D. M., Sinks, T., and Tilson, H. A. (1996). Research needs for the risk assessment of health and environmental effects of endocrine disruptors: A report of the U.S. EPAsponsored workshop. Environ. Health Perspect. 104, 715–740. Kuiper, G. G. Carlsson, B., Grandien, K., Enmark, E., Haggblad, J., Nilsson, S., and Gustafsson, J.-K. (1997). Comparison of the ligand binding specificity and transcript tissue distribution of estrogen receptor ␣ and . Endocrinology 138, 853– 870. Lewis, D. F. Parker, M. G., and King, R. J. (1995). Molecular modeling of the human estrogen receptor ligand interactions based on site-directed mutagenesis and amino acid sequence homology. J Steroid Biochem. Mol. Biol. 52, 55– 65. Mekenyan, O. G., Bradbury, S. P., Kamenska, V. B., Schmieder, P. K., Marafante, E., and Ankley, G. T. (2000). A computationally-based identification algorithm for estrogen receptor ligands: II. Evaluation of a hER␣ binding affinity model. Toxicol. Sci. 58, 270 –281. Mekenyan, O. G., Ivanov, J. M., Karabunarliev, S. H., Bradbury, S. P., Ankley, G. T., and Karcher, W. (1997). A computationally based hazard identification algorithm that incorporates ligand flexibility: I. Identification of potential androgen receptor ligands. Environ. Sci. Technol. 31, 3702–3711. Mekenyan, O. G., Ivanov, J. M., Veith, G. D., and Bradbury, S. P. (1994a). DYNAMIC QSAR: A new search for active conformations and significant stereoelectronic indices. Quant. Struct. Act. Relat. 13, 302–307. Mekenyan, O. G., Karabunarliev, S. H., Ivanov, J. M., and Dimitrov, D. N. (1994b). A new development of the OASIS computer system. Comput. Chem. 18, 173–187. Mekenyan, O. G., Nikolova, N., Karabunarliev, S. H., Bradbury, S. P., Ankley, G. T., and Hansen, B. (1999). New developments in a hazard-identification algorithm for hormone receptor ligands. Quant. Struct. Act. Relat. 18, 139 –153. Mekenyan, O. G., Peitchev, D., Bonchev, D., Trinajstic, N., and Bangov, I.
269
(1986). Modeling the interaction of small molecules with biomacromolecules: I. Interaction of substituted pyridines with anti-3-azopyridine antibody. Arzneimittelforschung 36, 176 –183. Mekenyan, O. G., Schultz, T. W., Veith, G. D., and Kamenska, V. B. (1996a). “Dynamic” QSAR for semicarbazide-induced mortality in frog embryos. J. Appl. Toxicol. 16, 355–363. Mekenyan, O. G., Veith, G. D., Call, D. J., and Ankley, G. T. (1996b). A QSAR evaluation of Ah-receptor binding of halogenated aromatic xenobiotics. Environ. Health Perspect. 104, 1302–1309. Schmieder, P. K., Aptula, A. O., Routledge, E. J., Sumpter, J. P., and Mekenyan, O. G. (2000). Estrogenicity of alkylphenolic compounds: A 3-Dstructure activity evaluation of gene activation. Environ. Toxicol. Chem. 19, 1727–1740. Schu¨u¨rmann, G. (1990). Quantitative structure-property relationships for the polarization, solvatochromic parameters and lipophilicity. Quant. Struct.Act. Relat. 59, 326 –333. Stewart, J. J. (1990). MOPAC: A semiempirical molecular orbital program. J. Comput.-Aided Mol. Des. 4, 1–105. Stewart, J. J. (1993). MOPAC 93. Fujitso Limited, 9 –3, Nakese 1-Chome, Mihama-Ku, Chiba-City, Chiba 2al, Japan, and Stewart Computational Chemistry, Colorado Springs, CO. Topliss, J. G., and Edwards, R. P. (1979). Chance factor in studies of quantitative structure-activity relationships. J. Med. Chem. 22, 1238 –1244. VanderKuur, J. A., Wiese, T., and Brooks, S. C. (1993). Influence of estrogen structure on nuclear binding and progesterone receptor induction by the receptor complex. Biochemistry 32, 7002–7008. Waller, C. L., Minor, D. L., and McKinney, J. D. (1995). Using threedimensional quantitative structure-activity relationships to examine estrogen receptor binding affinities of polychlorinated hydroxybiphenyls. Environ. Health Perspect. 103, 702–707. Waller, C. L., Oprea, T. I., Chae, K., Park, H.-K., Korach, K. S., Laws, S. C., Wiese, T. E, Kelce, W. R, and Gray, L. E., Jr. (1996a). Ligand-based identification of environmental estrogens. Chem. Res. Toxicol. 9, 1240 – 1248. Waller, C. L., Juma, B. W., Gray, L. E., Jr., and Kelce, W. R. (1996b). Three-dimensional quantitative structure-activity relationships for androgen receptor ligands. Toxicol. Appl. Pharmacol. 137, 219 –227. Wiese, T., and Brooks, S. C. (1994). Molecular modeling of steroidal estrogens: Novel conformations and their role in biological activity. J. Steroid Biochem. Mol. Biol. 50, 61–73. Wurtz, J. M., Bourguet, W., Renaud, J. P., Vivat, V., Chambon, P., Moras, D., and Gronemeyer. H. (1996). A canonical structure for the ligand-binding domain of nuclear receptors. Nat. Struct. Biol. 3, 206.