by array size in a computer simulation model (HARD- ... infinite alleles model of both simulated VNTR diversity and observed VNTR polymorphisms sampled.
Copyright 0 1999 by the Genetics Society of America
A Computer Simulation Studyof VNTR Population Genetics: Constrained Recombination Rules Out the Infinite Alleles Model Rosalind M. Harding,* A. J. Boyce,t J. J. Martinson,*J. Flint* andJ. B. Clegg*
* MRC
Molecular Haematology Unit, instituteof Molecular Medicine, University of Oxford, John Radclaffe Hospital, Headington, Oxford, OX3 SOU, United Kingdom, and tDepartment of Biological Anthropology, University of Oxford, 58 Banbury Road, Oxford OX2 6QS, United Kingdom Manuscript received March 25, 1993 Accepted for publication July 9, 1993
ABSTRACT Extensive allelic diversity in variable numbers of tandem repeats (VNTRs) has been discovered in the human genome. For population genetic studies of VNTRs, such as forensic applications, it is importantto know whether a neutral mutation-drift balance of VNTR polymorphismcanbe represented by the infinite alleles model. The assumption of the infinite alleles model that each new mutant is unique is verylikely to be violated by unequal sister chromatid exchange (USCE), the primary process believed to generate VNTR mutants. We show that increasing both mutation rates and misalignment constraint for intrachromosomal recombination in a computer simulation model reduces simulated VNTR diversity below the expectations of the infinite alleles model. Maximal constraint, represented as slippage of single repeats, reduces simulated VNTR diversity to levels expected from the stepwise mutation model. Although misalignment rule is the more important variable, mutation rate also has an effect. At moderate rates of USCE, simulated VNTR diversity fluctuates around infinite alleles expectation. However, if rates of USCE are high, as for hypervariable VNTRs, simulated VNTR diversity is consistently lower than predicted by the infinite alleles model. This has been observed for many VNTRs and accounted for by technical problems in distinguishing alleles of neighboring size classes. We use sampling theory to confirm the intrinsically poor fit to the infinite alleles model of both simulated VNTR diversity and observed VNTR polymorphisms sampled from two Papua New Guinean populations.
D
NA profiling with variable numbers of tandem repeat (VNTR) sequences can be used to characterize individuals uniquely and to evaluate kinship relations between individuals in a pedigree. There is a wide range of applications for these polymorphisms in forensic science, parentage testing and disease-gene linkage studies. In providing access to a vast reservoir of population polymorphism, analyses of VNTR loci also hold promise for new lines of research in population genetics (HARDING 1992). T h e extensive polymorphism at VNTR loci has beenexplained by highrates of intrachromosomal recombination. Because tandemly repeated DNA sequences are vulnerable to misalignment between arrays of identical repeats on sister chromatids, mitotic or meiotic intrachromosomal recombination may occur. This is called unequal sister chromatid exchange array of tandem (USCE). A replicatedprogenitor repeats then produces two new alleles, one shorter and one longer by the number of misaligned repeats, presuming that the crossover occurs within the region of sequence identity. These new alleles can be distinguished on a gel because of their variable lengths in numbers of repeat motifs, and likewise characterized by array size in a computer simulation model (HARDGenetics 135: 91 1-922 (November, 1999)
BOYCEand CLEGG1992). Studiesof minisatellite VNTRs (JEFFREYS et al. 1988) indicate that mutant alleles are similar in size to their progenitors,suggesting that misalignment is not usually very great. However, thequantitative relationshipsbetween the length of the progenitor array and the rates and rules of recombination are not well understood. Working with a computer simulation model for the evolution of a VNTR locus allows not only alternative rates but also different rules of misalignment to be explored. They are investigated in this study within a populationgeneticcontext under assumptions that VNTRs are neutral and that VNTRpolymorphism is evolutionarily transient (HARDING, BOYCEand CLEGG 1992). Evolutionary transience results if mutation to smaller and larger alleles is an unbiased process in a finite population. USCE is such a process and transience of minisatellite loci has been described by GRAY and JEFFREYS (1991). In contrast, polymorphism in otherforms of tandemlyrepetitiveDNA, such as satellite DNA (STEPHAN1986; WALSH 1987)and and IIZUKA 1992), short arrays of repeats (TACHIDA has been modeled as an equilibrium between intrastrand deletion and single repeat duplication. For this study we assume the existence of long arrays of tanING,
912
Harding et al.
demrepeats without examining the amplification process that gave rise to them. The generation of VNTR population diversity by USCE is modified by genetic drift, which removes many alleles that might be expected to exist on consideration of USCEalone. As the frequencies of alleles fluctuate, are we to expect uniform, modal or multimodal distributions? Do VNTRs tend to span continuous size ranges or arelarge gaps to be expected?Are VNTR size distributions stable or do they suddenly explode or decay as suggested by studies (HARDING, BOYCEand CLEGG1992) of the persistence time of single lineages? Finally, can VNTRs be expected to have the same distribution as polymorphisms generated by theinfinite alleles model (KIMURA 1983)? Determining whether VNTR polymorphism fits this model is important because upon it depends one of the proposed methods for evaluating population substructure in national distributions of VNTR alleles used for forensic analyses (CHAKRABORTY DAIGER and 1991; CHAKRABORTY JIN and1992). We compare simulated VNTR diversity with that expected from the infinite alleles and stepwise mutation models (KIMURA1983), which represent two extremes in expectations of diversity. In both of these models the generation of new alleles by mutation is balanced with their loss bydrift, under the assumption of neutrality, attaining equilibrium distributions. In the infinite alleles model there are aninfinite number of states to which an allele can mutate andeach mutant state is equally likely irrespective of the state of the progenitor allele. Also, every realized mutant allele is unique because out of an infinity of possibilities it is not likely that an allele will mutate to one of the few states presently represented in the population. In the stepwise mutation model (KIMURAand OHTA 1978), there are only two adjacent states to which an allele can mutate in a single step. As back mutations to allelic states already representedin the population are common, there are fewer alleles compared with the infinite alleles model for the same population size and rate of mutation. The stepwise mutation model therefore predicts lower levels of heterozygosity than the infinite alleles model (KIMURAand OHTA 1978). It has been shown by VALDES,SLATKIN andFREIMER (1 992) that microsatellite VNTR diversity is consistent with the expectations of the stepwise mutation model. We apply EWENS-WATTERSON sampling theory (EWENS 1972; WATTERSON 1978)to test the fit of the simulated VNTR allele frequency distributions to the infinite alleles model and compare these results with those obtained by likewise testing the VNTR allele frequency distributions determined from samples of Papua New Guinean highland and coastal populations (FLINTet al. 1989). Some observed VNTR allele fre-
quency distributionshave been shown to fit an infinite alleles model reasonably well (CLARK 1987; CHAKRABORTY and DAIGER1991). However, wherever there is a significant discrepancy, the observed numbers of singleton alleles and commonest allele frequencies are too low compared with sampling theory expectations based on the infinite alleles model (CLARK1987; FLINTet al. 1989; CHAKRABORTY DAIGER and 1991). DEKA, CHAKRABORTY and FERRELL (11)99examined allele frequency distributions for Dl S57, RB1, DlS77, DlS61, alpha-globin 5'HVR and DlS76 in three well-defined populations, the Kachari of Northeast India, Dogrib Indians of Canada and Kalam and Gainj speaking highlandersof Papua New Guinea and reported numbers of VNTR alleles that were too few for the given heterozygosities assuming the infinite alleles model. In fact,as many examples of good fit to a stepwise mutation model as to an infinite alleles model were found. FORMULATION OF THE MODEL T o investigate the balance of mutation and driftfor VNTR polymorphism, we introduce population dynamics to a model forthe evolution of tandemly repetitive DNA described by HARDING, BOYCEand CLEGG (1992). Inthis Monte Carlo simulation model tandemly repetitive DNA evolves subject to specified rules and rates of intrachromosomal recombination. Alleles are represented as strings of identical repeats and identified by their size in numbers of repeats. In each generation there is an array of allele sizes with an associated array of integer frequencies. For this study the production of new alleles by mutation is balanced with loss by sampling drift between generations. A population, measured in numbers of chromosomes (NC) rather than individuals, is assumed to fluctuate in size around an equilibrium value. In each generation there are three main events, replication of a tandem array, mutation andsampling of alleles. For the replication of nonmutants, their frequencydistribution is simply duplicated, which copies the chromosomes exactly. For mutants, picked using the random number generator RAN3 (PRESSet al. 1986), unequal crossing over produces two new daughter alleles from the progenitor sister chromatid duplex. The extent of misaligment between tandem repeatarrays is selected randomly from the range determined by the set recombination rules and rates, described below. An exchange is simulated by generating complementary additions and deletions of repeats from the progenitor array sizes. An allele frequency distribution is produced by adding the new mutant frequencies to the nonmutating part of the progenitor allele distribution. The progeny for the next generationare sampled from the replicated chromosomes with probability:
Simulation of VNTR Genetics Population
>
2NC
where r = 0.01. The population size, NC, fluctuates between generations due to randomsampling but the parameter, r, maintains NC at approximately 2000. Since the sampling is imposed on the replicated distributions, both, or neither, mutants derived from a single progenitor may be included in the next generation. This is allowed because the single time point for reproduction in the model represents a reproductive time span. We have modeled NC as a variable and set the population demography as described to be appropriate for an accompanying simulation study of the effects of population bottlenecks and expansion on VNTR diversity in Oceania. The probability of allelic mutation, p, is a function of allele size andthe probability of mutation per repeat, X. The initial allele length was set at 200 repeats for all simulations. An allelic mutation rate p = 1.8 X 10⁻³ was generated with a mutation rate per repeat of X = 9 X and a rate p = 1.8 X lo-' was set by putting X = 9 X Because the average VNTR allele size changesovertime, the average allelic mutation rate also varies. Since the mutation rate is set per repeat, rather than perallele, the allelic mutation rate could increase to more than onemutation per individual locus pergeneration.However, only single USCE events per individual per generation are permitted. Whether alleles mutate only by small steps or occasionally also by large steps, is controlled by the constraints on misalignment. We compare four rules of misalignment: allele-maximum misalignment, targetmaximum and single-repeat misalignment as defined by HARDING, BOYCEand CLEGG (1992),in addition to a new ruletermed window-maximum misalignment. The allele-maximum misalignment rule is modeled by choosing a misalignment of repeats, k, from the range maximally set by allele size, n, and minimally by alignment of a single repeat, such that 1 Ik In 1 with a probability of mutationPr(i).Pr(i) is an inverse function of k so that large misalignments are possible but rare comparedwith small misalignments: Pr(k) =
(n - k)3.4
ci=l (n i=n-l
q3.4
This is the rule used by GRAYandJEFFREYs (1991) in their study of the evolutionary dynamics of the minisatellite MS32. Fortarget-maximum misalignment Pr(i) = 1 for misalignments 1 Ik In - 1 if n It , or 1 Ik 5 t if 1~ > t , where t is the target. In all the simulations presented in this study t = 20. Pr(i) = 0 for k > t and k > n - 1. This ruleimposes misalignment
913
constraint on large alleles so they cannot lose or gain more than 20 repeats but adds no further constraint on misalignment than allele size itself to alleles of up to 20 repeats in length. Window-maximum misalignment is target-maximum misalignment with the further constraint that there is a minimum alignment m, of at least 10 repeats. The maximum misalignment is again 20 repeats. Pr(i) = 1 for misalignments m Ik I n- 1 ifnrt,ormIkItifn>t,andPr(i)=Ofor k > t and k 2 n - m. The rule of single-repeat misalignment specifies Pr(i) = 1 for k = 1 and Pr(i) = 0 for k > 1 or n = 1, so alleles can only mutate by the addition or deletion of single repeats. The VNTRsimulation model is compared with the infinite alleles and stepwise mutation models for measures of genetic diversity specified as the observedand expected effective numbers of alleles. The effective number of alleles was first defined as the inverse of the homozygosity for the infinite alleles model (KIMURA 1983). We use this parameter rather than the homozygosity or heterozygosity because it is not asymptotic and it allows a clearer graphical presentation of the different genetic diversities equivalent to very high heterozygosities. The effective numbers of alleles observed for the VNTR simulation model are computed from the allele frequency distributions at 200generation intervals as l/(x,') where x, is the frequency of the ith allele. The expected effective numbers of alleles, ne, forthe infinite alleles and stepwise mutation models are calculated fromthe parameters 8 = 2NCp. Values of NC and p are computed by averaging over the preceding intervals of 200 generations. For the infinite alleles model: ne=e+ 1
and for the stepwise mutation model:
ne =
4iTT-i
since NC >> 1 >> p (KIMURA1983). We compared the four recombination rules for two different initial values of 8 = 2NCp: 7.2 and 72. These two values of 8 were chosen to represent the range relevant to hypervariable VNTRs including the most rapidly mutating minisatellites. A value of 8 = 7.2 is equivalent to a heterozygosity of 87.8% assuming the infinite alleles model, or of 74.5% assuming the stepwise mutation model (KIMURA1983). A value of 8 = 72 is equivalent to a heterozygosity of 98.6% assuming the infinite alleles model, or of 91.7% assuming the stepwise mutation model (KIMURA1983). Minisatellite VNTR polymorphisms at six loci: MS 1, MS3 1, pG3,MS8, Insulin and Harvey ras, were analyzed in a population studyof Oceania by FLINTet al. (1 989).They assumed the infinite alleles model to test allele frequencydistributionsfor Polynesia for
Harding et al.
914
neutrality. Additionally, heterozygosities forthese VNTRs were reported forVanuatu and thecoast and highlands of Papua New Guinea. Heterozygosities of approximately 99% have been observed for MSl , of between 96% and 98% forMS31 and pG3 (JEFFREYS et al. 1988; FLINTet al. 1989), of 85% in Caucasians (JEFFREYS et al. 1988) and of 95% in Melanesians (FLINTet al. 1989) for the minisatellite MS8, and of values between 60% and 80% for Insulin and Harvey ras (FLINTet al. 1989). Whether the variation in these estimates of heterozygosity for thesame VNTR is due to sampling error or actual population differences is unknown. We apply the Ewens-Watterson sampling test to random samples of 300 drawn with replacement from the simulated VNTR allele frequencydistributions and also to the VNTRallele frequency data for Papua New Guinea obtained by FLINT et al. (1 989). T h e observed number of alleles in the sample k, is compared with E ( k ) , the numberexpected froman infinite alleles model (EWENS 1972): n-I
E(k) = 8
x (8 + i)-'
i=O
Here, B is not calculated directly from N and p but estimated from the heterozygosity, 8 = Ht/(l - Ht) andHt = n(l - X?)/(% - 1) aftercorrectionfor sample size, n = 300 (NEI 198'7). Given the observed number of alleles in the sample, the probabilities of finding the observed homozygosity, number ofsingletons, and frequency of the commonest allele (had this sample beendrawnfromapopulationconforming with the infinite alleles model) are found by computer simulation. We used aprogramwritten by CLARK (1987) that implementsSTEWART'S (1977) algorithm. RESULTS
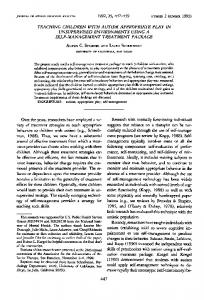
Evolutionary dynamics of VNTR polymorphism: The simulations were run for120,000generations from B = 7.2, and for 20,000 generations from 8 = 72, to find intervals of steady-state dynamics independent of the initial monomorphic distribution.Over these time spans the allelic mutation rate fluctuates as a consequenceof variation in the average VNTR allele size. For each initial value of 8 and for each recombination rule, five simulations were run (Table 1) and from each setof five, the onewith the least fluctuation in B over time was chosen for further graphical presentation. This simulation is given as the first row in each set in Table 1, which shows the allelic mutation rates (p), average VNTR allele sizes in numbers of repeats, the population size in numbers of chromosomes (NC) and the final value of 8. For allele-maximum misalignment (AM"), 19declined approximately an order of magnitude each from 7.2 and 72 for all simulation runs. Both arrayexpansions andarray
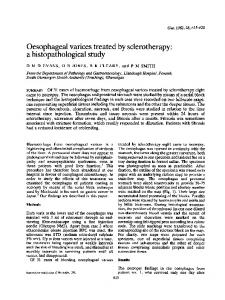
contractions occur over the time intervals examined for target-maximum misalignment (TM-M) and window-maximum misalignment (WM-M), producing a corresponding increase or decline in 8. Least fluctuation in 8 resulted for single-repeat misalignment (SRM). In Figure 1 are shown (a) allelic mutation rate, (b) average allele size, (c) average number of chromosomes and (d) average heterozygosity, for intervals of 200 generations between generations 100,000120,000 for the selected simulations from initial = 7.2. These parameters are likewise shown in Figure 1 (e-h) for generations 0-20,000 for selected simulations from initial 8 = 72. These graphs indicate that8 is determined by the allelic mutationrates, which depend on variation in allele size and not by population numbers. The resulting heterozygosities indicate that target-maximum and window-maximum misalignment sustain higher levels of polymorphism than does allele-maximum misalignment, for which there is more variation in 8, and single-repeat misalignment sustains least. T h e evolution of a VNTR allele frequency distribution from a monomorphic 200 repeat array is presented in Figure 2 for each rule, (a) allele-maximum misalignment, (b) target-maximum misalignment, (c) window-maximum and (d) single-repeat misalignment. The allele frequency distributions are shown for samples of 200 alleles taken from the simulation populations of 2000 described above for initial 8 = 7.2. The samples were taken to make a more manageable dataset for graphical presentation. From a 200 repeat allele, monomorphic at generation 0, a polymorphic distribution is established. Initally, a large number of new alleles both larger and smaller than their progenitor are generated and the distribution spreads out. This situation might be seen in a rapid population expansion from a small bottleneck. T h e dispersal across a wide range of size classes is greatest for allele-maximum misalignment. T h e distribution is multimodal with gaps occurring between clusters of occupied size classes, particularly for large alleles. However, the large alleles are more quickly lost, not only by drift because their frequencies are low, but also by mutation because mutation rate is proportional to allele length. Consequently, the frequency distribution becomes skewed with the accumulation of smaller alleles and the average allele size declines (Figure 2a). The greater constraint of targetmaximum (Figure2b)and window-maximum misalignment (Figure 2c) maintains allelic variation within amuchnarrower size range,sustaining the persistence time of large alleles. For single-repeat misalignment (Figure 2d) there is very little dispersal of alleles across size categories. The allele distribution
Simulation of VNTR Genetics Population
915
TABLE 1 Population parameters fromfive simulation runs eachfor moderate andhigh mutation rates Generation 120,000 B size
AM-M 1737.9 144.1 0.00 13 2064.7 15.3 0.00014 0.00021 0.00014 0.00007 TM-M 0.00181 0.00296 0.003 17 0.00 13 0.00062 WM-M2175.9 188.3 0.00 169 0.0028 0.00 168 0.00284 0.00321 SR-M 0.00 182 0.00 185 0.00 169 0.00172 0.00179
Allele
Generation 20,000
e
NC
B
NC
e
19*
23.1 15.7 8 20 1.2 328.5 352.2 144.2 69.1 3 10.9 187.2 315.2 356.3 202 205.6 188 191.4 199.3
2215.7 4.5* 47.6 0.00428 0.5728.4 0.00256 0.88 0.00153 2 124.7 1901.1 2039.819.9 0.5779 0.001 21770.00157 0.3 1 20 19.6 7.3* 2 367.2 0.03304 1794.1 10.6 0.00794 1987 0.01295 12.6 2059.3 5.3 0.04383 1884.2 2.3 0.03874 7.4* 0.02095 2043.2 11.4 0.02944 1857.9 6.3 0.00536 10.4 0.00872 1829.1 0.0302 1987.7 12.8 1829.3 6.7* 0.01744 2015 2060.5 7.6 0.01772 1990.4 6.7 0.01588 1789.5 6.2 0.01971 1870.2 6.7 0.01757
Allele size
9.1 17.1
1772.3 2152.2
17.4
2037.6 136.4 1909 1639.2 1925.8 2218.6 2007.2 2204.8 2005.2 2003.8 1824.9
88.3 143.9 487 430.5 232.8 327.1 59.6 96.9 335.6 193.8 196.9 176.5 219.1 206.4
1941.9 1955.3 2017.4 1907.7
6.6 6.8 6.4 141.2* 30.3 42.5 168.8 171.9 84.1 * 129.8 21.5 34.9 110.2 70.3* 68.8 62.1 79.6 70.9
All simulations were begun with allele size at 200 repeats and number of chromosomes (NC) at 2,000. Simulations were run for 120,000 generations with initial p = 1.8 X IO-' and fJ = 7.2 and 20,000 generations with initial p = 1.8 X lo-* and fJ = 72. AM": allele-maximum misalirnment, TM-M: targetmaximum misalimment, WM-M: window-maximum misalignment, SR-M: single-repeat misalignment. The starrevd simulation in each Set is that presented ?n the figures.
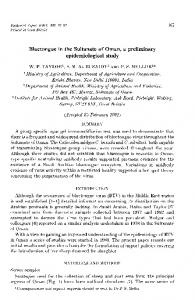
maintains a narrow size range and moves as a block through time. Comparing numbersof alleles between the VNTR simulation model and analytical models:The effective numbers of alleles for each rule are compared with values expectedfromtheinfinite alleles and stepwise mutation models in Figures 3a-d for initial 8 = 7.2. T h e numbers of alleles in asample,both observed and predicted from the infinite alleles model are shown in the adjacent graph. Figures 4a-d show effective numbers of alleles and numbers of alleles in a sample for initial 8 = 72. Steady-state patterns of polymorphism are transiently established and their dynamics overatime span of 5,000 generations, equivalent to 100,000 years of modern human evolution are demonstrated using effective numbers of alleles. A shorter time span of 2,000 generations is shown for sampled numbers of alleles. With initial 8 = 7.2 the diversities generated by allele-maximum, target-maximum and window-maximum misalignment rules fluctuate around infinite alleles expectation (Figure 3a-c). For diversity generated by singlerepeatmisalignment, the stepwise mutationmodel provides the closest approximation (Figure 3d). With initial 8 = 72 the allele-maximum misalignment rule generates lower numbers of alleles than the infinite alleles expection (Figure 4a). This is more clearly seen for diversities generated by target-maximum (Figure 4b) andwindow-maximum (Figure 4c) misalignments, as in these simulations B persists at a higher value.
Single-repeat misalignment generates effective numbers of alleles which are approximatedby the stepwise mutation model (Figure 4d). Comparing fit with the infinite alleles model for the simulated and Papua New Guinea VNTRpolymorphism: Given the numbers of alleles in a sample, the homozygosities, numbers of singletons and frequencies of the commonest allele are compared with infinite alleles expectation for each of the simulated VNTR rules and rates and for the Papua New Guinea data. The results for initial 8 = 7.2 for each of the misalignment rules are given in Table 2 and support the findings presented graphically in Figure 3. The results for initial 8 = 72 for each of the misalignment rules are given in Table 3 and support the findings presented graphically in Figure 4. InTable4,for VNTRs listed in descending order of estimated mutation rate, are the results forthe Papua New Guinean samples. T h e infinite alleles model is rejected for five of the six VNTRs for the highland population and three of the six VNTRsfor coastal Papua New Guinea. Possibly, a significant rejection would be found for insulin for the coastal sample as well as for the highlands had a larger sample been available. For HRAS, which has the lowest mutation rate, the infinite alleles model is not rejected for either sample. DISCUSSION
We havesimulated VNTR mutationasunequal sister chromatidexchange (USCE) todemonstrate
W
916
Harding et al. (a) allelic mutation rate
....
0.003 T
0.0005 0
............. ............
{
. ~ " t" -+ + *
low00
104OOO
lo8000
112000
ll"0
120000
generatims
(b) average allele size
...................
-1. 250
(f) average allele size 4007
~.".,'..,*"m
............
i...'....
Nr
108000
104000
100000
1 1 m
120000
4wo
0
generations
1mo
1"O
2OWO
l"0
20000
generations
(c) population size 2500
8000
(9) population size
T
2000 1500
0
4000
8ooo
12000
generations
(h) heterozygosity
(d) heterozygosity loo
TI
% 60
% I.
I'
" 40
-"-tH
4000
Boo0
12000
1-
20000
generations
FIGURE1.-Variation in population parameters over 20,000 generations for simulations indicated in Table 1 and representing each of the rules of misalignment. AM": allele-maximum misalignment, TM-M: target-maximum misalignment, WM-M: window-maximum misalignment, SR-M: single-repeat misalignment. Mutation rates initialized at p = 1.8 X lo-' are shown in (a), the consequent average allele sizes in (b), independent population size fluctuation in (c) and heterozygosities in (d). Mutation rates initialized at p = 1.8 X lo-' are shown in (e), the consequent average allele sizes in ( f ) , independent population size fluctuation in (9) and heterozygosities in (h).
how this process accounts for characteristics of VNTR allele frequencydistributions. T h e sizes of mutant allelic arrays generated by USCE are not invariably
unique but may represent allelic states that already exist or are size-correlated with those present. The infinite alleles assumption that any allele can mutate
Simulation of VNTR Population Genetics
917
Misalignment (b) Target-Maximum
Misalignment (a) Allele-Maximum
0 1
(c) Misalignment Window-Maximum
40
Misalignment (d) Single-Repeat
gen.
FIGURE2.-Evolution of the allele frequency distributions from monomorphism at generation 1 to a transient steady-stateallele frequency distribution at generation 120,000. Thefrequencies are for samples of 200 drawn from the simulation populations of 2000.
to any other in an infinity of alternative allelic states
with equal probability is not met if VNTR mutants are generated byUSCE. Of the four rules, allelemaximum misalignment obtains the closest approximation of this assumption. This rule does not, however, enable high levels of diversity to be sustained over long evolutionary time spans. In line with the short persistence times reported for single tandem repeat lineages mutating by USCE with allele-maximum misalignment (HARDING,BOYCEand CLEGG 1992), there is a rapid decay of average allelic array size. Consequently, due to the assumption of proportionality between allelic size and mutation rate, the mutation rate declines and reduces the allelic diversity. T h e imposition of constraint on maximum misalignor ment, such as that defined for target-maximum window-maximum misalignment, extends the evolutionary duration of polymorphism for large VNTR arrays. In fact, it seems very unlikely from thedynamics of simulated large tandemly repetitive arrays that USCE acting on VNTRs can occur without considerable misalignment constraint. These results support the inference drawn from simulation studies of single lineages of tandem-repetitive DNA that hypervariable VNTR locimay evolve from short tandem arrays. With misalignment constraint, however, the accumulation of array size is much steadier thanthe explosive
expansions suggested from analysis ofallele-maximum misalignment in single repeat lineages (GRAYand JEFFREYS 1990; HARDING, BOYCEand CLEGG1992). Simulating the neutral evolution of VNTR allele frequencies with target-maximum misalignment demonstrates that the size ranges of alleles in a population tend to occupy acontinuousbut finite interval. If there is misalignment constraint, USCE fillsneighboring allelic size states, not states currently far outside the observed size range. Notably, because of the assumedproportionality between mutationrate and allele length, the smaller alleles accumulate intofewer frequency classes than the larger alleles, even when averagearray size is expanding. Both skewin the frequency distribution toward smaller alleles, as well as continuity of occupied size classes, have been observed forVNTR loci. Single-repeat misalignment sustains the most limited range of VNTR diversity and tends to generate unimodal frequency distributions. This characteristic was also observed for a similar ladder-rung model by EWENSand GILLESPIE (1 974). This simulation study shows that the infinite alleles model is not appropriate for VNTRs such asminisatellites with heterozygosities of 95- 1OO%, although for VNTRs with heterozygosities below 90% the infinite alleles model may often fit unless misalignment is greatly constrained. Given the extent to which re-
Harding et al.
918 (a) Allele-Maxinum Misalignment
No.
01
115000
11600
117000 118000 119000 120000
generations
120000
@) Target-Maxinum Misalignment 12 10 A
No. M
118200
115000 116000 117000 118000 119000 12oooO
120000
generations
(c) WindowMaxinurn Misalignment '4 T
X
A
No.
No.
; 0
115000
11600
117000 118000 119000 120000
generations
120000
(d)Single-Repeat Misalignment 10 8
No.
6t
A
No.
120000
FIGURE3.-Allelic diversity for initial 8 = 7.2, for four misalignment rules, comparing the simulated diversity with the expectations of both the infinite alleles (IA) and stepwise mutation (SM)models in the graph on the left, and with the infinite alleles model only in the histogram on the right. Diversity is indicated by effective numbers of alleles in the population in the graph on the left. For the final 2000 generations samples of 300 were drawn from the simulated populations and numbers of alleles counted. Observed numbers are unshaded and expected numbers shadedin the histograms on the right.
combination violates infinite alleles assumptions, it is remarkable how robust and generallyuseful this model is. However, as mutation rate increases, misalignment constraint increases the proportion of new mutants that are recurrent rather than unique. Consequently, VNTR diversity is reduced below the expectation of the infinite alleles model. For greatly constrained misalignment, such as slippage of single
repeats, diversity is best represented by the stepwise mutation model. This is very pertinent for studies of microsatellite VNTRs (VALDFS,SLATKIN and FREIMER 1992). Variable fit of VNTRs to the infinite alleles and stepwise mutation modelshasbeendescribed by DEKA,CHAKRABORTY and FERRELL (199 1). They explained these results by suggesting that there was more
Simulation of VNTR Population Genetics
919
(a) AlleleMaxinum Misalignment
40
30
No. 20 10 0
20000
@) Target-Maxinum Misalignment
lso00
lbooo
17000
18OOO
" 19ooo
Zoo00
20000
generations
(c) WindowMaxinurn Misalignment
20 ?
"
I
0.
'
lso00
17ooo 160oo
18OOO
19ooo
zoo00
generations
20000
(d) Single-Repeat Misalignment
IA
No.
40
"
x-x-x-x-x 15ooo
lbooo
18ooo 11ooo
19Ooo
zoo00
generations FIGURE4.-Allelic diversity for initial t9 = 72, with the same format as in Figure 3.
than one mechanism for the production of VNTR alleles with replication slippage sometimes being as important as USCE. Replication slippage occurs between the template DNA and newly synthesized sister chromatid strand and is likely to involve misalignments of single or few repeats. It is more likely to occur when therepeat sequences are small and is understood to be an important mechanism for mutation of microsatellite DNA. Replication slippage is of disputed importance for its role in mutation of minisatellite VNTRs.
20000
We suggest that constraint to misalignment of single or few repeats and unequal exchange at some stageof mitosis or meiosis is more likely than replication slippage to explain patternsof minisatellite VNTR diversity. T h e level of misalignment constraint may be due to some featureof chromosomal location such as patterns of sequence heterology or presence of specific recombinagenicsequences in VNTR flanking regions. If minisatellite VNTR diversity is generally the result of constrained USCE, it will be intermediate between the extremes represented by the infinite al-
Harding et al.
920
TABLE 2 Ewens-Watterson tests of the infinite alleles model for simulations of each misalignment rule at moderate mutation rates ~
No. of alleles
eexp
Gen 120,000
AM”
TM-M
WM-M
SR-M
4.5* 0.57 0.88 0.57 0.31 7.3* 10.6 12.6 5.3 2.3 7.4* 11.4 6.3 10.4 12.8 6.7* 7.6 6.7 6.2 6.7
obs
19 7 5 3 2 19 28 36 14 9 26 34 18 32 28 7 7 5 7 8
Inbreeding coefficient, F obsprob
16 10.2 2.1 6.5 1.3 25.6 31.9 45 20.2 18.4 48.8 31.4 13.7 38.5 20.3 8.2 14.5 13.1 22.3 19.7
0.23 0.35 0.84 0.49 0.96 0.13 0.1 0.07 0.18 0.19 0.06 0.1 0.26 0.08 0.17 0.41 0.25 0.27 0.16 0.18
Number of singletons
exp
obsprob
0.18 0.45 0.55 0.72 0.84 0.18 0.1 1 0.09 0.25 0.37 0.13 0.09 0.19 0.1 0.1 1 0.44 0.45 0.55 0.44 0.39
0.193 0.667 1.12 0.081 0.861 0.366 0.744 0.583 0.797 0.779 0.954 1.52 0.999 0.23 9.24 0.121 3.99 0.714 0.066 7.15 0.492 0.94 0.978 0.999 0.989
exp
4.28
4 2 0 0 0 6 5 9 2 2
0.69 0.34 0.14 4.28 7.16 10
2.83
2 6 5 9 9 0
6.47
8.59 1.1 1.13 0.69 1.1 1.36
0
0 0
0
0.443 0.078 0.531 0.315 0.142 0.094 0.766 0.575 0.544 0.192 0.984 0.874 0.168 0.337 0.137 0.7 1 1 0.693 0.558 0.704 0.79
~~
Frequency of commonest allele obs
exP
prob
0.4 0.47 0.92 0.55 0.98 0.22 0.24 0.17 0.26 0.26 0.1 1 0.26 0.43 0.22 0.36 0.6 0.34 0.44 0.22 0.25
0.32 0.59 0.67 0.8 0.89 0.31 0.23 0.19 0.39 0.52 0.25 0.2 0.32 0.21 0.23 0.58 0.59 0.67 0.57 0.54
0.204 0.695 0.073 0.885 0.342 0.816 0.371 0.563 0.869 0.967 0.996 0.152 0.157 0.379 0.066 0.422 0.948 0.906 0.999 0.993
The starred simulation in each set is that presented in Figure 3. TABLE 3 Ewens-Watterson tests of the infinite alleles model for simulations of each misalignment ruleat high mutation rates No. of alleles Gen 20,000
probe
exp
obsobs
Inbreeding coefficient, F
Number of singletons
exp
obs prob
exp
Frequency of commonest allele obs
exP
prob
~~
AM-M
TM-M
WM-M
SR-R
19* 49 0.04 65.1 0.06 9.1 22 33.1 0.1 0.9270.15 6.6 24.1 17 0.14 0.2 19 6.8 24.9 0.14 0.7230.18 15 6.4 27.8 0.120.98 0.23 141.2* 0.999 110 0.020.01 151.2 30.3 65.3 0.04 0.06 49 42.5 77 104.7 0.02 0.03 168.8 0.01 0.01 126 172.8 171.9 115 136.5 0.01 0.01 89 84.1* 119.5 0.020.01 0.01 0.02 147.4 129.8 112 0.04 0.08 21.5 40 62.4 0.04 0.04 34.9 66.4 62 110.2 0.01 0.02 99 129.5 70.3*0.9990.12 27 0.05 55.5 0.08 68.8 14 39 0.25 0.08 0.2 62.1 17 37.5 0.05 0.1 79.6 31 54.2 0.09 0.25 14 35.1 70.9
0.955
11
15.4 0.921 5.16 0.988 0.28 3.76 0.933 0.5640.35 0.82 4 4.34 0.457 0.37 0.21 0.8583.15 36 0.901 51.8 0.060.04 0.999 0.978 13 15.7 0.757 0.999 0.806 26 29.9 0.99964 51 0.996 0.996 47 55.4 0.965 0.999 30 37.1 0.952 0.999 46 53 0.931 0.889 0.995 8 11.8 0.574 0.286 23 21.6 0.851 0.999 39 43.7 2 0.9896.78 0 2.8 0.971 0.999 1 3.74 0.923 0.999 0.946 0.999 4 8.19 0.954 0 2.85 0.999 1 1
0.1 0.8340.14 0.2 0.31 0.3 0.4610.32
0.809
0.96 0.1 0.05 0.03 0.05 0.06 0.04 0.08 0.1 0.05 0.09 0.11 0.14 0.11 0.13
0.14 0.09 0.05 0.06 0.08 0.06 0.17 0.1 1 0.07 0.24 0.39 0.34 0.22 0.39
0.89 0.987 0.977 0.529 0.796 0.942 0.998 0.603 0.871 0.999 0.999 0.997 0.988 0.999
The starred simulation in each set is that presented in Figure 4.
leles and stepwise mutation models (JEFFREYS, WILSON and THEIN1985),perhaps in accordance with the multiple-step mutation model (CHAKRABORTY and NEI 1982; CHAKRABORTY et al. 1991). In the infinite alleles model, in the first generation at least, new mutant alleles exist at a frequency of 1/ N where N is the size of the haploid population. A number of rare alleles are characteristic of the infinite
alleles frequency spectrum. If VNTR alleles mutate by gain and loss of usually small numbers of repeats and thesizes of mutant alleles are size-correlated with their progenitors, it is evident that there will be recurrent mutation between exisiting allelic states. The numbers of alleles produced therefore will be fewer than expected by an infinite alleles model, and their frequency distribution will tend toward greater even-
92 1
Simulation of V N T R Population Genetics TABLE 4 Ewens-Watterson tests ofthe infinite alleles model for VNTRs sampled fromtwo Papua New Guinea populations No. of alleles
Inbreeding coefficient, F
Number of singletons
Frequency of commonest allele
Sample size (N)
obs
Highlands 304 119.287 MSl 44 MS31 306 PG3 0.9980.03 0.02 292 99.7 73 308 56.8 40 MS8 478 7 Insulin 7 HRAS 320 Coast 71 MSl 156 156 51.5 38 MS3 1 PG3 62 150 156 43 MS8 8 Insulin 158 7 HRAS 182
exp
exp
prob
68.6
0.01 0.04
0.02 0.06
0.999 0.998
22 8
35.8 13.1
0.998 0.94
0.04 0.09
0.08 0.16
0.999 0.985
19 9.9
0.05 0.21 0.36
0.07 0.46 0.44
0.976 0.989 0.645
17 12 0 2
27.6 11.5 1.03 1.09
0.996 0.355 0.688 0.069
0.06 0.09 0.3 0.52
0.09 0.17 0.6 0.58
0.898 0.983 0.983 0.582
27 9
37.9 14.3
0.05 0.1
0.07 0.15
0.939 0.853
16 0 0
17.2 1.54 1.29
0.998 0.969 0.982 0.9990.09 0.605 0.819 0.785
0.05 0.15 0.34 0.43
0.13 0.51 0.55
0.302 0.872 0.749
0.01 0.02 0.06 0.03 77.40.03 0.02 30.9 20 0.05 0.05 43.7 0.36 14.9 0.21 10.9 0.3 0.41 88.8
ness. Consequently, the relationship between heterozygosity and sampled numbers of alleles for VNTR loci will differ from that expected for neutral mutation-drift balance in an infinite alleles model. For the same heterozygosity there will be a smaller number of alleles. This makes the application of Ewens-Watterson sampling theory, assuming the infinite alleles and MORGAN1978), model, inappropriate (STROBECK the more so for large values of 13 (KIMURAand OHTA 1978). Rather, sampling theory based on a more appropriate model is essential. The characteristically smaller numbers of VNTR alleles compared with infinite alleles expectation have been explained as a technical problem in allele identification. Due to limitations in methodologies used both in the laboratory (gel electrophoresis) and for data analysis (binning), small and null alleles and alleles similar insize are not distinguished. However, this study indicates that lower numbers of alleles are observed than expected, assuming the infinite alleles model, because the expectation is wrong. We have shown that VNTR diversity is most probably generated by USCE under varying rules of misalignment constraint and that an appropriate analytical model based on the assumptions of this mutation process is required. Our analysis of simulated and Papua New Guinea VTNRdatademonstratesthatthe use of sampling theory based on the infinite alleles model may lead to erroneous conclusions. Analyses are now being completed to show the effects of population bottlenecks and structuring on patterns of VNTR diversity. We thank T . E. A. PETO,PAULMARJORAM,GEOFFA. WATTERPETERDONNELLY and BRUCEWAUH for discussions with us of VNTR simulation modeling. SON,
LITERATURECITED CHAKRABORTY, R., and S. DAIGER, 1991 Polymorphisms at VNTR loci suggest homogeneity of the white population of Utah. Hum. Biol. 63: 571-587.
0.999 0.991 0.999 0.393 0.933 0.757
obs exP expobs
prob
obs
prob
CHAKRABORTY, R., and L. JIN, 1992 Heterozygote deficiency, population substructure and their implications in DNA fingerprinting. Hum. Genet. 88: 267- 271. CHAKRABORTY, R., and M. NEI, 1982 Genetic differentiation of quantitative traits between populations or species. 1. Mutation and random genetic drift. Genet. Res. 39: 303-314. CHAKRABORTY, R., M. FORNAGE, R. GUEGUEN and E. BOERWINKLE, 1991 Population genetics of hypervariable loci:analysisof PCRbased VNTR polymorphism within a population, pp. 127-1 43 in DNA Fingerprinting: Approaches and Applications, edited by T. BURKE, G. DOLF,A. J. JEFFREYS and R. WOLFF. Birkhauser Verlag, Basel, Switzerland. CLARK, A. G . , 1987 Neutrality tests of highly polymorphic restriction fragment length polymorphisms. Am. J. Hum. Genet. 41: 948-956. DEKA,R., R. CHAKRABORTY and R.E. FERRELL, 1991 A population genetic study of six VNTR loci in three ethnically defined populations. Genomics 11: 83- 92. EWENS,W. J., 1972 The sampling theory ofselectively neutral alleles. Theor. Popul. Biol. 3: 87-1 12. EWENS,W., and J. GILLESPIE,1974 Some simulation results for the neutral allele model, with interpretations. Theor. Popul. Biol. 6 35-57. FLINT,J., A. J. BOYCE,J. J. MARTINSON and J. B. CLEGG, 1989 Population bottleneck inPolynesia revealed by minisatellites. Hum. Genet. 83: 257-263. GRAY,I. C., and A. J. JEFFREYS, 1991 Evolutionary transience of hypervariable minisatellites in man and the primates. Proc. R. SOC.Lond. B 243: 241-253. HARDING, R. M. 1992 VNTRs in review. Evol. Anthropol. 1: 6271. HARDING, R. M., A. J. BOYCEand J. B. CLEGG,1992 The evolution of tandemly repetitive DNA: recombination rules. Genetics 132: 847-859. JEFFREYS, A. J., V.WILSON and S. L. THEIN,1985 Hypervariable "minisatellite" regions in human DNA. Nature 314: 67-73. JEFFREYS,A. J., N. J. ROYLE, V. WILSON, and 2. WONG, 1988 Spontaneous mutation rates to new length alleles at tandem-repetitive hypervariable lociin human DNA. Nature 332: 278-281. KIMURA, M. 1983 The Neutral Theory of Molecular Evolution. Cambridge University Press, Cambridge. KIMURA,M., and T. OHTA, 1978 Stepwise mutation model and distribution of allelic frequencies in a finite population. Proc. Natl. Acad. Sci. USA 75: 2868-2872.
922
Harding et al.
NEI, M., 1987 Molecular Evolutionay Genetics. Columbia University Press, New York. PRESS,W. H., B. P. FLANNERY, S. A. TEUKOLSKY and W. T . 1986 NumericalRecipes.The Art of Scientijc VETTERLING, Computing. Cambridge University Press, Cambridge. STEPHAN, W., 1986 Recombination and the evolution of satellite DNA. Genet. Res. 47: 167-174. STEWART, F.M., 1977 Computer algorithm for obtaining a random set of allele frequencies for a locusin an equilibrium population, pp. 482-483 in Statistical studies on protein polymorphism in natural populations. I. Distribution of single locus heterozygosity, by P. A. FUERST, R. CHAKRABORTY and M. NEI Genetics 8 6 455-483. STROBECK, C., and K. MORGAN,1978 The effect of intragenic
recombination on the number of alleles in a finite population. Genetics 88: 829-844. TACHIDA,H., and M. IIZUKA,1992 Persistence of repeated sequences that evolve by replication slippage. Genetics 131: 471478. VALDES,A.M., M. SLATKINand N. B. FREIMER,1992 Allele frequencies at microsatellite loci: the stepwise mutation model revisited. Genetics 133: 737-749. WALSH, J. B. 1987 Persistence of tandem arrays: implications for satellite and simple-sequence DNAs. Genetics 115: 553-567. WATTERSON,G.A. 1978 The homozygosity test of neutrality. Genetics 88: 405-417. Communicating editor: W-H. LI