The current issue and full text archive of this journal is available on Emerald Insight at: www.emeraldinsight.com/0951-354X.htm
A conceptual framework for evaluating higher education institutions Ravi Chinta School of Advanced Studies, University of Phoenix, Cincinnati, Ohio, USA
Mansureh Kebritchi
Evaluating higher education institutions 989 Received 17 September 2015 Accepted 8 November 2015
School of Advanced Studies, University of Phoenix, Oviedo, Florida, USA, and
Janelle Ellias Department of Institutional Effectiveness, University of Phoenix, Tempe, Arizona, USA Abstract Purpose – Performance evaluation is a topic that has been researched and practiced extensively in business organizations but has received scant attention in higher education institutions. A review of literature revealed that context, input, process, product (CIPP) model is an appropriate performance evaluation model for higher education institutions. However, little guidance exists for choosing appropriate metrics and benchmarks in implementing the CIPP model. The purpose of this paper is to develop a framework using CIPP model for performance evaluation of higher education institutions. Design/methodology/approach – To achieve the purpose of the study, a review of literature was conducted to identify an appropriate evaluation model. Then metrics and benchmarks framework were formed based on practical approaches used in a large university in the USA. Findings – Nine perspectives in performance evaluation using the CIPP model and their application in higher education institutions were developed and discussed. The discussion provides examples, relative prevalence including frequency of usage, advantages and limitations of each of the nine perspectives of performance evaluation in higher education institutions. An actual application of the suggested CIPP model in the USA largest university, by student enrollment, was provided. Implications for institutional assessment and continuous improvement for higher education institutions were made. Originality/value – The study provides a practical framework, model and guidelines that can be used by higher education institutions to evaluate and enhance their performances and better prepare students to effectively work in society. Keywords Evaluation criteria, Benchmarks, Evaluation models, Higher education institution assessment, Performance metrics Paper type Conceptual paper
Introduction Higher education is becoming more competitive with heightened rivalry for student enrollments, more global due to technology advancement with increasing geographic scope, and more diverse with broader curricular scope. In addition, many evaluation models have been used to assess higher education institutions. Given such a changing landscape, performance management in higher education institutions has never been more fraught with diverse metrics. The idea of “What you measure is what you get” defines organizational citizen behaviors and becomes the basis for utilizing multiple metrics in performance management to ensure that organizations seek to achieve progress along multiple dimensions (Podsakoff et al., 2000). Several years ago, Kaplan and Norton (2005) introduced the concept of the balanced scorecard which, at that time, revolutionized conventional thinking about performance metrics. By going beyond
International Journal of Educational Management Vol. 30 No. 6, 2016 pp. 989-1002 © Emerald Group Publishing Limited 0951-354X DOI 10.1108/IJEM-09-2015-0120
IJEM 30,6
990
traditional measures of financial performance, the concept has given a generation of managers a better understanding of how their companies are really doing (El-Mashaleh et al., 2007). Balanced scorecard was made to measure business unit performance with four perspectives – financial, customer, internal business processes and learning and growth. The perspectives provide a balanced view of current and future of an organization operating performance. While the balanced scorecard provides a wide range of metrics to be used in the effective management of an enterprise, it provides little guidance on what benchmarks ought to be used in performance management. What one measures takes on meaning only in reference to the benchmarks that are used in drawing insights on what the measurements mean. Metric is a standard of measurement. Mere measurement, however, precise it is, does not tell you if you are doing well or poorly. Benchmarking is evaluating an action with a standard for comparison. Employee engagement is enhanced with greater shared understanding of the metrics used (Rich et al., 2010). “What benchmarks you use is what meaning you get” is the mantra used in this paper. We propose to examine both the metrics and benchmarks that are to be used in performance management for higher education institutions. While the college affordability and transparency center released a college scorecard in 2013, it remains underdeveloped because it focusses on external, vocational metrics (US Department of Education, 2013). We build on the concept of balanced scorecard in our metrics section and present three distinct sets of benchmarks that should be used in conjunction with three categories of metrics. The paper is organized as follows to build toward our conceptual framework. We first present the needs for metrics and benchmarks. We provide an overview about evaluation models in higher education institutions. We then present our conceptual framework as a nine-cell matrix comprised of three categories for metrics as one axis and three categories for benchmarks as the other axis. We then describe each of the nine cells with definitions, strengths, weaknesses and illustrative vignettes. We build on Kaplan and Norton’s (2005) notion of balance in performance management to offer a more comprehensive balanced scorecard for higher education institutions. We illustrate the use our suggested model at the world’s largest (by student enrollment) university. We conclude with implications for more effective and efficient management of higher education institutions. Why do we measure? Performance measurement is not an end in itself, but is part of a process that helps to guide our decisions and work methods in organizations. Performance metrics achieve specific managerial purposes by setting the goals for organizational work. Performance measures are of a wide variety and are used to evaluate, control, budget, motivate, promote, celebrate, learn and improve (Behn, 2003). Theories of rational planning suggest that organizational performance improves if targets for future achievements are set (Boyne and Chen, 2007). Performance measurement also leads to performance improvement (Kelman and Friedman, 2009). A typical application, which is pertinent to our paper, is in performance measurement where the intent is to understand the determinants of performance. That is, we measure to improve. Lastly, evaluation is becoming integrated in current organizational culture as an administrative routine at many levels and in many institutions (Dahler-Larsen, 2011). Evaluation is not only linked to performance improvement but also to social betterment and increased public awareness. Higher education institutions are required, per accrediting bodies, to “self-study” to assess their role in society as effective knowledge-transfer entities (Astin, 2012).
Evaluation models for higher education institutions There are many varieties of models and frameworks for evaluating higher education institutions. A review of literature revealed that the models are categorized based on various criteria including evaluation procedures and designs (Darwin, 2012; Guba and Lincoln, 1989), evaluation evaluators (Ramzan, 2015) and evaluation objectives (Stufflebeam and Shinkfield, 2007; Wang, 2009). Procedures and designs Evaluation models based on procedures and designs are categorized into two groups: standard and modern (Darwin, 2012; Guba and Lincoln, 1989). Standard evaluations are motivated by individual legitimacy, and heavily rely on quantitative data from students, and use deficit incidental method with remedial action plans. In comparison, modern or fourth generation of evaluation models are motivated by enhancing student learning, and mainly rely on wide-ranging qualitative data, and use developmental continuous method with program development action plans. The fourth-generation models emphasize situated evaluation practices where context of evaluation plays a major role in shaping evaluation process. An example of a standard evaluation model is quantitative student opinion surveys that are used in a number of countries including USA, UK and Australia (Darwin, 2012). However, student evaluation has shown to be fragile, unreliable and susceptible to various influences. In addition, there has been an increasing doubt about value of student rating as a means of objectively evaluating higher education institutions which are complex systems encompassing multiple stakeholders including learners, instructors and administrative. Students-based evaluation is considered narrow and superficial, and incomplete for enhancing academic quality of higher education institutions and addressing needs of increasingly diverse population of learners (Arthur 2009; Darwin, 2012; Kember et al., 2002). Consequently, alternative evaluation models have been emerged recently. Viewing evaluation as a socio-cultural process, and distinctly different from the standard evaluation model, new models shifted the basis to negotiated evaluations (Guba and Lincoln, 1989). Learning evaluation model grounded in constructivist and developmental motives has been used to evaluate Australian higher education institutions (Darwin, 2012). Evaluators Another group of evaluation models are evaluator oriented. One major example of evaluator-oriented models is the four stages model used by European higher education institutions. European higher education institutions had no consensus over an evaluation model used by quality agencies until 2000. Since establishment of Bologna accord and European Association for Quality Assurance in 2000, European higher education institutions have adopted and followed a four stage model of evaluation for quality insurance of their institutions (Ramzan, 2015). The four stages include a self-evaluation conducted by universities, site visit by an external peer review, writing report and publication by evaluation committee and quality agencies, and follow up visit by quality agencies. Many accrediting agencies in the USA also adopt the same process. It is notable that input, process, output are considered three principal factors in these evaluation systems. Objectives Evaluation models are also categorized based on their objectives into various groups such as pseudo evaluations, quasi-evaluation, accountability oriented evaluation,
Evaluating higher education institutions 991
IJEM 30,6
992
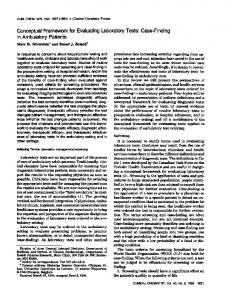
social agenda and advocacy and eclectic evaluation. Pseudo evaluations are mostly motivated by political objectives. Quasi evaluations focus on answering research questions with a clear research methodology and mostly include objective-based studies. Accountability oriented evaluations focus on examining merit of a program. Social advocacy oriented evaluations focus on assessing programs to pursue media for social justice. Eclectic evaluations focus on utilization and aim to serve needs of particular users (Stufflebeam and Shinkfield, 2007). There are other categories such as management-oriented, outcome-oriented and process-oriented evaluations (Wang, 2009). There are a number of models under each category. The objective of a model should match the needs of the institution for evaluation. The outcome-based approach is appropriate for organizations that are mostly interested in the results. The popular Kirkpatrick evaluation is a model for evaluating training with four components of reaction, learning, behavior and results. For evaluating a large scale educational system, there is a need for a more comprehensive model. The context, input, process, product (CIPP) is a management-oriented approach widely used in public schools and higher education institutions in USA and across the globe. CIPP includes context stage where evaluators identify environmental readiness and community needs, input suggests a project that address the needs identified in the context stage, process control and assess the project process, and product stage measures and judge project outcomes, worth and significance (Stufflebeam and Shinkfield, 2007). CIPP is one of the most popular evaluation models that implements social approaches in each of the four components. The goal of CIPP is “to improve” not “to prove” (Stufflebeam and Shinkfield, 2007) the issues within the organizations. CIPP is recommended as an appropriate evaluation model for assessing higher education institutions. However, metrics and benchmarks are a gap in the CIPP model. Our paper fills this gap. System view of higher education institutions Higher education is part of our society and thus is not immune to the influence of our culture. In our business-oriented way of life, most events are seen through the lens of manufacturing, even human processes that have nothing to do with producing products. For example, we have come to view and discuss higher education in terms of simple inputs and outcomes. A systems view of higher education institutions, depicted in Figure 1, shows that various inputs go into their systems (e.g. high-school graduates enter the system); several value-adding processes transform those inputs (e.g. learning processes) and outputs (e.g. educated students capable of pursuing careers and adding value in society) are finally generated from the systems. Evidently there are many more inputs, processes and outputs than shown above for a higher education institution, and that condition itself calls for use of several metrics in performance management for higher education institutions (Cave, 1997; Palomba and
Figure 1. Systems view of higher education institution
INPUTS Students Faculty Staff Resources
PROCESSES Curricular Programs Extra-curricular Programs Research Programs Service Programs
OUTPUTS Graduates Research Alumni Community
Banta, 1999). We contend, however, despite the extensive diversity of possible metrics, the categories of inputs, processes and outputs (Cave, 1997) provide adequate gestalts for performance management. Why do we compare? The need to compare our performance with “something” is well ingrained in each and all of us. By using a reference to compare with, we gain the knowledge that enables us to engage in “correction” of our actions/behaviors. “Correction” rings oddly in contemporary ears, for it hints at exalted standards and suggests that the few who know more or feel deeply might offer instruction and guidance to the many, and might improve organizations and society in the process. For example, organizational goals are set by “knowing” leaders in organizations before actions are undertaken. A strategy is defined as a goal-oriented action. These leaders ought to know what goals are appropriate at what time for their organizations. Goals define the metrics and benchmarks without which performance measurement becomes meaningless. Our paper contributes to developing choices for benchmarks that can be used in conjunction with metrics.
Evaluating higher education institutions 993
Performance metrics and benchmarks Our conceptual paper on metrics and benchmarks provides guidance for higher education leaders. Nine perspectives of performance evaluation are captured in a 3×3 matrix that forms the conceptual underpinning as shown in Table I. We assert that senior leaders will benefit from understanding the nine perspectives described in this paper to compare and appraise their current evaluative schemes. Internal or self-referencing Cells 1-3 shown in Table I fall under what we call a self-referencing mindset where one looks at performance evaluation over time. The most common example is examining this quarter’s performance with the performance in the same quarter last year. The focus is on historical benchmarks. We did this last year or five-years ago, and this is what we are doing now. External-referencing Cells 4-6 shown in Table I fall under what we call external-referencing mindset where one looks at performance evaluation relative to benchmarks that are outside the firm. The most common example is comparing our institution’s performance with that of our competitors or some peer group of outside firms or some industry norms/averages. Metrics Benchmark Input
Process
Output
Internal
Cell 2: Use of learning technologies (Laurillard, 2013) Cell 5: Use of learning technologies (Laurillard, 2013) Cell 8: Use of learning technologies (Laurillard, 2013)
Cell 3: Student learning outcomes (Zis et al., 2010) Cell 6: Student learning outcomes (Zis et al., 2010) Cell 9: Student learning outcomes (Zis et al., 2010)
Cell 1: Quality of college freshmen (Astin and Oseguera, 2004) External Cell 4: Quality of college freshmen (Astin and Oseguera, 2004) Aspirational Cell 7: Quality of college freshmen (Astin and Oseguera, 2004)
Table I. Metrics and benchmarks – a taxonomic view
IJEM 30,6
994
Aspirational-referencing Cells 7-9 shown in Table I fall under what we call aspirational-referencing mindset where one looks at performance evaluation relative to ideal achievement levels, which are essentially what our aspirations impel us to achieve. The most common example is comparing our firm’s performance with “stretch” goals that we want to ambitiously achieve as a firm. We achieved this level of performance; however, this is what we aspire to achieve. One needs to consider two premises, as the “is” and the “ought” of performance levels in aspirational-referencing. For higher education institutions, like business organizations, the reference for performance comparisons stems from the perspectives of various stakeholders. It is the leaders’ job to manage and shape stakeholder relationships to create optimum value and to manage the distribution of that value (Freeman, 1984; Jones, 1995; Walsh, 2005). Where stakeholder interests conflict, the executive must find a way to rethink problems so that the needs of a broad group of stakeholders are addressed, and to the extent this is done even more value may be created (Harrison et al., 2010). If tradeoffs have to be made, as sometimes happens, then executives must figure out how to make the tradeoffs, and then work on improving the tradeoffs for all sides (Freeman et al., 2007). Because of the large number of stakeholders, one could pigeonhole these multiple imperatives into the nine distinct referencing categories, as shown in our framework for metrics and benchmarks (see Table I). Input metrics Cells 1, 4 and 7 shown in Table I refer to input metrics for any system under consideration. In the case of higher education, input metrics could refer to any of the myriad inputs that enter the system of higher education. As an example, we have chosen the quality of college freshmen (Astin and Oseguera, 2004) as the performance metric to develop minimum threshold of performance for Cells 1, 4 and 7. Process metrics Cells 2, 5 and 8 shown in Table I refer to process metrics for any system under consideration. In the case of higher education, process metrics could refer to any of the myriad processes that are internal to the system of higher education under consideration. As an example, we have chosen the use of learning technologies (Laurillard, 2013) as the performance metric to develop minimum threshold of performance for Cells 2, 5 and 8. Output metrics Cells 3, 6 and 9 in Table I refer to output metrics for any system under consideration. In the case of higher education, output metrics could refer to any of the myriad outcomes from the system of higher education under consideration. As an example, we have chosen student learning outcomes (Zis et al., 2010) as the performance metric to develop minimum threshold of performance for Cells 3, 6 and 9. The nine cells in Table I provide a conceptual framework to anchor performance enhancement initiatives in higher education institutions. For example, finding jobs for graduating students has become a huge problem in some academic disciplines. Sweeney (2012) asked the question, “Can we overproduce a degree?” by referring to the New Faculty Majority’s National Summit in January 2012 where an administrator from the University of Cincinnati told the panel of speakers that she would like to see the summit address “the 850-pound gorilla in the room,” which is the overproduction of PhDs.
When compared to the demand ( jobs) for PhDs (external-referencing), there is one view of the problem. However, Sweeney (2012) suggested that people get PhDs. because they are in love with their chosen areas of study (internal-referencing). Nine different and specific contexts are presented in Table II to illustrate the correct choices for metrics and benchmarks is highly context specific for higher education institutions. Incorrect choices lead to considerable confusion and wasted efforts in performance improvement initiatives.
Evaluating higher education institutions 995
Implications of taxonomic view of performance Higher education institutions, much like business organizations, that serve the interests of multiple stakeholders enjoy higher performance levels (Preston and Sapienza, 1990; Sisodia et al., 2007), superior reputation (Fombrun and Shanley, 1990), greater research productivity (Herrington et al., 2014) and enhanced organizational performance (Greenley and Foxall, 1997). Perhaps the strongest economic
Specific measure Cell 1 Average SAT and ACT scores Cell 2 No. of courses using web technologies Cell 3 ETS test scores for business students Cell 4 Average SAT and ACT scores Cell 5 No. of courses using web technologies Cell 6 ETS test scores for business students Cell 7 Average SAT and ACT scores
Purpose
Medium (usually prevalent at smaller institutions) Low (web technologies not mandatory)
Limitations
Where most frequently used
Historically rooted
For college rankings
Quality of freshmen (Astin and Oseguera, 2004) Learning technologies’ use (Laurillard, 2013) Student learning outcomes (Zis et al., 2010)
In-house IT resource limitations Rare (infrequently done Sporadic and infrequently at non-accredited done schools)
Quality of college freshmen (Astin and Oseguera, 2004) Use of learning technologies (Laurillard, 2013)
Medium (competitive advantage to increase student enrollments) High (process improvement initiatives)
Competitive comparisons for advertising Sustaining improvement is limitation
Student learning outcomes (Zis et al., 2010)
Medium (competitive advantage to increase student enrollments)
Variety of ranking measures
High (when online Quality of college offerings dominate) freshmen (Astin and Oseguera, 2004)
Cell 8 No. of courses Use of learning technologies using web technologies (Laurillard, 2013) Cell 9 ETS test scores for business students
Frequency of usage (non-empirical estimation)
Student learning outcomes (Zis et al., 2010)
Sporadic nature of use of this benchmark Rare (dynamic changes Lock-up in online technologies) periods with vendors Medium (competitive advantage to increase student enrollments)
Variety of ranking measures
For student retention Small and regional colleges For competitive strategies Part of the annual planning processes Selected metrics are advantageous Planning for increased student enrollments Universities embracing online technologies Selected metrics are advantageous
Table II. Illustrative comparison of Table I cells
IJEM 30,6
996
justification to date is found in a study by Choi and Wang (2009) who found not only that firms with good stakeholder relations enjoyed superior financial performance over a longer period of time, but also poorly performing firms with good stakeholder relations improved their performance more quickly. In a similar vein, we can expect higher education institutions with good stakeholder relations to be effective and efficient organizations. The broader evaluative framework offered in this paper would enable higher education institutions to address multiple stakeholders more comprehensively. We have provided a conceptual metrics and benchmarks model for performance management that we believe is more comprehensive and richer than frameworks that are based on diverse metrics alone. Whenever people are likely to think about performance management, metrics and benchmarks both become relevant and important. Our conceptual metrics and benchmarks model has several direct implications for practitioners, academic researchers, design consultants and higher education institution leaders. First, we broaden the scope of performance measurement from mere diverse metrics (e.g. a dashboard of metrics such as balanced scorecard that addresses multiple stakeholder needs) to include diverse benchmarks as discussed in Table I. Our contention is that the interaction between metrics and benchmarks provides the needed guidance required for performance enhancement. Second, to ensure that the conceptual model is rooted in reality, future research should be focussed on validating it in diverse contexts. Third, by thinking through the nine perspectives the senior management of higher education institutions can imagine their evolutionary growth trajectories into the future, much like jumping from one square to the next over time in Table I. Finally, by better understanding the need for a broader scope for the balanced scorecard, organizational design consultants and higher education institution leaders could develop appropriate dashboard for higher education institutions. Application to one higher education institution With over 230,000 students enrolled, in at least one measure, the University of Phoenix is the largest university in the world. Table III is an example of how the metrics and benchmarks model can help identify the institution’s shared key performance indicators. Similar KPI frameworks have been proposed in higher education to guide decision-making and performance improvement, and these models should always be reflective of the institution’s mission and values (Suryadi, 2007). Applying the nine perspectives of performance evaluation creates a comprehensive approach wherein the institution must first identify and then begin to reconcile diverse, and sometimes competing, stakeholder interests. This act of institutional self-evaluation promotes aspirational-referencing behaviors. As a for-profit higher education institution, the university has several output metrics prescribed by the US Department of Education. Most notably, the amended Higher Education Act (HEA) of 1965 requires every for-profit institution to attain no more than 90 percent of its revenue from the Title IV Federal Student Aid program; this is commonly referred to as the “90/10 rule.” Additionally, Gainful Employment Regulations require for-profit institutions to publish the total cost and employment outcomes of every program offering (US Department of Education, 2014). While these metrics are intended to protect students from burdensome debt loads and mitigate loan default rates, these regulations promote the commodification and consumerism of higher education by demanding a tangible return on investment, or external-referencing benchmark, for stakeholders. For example,
Metrics Benchmark
Input
Process
Output
Internalreferencing
Cell 1: student demographics non-traditional student risk factors No. of incoming transfer credits YoY enrollment trends qualified faculty
Cell 2: Pathways diagnostic assessment First year courses Fourth-course pass rate No. of full-time faculty Career-relevant curriculum End of course surveys Net promoter score Course and program SLO assessment Research center publications Cell 5: Financial aid calculator; responsible borrowing programs Career services usage scholarships
Cell 3: Retention and graduation outcomes Student learning outcomes Career and employment outcomes Research
Externalreferencing
Aspirationalreferencing
Cell 4: Non-traditional student risk factors Employment status 90/10 rule Cost/credit hour Cell 7: Access Affordability Career-relevant program offerings
Evaluating higher education institutions 997
Cell 6: IPEDS graduation rate Gainful employment regulations Three-year cohort default rate Cell 9: Cell 8: Retention and graduation Financial aid calculator; responsible borrowing programs outcomes (i.e. IPEDS graduation rate) Scholarships Pathways diagnostic assessment Student learning outcomes (i.e. ETS proficiency profile; First year courses AACU VALUE rubrics) Fourth-course pass rate Career and employment No. of full-time faculty outcomes Career-relevant curriculum (i.e. Gainful Employment End of course surveys Regulations) Net promoter score Table III. Three-year cohort Course and program SLO Nine perspectives on default rate assessment “Metrics and Research and scholarship Career services usage Benchmarks” applied outcomes Research center publications at the university
the college scorecard narrowly focusses on five performance metrics: costs, graduation rate, loan default rate, median borrowing and employment (US Department of Education, 2013). Tying these external metrics to eligibility for Title IV Federal Student Aid places greater emphasis on these externally defined performance metrics. The university must comply with the HEA of 1965 and participate in annual research conducted by the US Department’s National Center for Education Statistics. This requires the publication of comparative data regarding graduation and retention rates through the Integrated Postsecondary Education Data System (IPEDS). One issue with the IPEDS calculation is for first-time students with 0 transfer credits. This conceptual framework is most valuable when applied to the organization’s multiple stakeholders rather than focussing solely on one stakeholder group. Table III illustrates internally defined metrics that are unique to the university’s mission and study demographic and juxtaposes the various externally defined metrics to begin to define a cumulative approach of aspirational-referencing metrics.
IJEM 30,6
998
Internal (self-referencing) metrics Research has suggested that first generation students have lower retention rate as compared to other students. The attrition risk rate in first year for first generation students was reported 71 percent higher than their peers with two college-educated parents (Ishitani, 2003, p. 433). Using the definition of non-traditional students by National Center for Education Statistics (2002), the university monitors a number of demographic factors for the incoming non-traditional student, to provide appropriate student support services. Examples of these programs include a pathways diagnostic assessment that promotes student alignment to the most appropriate first year course sequence. Additionally, the university has identified a statistical significance to its fourth-course pass rate, finding that students who complete four courses in the first six months of their first year will be more likely to persist in the program. The university has enhanced its curriculum and full-time faculty in this critical first year. Each course is measured in multiple ways, including student and faculty end of course surveys as well as net promoter scores, which measure student satisfaction and likelihood to recommend the university. Finally, the institution internally measures student learning outcomes at the course, program and institutional levels. Cumulatively, these in-process metrics become insightful data points that may be used to influence student learning outcomes, retention and graduation outcomes, and career and employment outcomes. External-referencing metrics Externally referenced metrics compare the university’s performance against external norms, established benchmarks, and peer groups, primarily other for-profit higher education institutions. In addition to comparing its incoming student population to peer institutions, the university is responsible to adhere to the 90/10 Rule, meaning that not more than 90 percent of its revenue can come from Title IV Student Financial Aid funds. The university has implemented an up-front financial aid calculator that helps new students understand the need for responsible borrowing. Additionally, the university implemented financial wellness programs and exit counseling to help students understand their financial obligations. These programs suggest students may borrow less than the full amount available because they are better informed on the financial implications of repaying a Title IV Student Loan. These in-process metrics help the university monitor and influence its three-year cohort default rate, which is calculated by the percentage of students who enter loan repayment during a federal fiscal year and default on loan payments. Aspirational-referencing metrics A forward-looking university is driven by strong aspirations to achieve excellence in all its organizational activities related to operational excellence (continuous process improvements in all its operations), product innovation (market-relevant curriculum that is dynamically updated to meet the needs in the society which provides jobs for students) and customer intimacy (proactive understanding of the trends in the global education industry). As the university sets forward-facing achievement metrics, it focusses on the synthesis of internal- and external-referencing metrics that promote access, affordability, career relevancy and student outcomes. Output metrics will continue to gain specificity in each area where comparative data are available, increasing the university’s ability to set targets for future performance excellence.
Discussion and conclusion The CIPP model is an appropriate macro-evaluation model for higher education institutions. However, metrics and benchmarks are not adequately addressed in CIPP model. Our paper fulfills this gap with nine perspectives on metrics and benchmarks conceptualized, illustrated and applied in this paper. We believe that assessing the performance of a higher education institution from input-process-output view provides a good basis for measurement. Juxtaposing this input-process-output view with the internal-external-aspirational view adds the benchmarking step that leads to action initiatives that would help the institution to continuously improve. Thus, we believe that the nine perspectives, taken together, move higher education institutions from mere analysis of past performance to the development of future strategies. For example, areas where measured performance is below or on par with a particular benchmark are targeted for immediate corrective action to improve performance. Higher education institutions are complex entities much like firms in the corporate world. Multiple stakeholders and multiple goals need to be dealt within a balanced manner. Balanced scorecard (Kaplan and Norton, 2001, 2007) is widely used as a dashboard of metrics with benchmarks by corporate CEOs to manage the complex task of managing the business along many performance dimensions/metrics. Our paper translated the balanced scorecard philosophy into a practical framework for ready use by higher education institutions. We believe that if more higher education institutions develop their own context-specific matrix as illustrated in Table III above for the university, such self-analysis will lead to KAIZEN (Paul Brunet and New, 2003) which is an unending journey of continuous improvement for them. KAIZEN is a Japanese term for continuous improvement made famous by Toyota manufacturing processes. To be specific, for a given metric for a particular higher education institution, comparison to an external benchmark (e.g. competitors) may provide a sense of complacency for the institution, but the same metric when compared to an aspirational benchmark would provide the necessary grist for further performance improvement initiatives. Our paper contributes to inspiring KAIZEN (an unending quest for improvement) in higher education institutions. We also believe that our paper provides guidance for contemplative strategic thinking about evolutionary growth trajectory for any higher education institution. References Arthur, L. (2009), “From performativity to professionalism: lecturers’ responses to student feedback”, Teaching in Higher Education, Vol. 14 No. 4, pp. 441-454. Astin, A.W. (2012), Assessment for Excellence: The Philosophy and Practice of Assessment and Evaluation in Higher Education, Rowman & Littlefield Publishers, Lanham, MD. Astin, A.W. and Oseguera, L. (2004), “The declining ‘equity’ of American higher education”, The Review of Higher Education, Vol. 27 No. 3, pp. 321-341. Behn, R.D. (2003), “Why measure performance? Different purposes require different measures”, Public Administration Review, Vol. 63 No. 5, pp. 586-606. Boyne, G.A. and Chen, A.A. (2007), “Performance targets and public service improvement”, Journal of Public Administration Research and Theory, Vol. 17 No. 3, pp. 455-477. Cave, M. (Ed.) (1997), The Use of Performance Indicators in Higher Education: The Challenge of the Quality Movement, Jessica Kingsley Publishers, Philadelphia, PA. Choi, J. and Wang, H. (2009), “Stakeholder relations and the persistence of corporate financial performance”, Strategic Management Journal, Vol. 30 No. 8, pp. 895-907.
Evaluating higher education institutions 999
IJEM 30,6
1000
Dahler-Larsen, P. (2011), The Evaluation Society, Stanford University Press, Redwood City, CA. Darwin, S. (2012), “Moving beyond face value: re-envisioning higher education evaluation as a generator of professional knowledge”, Assessment & Evaluation in Higher Education, Vol. 37 No. 6, pp. 733-745. El-Mashaleh, M.S., Edward Minchin, R. Jr and O’Brien, W.J. (2007), “Management of construction firm performance using benchmarking”, Journal of Management in Engineering, Vol. 23 No. 1, pp. 10-17. Fombrun, C. and Shanley, M. (1990), “What’s in a name? Reputation building and corporate strategy”, Academy of Management Journal, Vol. 33 No. 2, pp. 233-258. Freeman, R.E. (1984), Strategic Management: A Stakeholder Approach, Pitman, Boston, MA. Freeman, R.E., Harrison, J. and Wicks, A. (2007), Managing for Stakeholders: Business in the 21st Century, Yale University Press, New Haven, CT. Greenley, G.E. and Foxall, G.R. (1997), “Multiple stakeholder orientation in UK companies and the implications for company performance”, Journal of Management Studies, Vol. 34 No. 2, pp. 259-284. Guba, E. and Lincoln, Y. (1989), Fourth Generation Evaluation, Sage, Harvey, IL and Newbury Park, CA. Harrison, J.S., Bosse, D.A. and Phillips, R.A. (2010), “Managing for stakeholders, stakeholder utility functions and competitive advantage”, Strategic Management Journal, Vol. 31 No. 1, pp. 58-74. Herrington, J., Reeves, T.C. and Oliver, R. (2014), Authentic Learning Environments, Springer, New York, NY. Ishitani, T.T. (2003), “A longitudinal approach to assessing attrition behavior among first-generation students: time-varying effects of pre-college characteristics”, Research in Higher Education, Vol. 44 No. 4, pp. 433-449. Jones, T.M. (1995), “Instrumental stakeholder theory: a synthesis of ethics and economics”, Academy of Management Review, Vol. 20, pp. 404-437. Kaplan, R.S. and Norton, D.P. (2001), “Transforming the balanced scorecard from performance measurement to strategic management: part II”, Accounting Horizons, Vol. 15 No. 2, pp. 147-160. Kaplan, R.S. and Norton, D.P. (2005), “The balanced score card: measures that drive performance”, Harvard Business Review, Vol. 8 No. 3, pp. 174-180. Kaplan, R.S. and Norton, D.P. (2007), “Using balanced score card as a strategic management system”, Harvard Business Review, Vol. 87 Nos 7-8, pp. 150-161. Kelman, S. and Friedman, J.N. (2009), “Performance improvement and performance dysfunction: an empirical examination of distortionary impacts of the emergency room wait-time target in the English National Health Service”, Journal of Public Administration Research and Theory, Vol. 19 No. 4, pp. 917-946. Kember, D., Leung, Y.P. and Kwan, K.P. (2002), “Does the use of student feedback questionnaires improve the overall quality of teaching?”, Assessment & Evaluation in Higher Education, Vol. 27 No. 5, pp. 411-425. Laurillard, D. (2013), Rethinking University Teaching: A Conversational Framework for the Effective Use of Learning Technologies, Routledge, Abingdon. National Center for Education Statistics (2002), “Nontraditional undergraduates”, available at: https://nces.ed.gov/pubs2002/2002012.pdf (accessed August 3, 2015). Palomba, C.A. and Banta, T.W. (1999), Assessment Essentials: Planning, Implementing, and Improving Assessment in Higher Education, Higher and Adult Education Series, Jossey-Bass, Inc., San Francisco, CA.
Paul Brunet, A. and New, S. (2003), “Kaizen in Japan: an empirical study”, International Journal of Operations & Production Management, Vol. 23 No. 12, pp. 1426-1446. Podsakoff, P.M., MacKenzie, S.B., Paine, J.B. and Bachrach, D.G. (2000), “Organizational citizenship behaviors: a critical review of the theoretical and empirical literature and suggestions for future research”, Journal of Management, Vol. 26 No. 3, pp. 513-563. Preston, L.E. and Sapienza, H.J. (1990), “Stakeholder management and corporate performance”, Journal of Behavioral Economics, Vol. 19 No. 4, pp. 361-375. Ramzan, M. (2015), “University evaluation: an important indicator towards quality in higher education”, Journal of Research in Social Sciences, Vol. 3 No. 1, pp. 48-60. Rich, B.L., Lepine, J.A. and Crawford, E.R. (2010), “Job engagement: antecedents and effects on job performance”, Academy of Management Journal, Vol. 53 No. 3, pp. 617-635. Sisodia, R., Wolfe, D.B. and Sheth, J. (2007), Firms of Endearment: How World-Class Companies Profit from Passion and Purpose, Wharton School, Upper Saddle River, NJ. Stufflebeam, D.L. and Shinkfield, A.J. (2007), Evaluation Theory, Models, & Applications, Jossey-Bass, San Francisco, CA. Suryadi, K. (2007), “Framework of measuring key performance indicators for decision support in higher education institution”, Journal of Applied Sciences Research, Vol. 3 No. 12, pp. 1689-1695. Sweeney, I. (2012), “Can we overproduce a degree?”, The Chronicle of Higher Education, March 16, p. A49. US Department of Education (2013), “College affordability and transparency center college scorecard”, available at: www.whitehouse.gov/issues/education/higher-education/ college-score-card (accessed August 10, 2015). US Department of Education (2014), “Obama administration announced final rules to protect students from poor-performing career college programs”, available at: www.ed.gov/ news/press-releases/obama-administration-announces-final-rules-protect-students-poorperforming-career-college-programs Walsh, J.P. (2005), “Taking stock of stakeholder management”, Academy of Management Review, Vol. 30 No. 2, pp. 426-438. Wang, V.C.X. (2009), Assessing and Evaluating Adult Learning in Career and Technical Education, University Press, Zhejiang. Zis, S., Boeke, M. and Ewell, P. (2010), State Policies on the Assessment of Student Learning Outcomes: Results of a Fifty-State Inventory, National Center for Higher Education Management Systems, Boulder, CO. Further reading Stufflebeam, D.L. (2003), “The CIPP model for evaluation”, in Stufflebeam, D.L. and Kellaghan, T. (Eds), The International Handbook of Educational Evaluation, Chapter 2, Kluwer Academic Publishers, Boston, MA, pp. 31-62. About the authors Ravi Chinta, PhD, is currently the University Research Chair, School of Advanced Studies, University of Phoenix. Ravi has 36 years of work experience (14 in academia and 22 in industry). Ravi worked in venture-capital start-ups and large multi-billion global firms such as IBM; Reed-Elsevier; LexisNexis; and Hillenbrand Industries. Ravi has 47 peer-reviewed publications in journals such as Academy of Management Executive, Journal of Small Business Management, Long Range Planning, Management Research News, Journal of Technology Management in China, International Journal of Strategic Business Alliances and International Journal of Business and Globalization.
Evaluating higher education institutions 1001
IJEM 30,6
1002
Dr Mansureh Kebritchi is a Founder and Chair of the Center for Educational and Instructional Technology Research at the School of Advanced Studies, University of Phoenix. She has years of experience as Faculty Member and Researcher in the field of educational technology. Dr Kebritchi’s research interest focusses on improving quality of teaching and learning and evaluation models in higher education institutions. The results of her research have been published in international journals. Dr Mansureh Kebritchi is the corresponding author and can be contacted at:
[email protected] Janelle Ellias is the Accreditation Project Director at the University of Phoenix. She is interested in investigating evaluation criteria for assessing performance of higher education institutions.
For instructions on how to order reprints of this article, please visit our website: www.emeraldgrouppublishing.com/licensing/reprints.htm Or contact us for further details:
[email protected]