American Journal of Roentgenology. (American Roentgen Ray Society) 171(5) (Nov 1998). 4. Bae, K., Kim, J.S., Na, Y.H., Kim, K., Kim, J.H.: Pulmonary nodules: ...
A Discriminative-Generative Model for Detecting Intravenous Contrast in CT Images A. Criminisi, K. Juluru, and S. Pathak 1
3
Microsoft Research Ltd, CB3 0FB, Cambridge, UK 2 Weill Cornell Medical College, New York, NY Microsoft Corporation, One Microsoft Way, Redmond, US
Abstract. This paper presents an algorithm for the automatic detection of intravenous contrast in CT scans. This is useful e.g. for quality control, given the unreliability of the existing DICOM contrast metadata. The algorithm is based on a hybrid discriminative-generative probabilistic model. A discriminative detector localizes enhancing regions of interest in the scan. Then a generative classifier optimally fuses evidence gathered from those regions into an efficient, probabilistic prediction. The main contribution is in the generative part. It assigns optimal weights to the detected organs based on their learned degree of enhancement under contrast material. The model is robust with respect to missing organs, patients geometry, pathology and settings. Validation is performed on a database of 400 highly variable patients CT scans. Results indicate detection accuracy greater than 91% at ∼ 1 second per scan.
1
Introduction
Medical images stored in the DICOM standard contain a wealth of associated metadata. Many metadata elements are acquired automatically, e.g. the slice thickness. Others (e.g. the anatomical region being scanned) require human input at the time of acquisition. However, manual input is prone to error [1]. Accuracy of DICOM metadata is important in routine clinical care, where those tags are used to ensure that the requested imaging service has in fact been performed. Metadata accuracy is also crucial in clinical research, e.g. in trials where the effectiveness of a drug is monitored using imaging. This paper presents an algorithm for the automatic detection of intravenous contrast. Its corresponding DICOM tag (id (0018, 0010), one of the key metadata) requires manual input during image acquisition. However, in our experience only ∼ 80% of CT studies present the correct value (see also [1]). Such accuracy is operator and hospital dependent. The unreliability of this tag means that the only way to know whether there is contrast in a scan is through visual inspection. Our technique alleviates this problem by automatically classifying CT scans as contrast-enhanced or not. In [2] Prince et al looked at detection of contrast material arrival in the aorta. However, manual intervention was required to select regions of interest. Similarly in [3]. Such work would benefit greatly from our technique as it removes the need for any manual input.
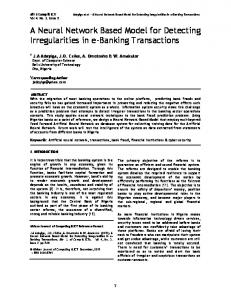
Fig. 1. Variability in our 400-patient database. (a, c, e, f, h) Patient scans with i.v. contrast. (b, d, g) No i.v. contrast. (a, d) Additional oral contrast. (a) Scan with missing left lung. (c) Kidney cyst. (d) Transplanted kidney. (f ) Aortic aneurism.
Effective automatic detection of contrast material does require some level of localization of relevant regions (e.g. organs which enhance in the presence of i.v. contrast agents). Thus, techniques for anatomy segmentation in CT could be beneficial for such purposes. Many such algorithms have been proposed, e.g. [4–8]. However, the majority tend to focus on a single area of the body, or are specific to a certain disease and sometimes still rely on human intervention. Also, none of these have been used for verification of DICOM metadata accuracy. The algorithm proposed here automatically detects multiple enhancing regions of interests and combines the gathered evidence optimally to produce accurate contrast detection. It works on completely generic, pathology-rich CT scans. Outline. Our algorithm is in two stages: I) first, major anatomical structures are automatically localized; II) then, contrast detection is achieved via a generative model of CT scans. The main novelty is in the second part which optimally fuses evidence from detected organs for robust contrast detection.
2
The annotated database
We have collected a database of 400 diverse patients CT scans (see fig. 1). The patients suffer from various pathologies and the scans have been acquired with different scanners, at varying resolutions, viewing different body regions. The data comes from hospitals in different continents. All studies are expert labeled into belonging to the “contrast-enhanced” (C) or “native” (N) classes. If only oral contrast is present (and no i.v. contrast) then the scan is labeled as N. As detailed in section 5 the database is divided into many non-overlapping training and test sets. Parameters are optimized on the training set and all accuracy measurements performed on the previously unseen test set, to avoid over-fitting.
3
Stage I - Discriminative anatomy localization
Our algorithm for the automatic localization of anatomy in CT builds upon the work in [9] and is summarized here for completeness. A regression forest is used
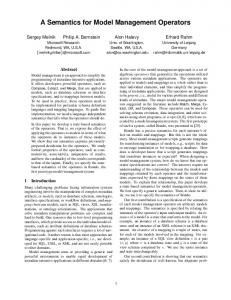
Fig. 2. Results of discriminative anatomy localization. Automatic anatomy detection in diverse patients’ CT scans. The detected organs (e.g. heart, kidney, liver, lung) are shown in red. The faint blue line denotes ground truth. The detections are robust to large variabilities in the scans, including pathologies. E.g. (b) Large cyst in abdomen. (h, k) Missing left lung. (d, e, f, g) Cysts and other kidney anomalies.
to map CT voxels directly to organs position and extent. We build upon a forest technique because of its efficiency and robustness. The forest is trained to localize the following 12 structures: heart, liver, spleen, lungs, kidneys, gall bladder, pelvis, femurs. The trees are trained on a set of volumes with known organ bounding boxes. The trees cluster voxels together based on their appearance, their spatial context and their confidence in predicting position and size of all anatomical structures. During testing, all voxels are pushed into all trees. Each node applies a test on each voxel which consequently is sent to the left or right child. When a voxel reaches a leaf node the stored relative displacements are used to cast a vote on position and extent of each organ. The leaves with largest prediction confidence carry more weight in the final prediction. See [9] for further details. Figure 2 shows some detection results. Good anatomy localization is achieved even in the presence of pathologies such as cysts or missing lungs. Our C++ implementation produces a mean localization error of ∼ 1.5cm in approximately 1s on a single-core desktop machine. Next we describe how information coming from all detected organs is fused together to yield accurate contrast detection.
4
Stage II - Generative contrast/no-contrast classification
This section describes the main contribution of this paper, i.e. a new, partbased generative model of CT scans and its use for contrast detection. Given a previously unseen 3D CT image, the goal is that of estimating its class c, with c ∈ {C, N}. Here we also assume given the position of organs of interest together with the associated confidence (as described in section 3).
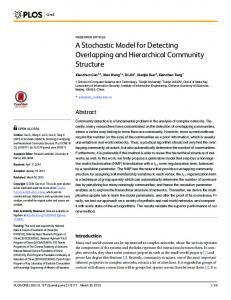
Fig. 3. Our generative model. (a) Graphical representation of our probabilistic model. (b) As in (a) but represented with plates. See text for details.
The probabilistic model. Evidence coming from detected anatomical regions is aggregated via the graphical model shown in fig. 3. The probability of class c is what we wish to estimate. The variable si denotes the appearance of the ith anatomical structure. In a given image, the organ appearance si is represented as a histogram over density values (in HU). The histogram is computed over all voxels within the organ’s bounding box and is normalized to have unit area. Handling visibility. In a given scan some organs may be absent (e.g. because missing or outside the capture area). Their status is captured by the binary visibility variable oi ∈ {0, 1}, with 0, 1 denoting absence/presence, respectively. For the organ i we set oi = 0 if the organ detection posterior falls below 0.5, as in [9]. From fig. 3 the joint probability of the whole model is p(c, S, O) = p(c)
N Y
p(si |oi , c)p(oi )
(1)
i
with N = 12 the total number of organs, S = {s1 , · · · , sN } and O = {o1 , · · · , oN }. Model training. The data likelihood p(si |oi = 1, c) is modeled as a multivariate Gaussian: p(si |oi = 1, c) = N (si ; si c , Λci ), with si the mean and Λi the covariance matrix. Since c assumes binary values we need to learn two likelihood models for each organ. This is done readily from annotated training studies. Figure 4 shows such likelihoods for some selected organ classes, learned from 200 training scans. We observe that the appearance of bony structures (e.g. the pelvis) is not affected by i.v. contrast. This is shown by the fact that p(s|c = C) ≈ p(s|c = N) (visibility variable o removed here for simplicity). Instead, for organs such as the heart or kidneys (enhancing) the automatically learned likelihood models are very different in the two cases. This is not surprising, but what is important here is that our model captures such differences quantitatively. To obtain accurate contrast detection we wish to give more weight to those organs which enhance more in the presence of i.v. contrast, and vice-versa. But what are the right weights to use? Additionally, the appearance of some structures changes considerably across different patients while others show more consistency. Thus, uncertainty must be taken into account for the final contrast classification. Our generative model captures all these intuitions quantitatively and provides a way of assigning optimal weights to the different organs, automatically.
Fig. 4. Learned likelihood models. The learned likelihoods p(si |c = C) and p(si |c = N) for 8 organs are shown in green and red, respectively (visibility variables removed for simplicity). The two learned models are more different from one another in those organs that tend to enhance in the presence of i.v. contrast. Our algorithm assigns optimal weights (e.g. higher for heart and lower for femur) for final contrast detection.
Contrast detection. The next step is to combine image observations and learned models and come up with a single contrast/no-contrast answer. During testing we are given a previously unseen scan, its detected bounding boxes, their associated appearance observations si and also the visibility observations oi for all organs. Bayesian manipulation of (1) leads to the class posterior i QN P1 h QN 1 p(c|S, O) = Z p(c) i p(si |oi , c)p(oi ), with Z = c=0 p(c) i p(si |oi , c)p(oi ) . So, the ratio of the class posteriors for the two cases is N
R=
p(c = C) Y p(si |oi , c = C)p(oi ) p(c = C|S, O) = p(c = N|S, O) p(c = N) i p(si |oi , c = N)p(oi )
(2)
with the priors p(c = C) and p(c = N) learned from the training set. If a structure i is not present (oi = 0) then its appearance si is undefined and so is the likelihood p(si |oi = 0, c). Thus we need to remove its influence from (2). We do so by defining p(si |oi , c) = p(si |oi = 1, c)oi which reduces to 1 for undetected structures. This when plugged into (2) has the desired effect. Thus the posterior ratio reduces to N
R=
p(c = C) Y p(c = N) i
�
p(si |oi = 1, c = C) p(si |oi = 1, c = N)
�oi (3)
Finally, maximum a-posteriori estimation (MAP) happens by checking the value of R in (3). If R > 1 then the scan is declared to be contrast-enhanced, and viceversa. Values of R close to 1 indicate uncertain output.
Fig. 5. Testing individual organ likelihoods for two previously unseen CT images. The learned likelihood models p(si |oi = 1, c = C) and p(si |oi = 1, c = N) for four different anatomical structures are shown in green and red, respectively. The appearance descriptor si for the same organs in the input test scans are shown in black. (a) In the case of a contrast-enhanced image the organ appearances are better predicted by the contrasted likelihood models (black curve closer to the green models), (b) and vice-versa in the case of native CT scans. Such likelihoods are combined with prior probabilities in (3) to produce maximum a-posteriori classification.
In our model robustness to pathology arises from: i) having those anomalies in the training set, and ii) aggregating evidence over multiple organs. A small number of such organs may exhibit unusual shape or appearance, but other healthy structures would contribute positively towards the final outcome.
5
Experiments, results and comparisons
This section presents evaluations and comparisons with possible alternatives. Figure 5 shows the learned likelihood models for various organs of interest and, for two test scans, the individual organ appearances si . Note how organ appearance in contrast-enhanced scans is better explained by contrast-enhanced likelihood models, and vice-versa. This holds true for enhancing organs and does not for bony structures (whose black curve is equally close to both models). When evaluating the posterior ratio (3) we see that each organ contributes to the final ratio via its own factor. All N factors then get multiplied together. Anatomical structures such as bony ones tend to contribute posterior factors close to 1 and thus they (correctly) do not have much effect on the final classification. On the contrary, enhancing soft tissue organs contribute in proportion to how much they enhance in the presence of i.v. contrast. This demonstrates automatic weighting of organs contribution for contrast detection. Quantitative evaluation is done by repeatedly subdividing our 400-large CT database into disjoint training and testing sets, with random selection of the studies and varying ratio between the two sets. Our models are trained exclusively on the training set and evaluated exclusively on previously unseen test
Fig. 6. Automatic contrast detection results (a) Results of scan classification into contrast-enhanced or native as a function of training/test ratio. Accuracy increases with the number of training data. However, the flatness of the curve indicates good generalization. (b) Results of contrast detection for increasingly noisy organ localization. The accuracy curve falls off slowly with increasing noise, thus indicating good noise robustness. Note that accuracy of existing manual DICOM tag is ∼ 80%.
images. Figure 6a shows classification accuracy as a function of percentage of training volumes. As expected the accuracy increases with the number of training images. However, its behavior is very flat (close to constant), thus indicating good generalization, with a mean accuracy of ∼ 91%. We also investigated the robustness of the generative classifier with respect to noise in the discriminative anatomy localizer. We do so by artificially adding varying amount of noise to the detected organs bounding boxes. Plotting accuracy as a function of noise (fig. 6b) shows a reasonably slow fall off for noise as large as 20mm. This indicates good robustness with respect to inaccurate organ localization. In both plots in fig. 6 the experiments were repeated 100 times for each x-axis value. The estimated 2-std confidence region is shown shaded. Visual inspection of incorrectly classified images shows that most of those are borderline cases, where perhaps the contrast agent has not had sufficient time to diffuse. Generally this uncertainty is indicated by a posterior ratio close to 1. Efficiency. Run-times remain of the order of 1s for the whole discriminative + generative testing phase, as the generative part adds a negligible load. Parameters. The only additional parameter in our generative model is the histogram length, which is automatically optimized during training. Comparisons. We compared our algorithm against one of the state of the art recognition techniques, i.e. random classification forests [10]. Recently, classification forests have been shown to yield excellent results in diverse applications [11]. During training Haar wavelet-like features are automatically selected in different spatial arrangements and positions. This is to allow automatic alignment of box-like ROIs with enhancing organs and avoid a separate organ detection step. After optimizing all parameters for best results we recorded an accuracy of ∼ 87%, considerably lower than that of the two-step approach proposed here.
6
Conclusion
We have presented a hybrid discriminative-generative model for the efficient, automatic detection of intravenous contrast agent in CT scans. The algorithm can automatically localize enhancing regions in the scan and weigh them optimally in order to achieve the most accurate detection results. It is robust to missing organs, pathologies and possible inaccuracies in the organ localization stage. Validation on a large database of pathology-rich scans has demonstrated accuracy greater than that of manually annotated DICOM contrast tags. Our algorithm plays an important role in routine quality control of hospital data as well as in clinical research. It may be applied to other quality control tasks such as detection of oral contrast or identification of the specific contrast material.
References 1. Guld, M., Kohnen, M., Keysers, D., Schubert, H., Wein, B., Bredno, J., Lehmann, T.: Quality of DICOM header information for image categorization. In: Proc. SPIE, San Diego (2002) 2. Prince, M., Chenevert, T., Foo, T., Londy, F., Ward, J., Maki, J.: Contrastenhanced abdominal mr angiography: optimization of imaging delay time by automating the detection of contrast material arrival in the aorta. Radiology 203 (Apr 1997) 3. Sheiman, R., Prassopoulos, P., Raptopoulos, V.: Ct detection of layering of i.v. contrast material in the abdominal aorta. American Journal of Roentgenology (American Roentgen Ray Society) 171(5) (Nov 1998) 4. Bae, K., Kim, J.S., Na, Y.H., Kim, K., Kim, J.H.: Pulmonary nodules: automated detection on ct images with morphologic matching algorithm–preliminary results. Radiology (RSNA, Inc.) 236 (Jul 2005) 5. Nappi, J., Dachman, A., MacEneaney, P., Yoshida, H.: Automated knowledgeguided segmentation of colonic walls for computerized detection of polyps in ct colonography. Journal of computer assisted tomography 26 (2002) 6. Gao, L., Heath, D., Kuszyk, B., Fishman, E.: Automatic liver segmentation technique for three-dimensional visualization of ct data. Radiology (RSNA, Inc.) 201 (Nov 1996) 7. Seifert, S., Barbu, A., Zhou, S.K., Liu, D., Feulner, J., Huber, M., S¨ uhling, M., Cavallaro, A., Comaniciu, D.: Hierarchical parsing and semantic navigation of full body ct data. In Pluim, J.P.W., Dawant, B.M., eds.: SPIE. (2009) 8. Soler, L., Delingette, H., Malandain, G., Montagnat, J., Ayache, N., Koehl, C., Dourthe, O., Malassagne, B., Smith, M., Mutter, D., Marescaux, J.: Fully automatic anatomical, pathological, and functional segmentation from ct scans for hepatic surgery. Computer aided surgery : official journal of the International Society for Computer Aided Surgery 6 (Jan 2001) 9. Criminisi, A., Shotton, J., Robertson, D., Konukoglu, E.: Regression forests for efficient anatomy detection and localization in CT studies. In: MICCAI workshop on Medical Computer Vision: Recognition Techniques and Applications in Medical Imaging, Beijing, Springer (2010) 10. Breiman, L.: Random forests. Technical Report TR567, UC Berkeley (1999) 11. Shotton, J., Johnson, M., Cipolla, R.: Semantic texton forests for image categorization and segmentation. In: IEEE CVPR. (2008)