hernia lesions with automated 3D ultrasound images. It can also provide more diagnostic information by measuring the volume of lesions. Keywords-abdominal ...
2013 6th International Conference on Biomedical Engineering and Informatics (BMEI 2013)
A Fast Detection and Diagnosis Algorithm for Abdominal Incisional Hernia Lesions With Automated 3D Ultrasound Images Jun Wu1,2, Yuanyuan Wang1*, Jinhua Yu1
Yue Chen3, Yun Pang3
1
Department of Electronic Engineering Fudan University Shanghai, China 2 Department of Electronic Engineering Yunnan University Kunming, China Abstract—A fast detection and diagnosis algorithm is proposed to improve the effectiveness and efficiency of abdominal incisional hernia lesions diagnosis. Firstly, hernia lesions were obtained by detecting black targets in ultrasound images of the coronal plane. Secondly, the morphological method was used to remove false black targets. Thirdly, the volume of interest (VOI) was cropped from the original data set to define the lesions area. Finally, the volume of lesions was measured. Results demonstrated that the proposed algorithm can effectively detect abdominal incisional hernia lesions with automated 3D ultrasound images. It can also provide more diagnostic information by measuring the volume of lesions. Keywords-abdominal incisional hernia; lesion detection; automated 3D ultrasound; ultrasound images; 3D speckle reduction
I.
INTRODUCTION
Abdominal incisional hernias are delayed complications of abdominal surgery. They are generally caused by an incompletely-healed surgical wound. They may manifest anywhere in the abdominal wall and are more commonly encountered in association with vertical than with transverse incisions [1]. Incisional hernias usually manifest during the first few months after surgery. Their reported prevalence ranges from 0.5% to 13.9% for most abdominal surgeries but may be as high as 41% after aortic surgery [2-4]. Ultrasound is a non-invasive, non-ionising radiation modality which is highly successful at soft tissue imaging [56]. Hence, hand-held ultrasound is a commonly used diagnostic method of abdominal incision hernia. However, it is an operator-dependent examination for lesion detection and diagnosis. Furthermore, it is difficult to localize a twodimensional (2D) image plane and reproduce the same image plane at the same location later down the track [7]. Therefore automated three-dimensional (3D) ultrasound was developed. Due to its digital character, each sectional plane of the saved volume can be visualized, thereby avoiding the investigatordependence and non-standardized documentation. In addition, the generated coronal plane, which cannot be generated by 2D ultrasound, offers new diagnostic information [8].
978-1-4799-2761-6/13/$31.00 ©2013 IEEE
Department of Ultrasound Huadong Hospital, Fudan University Shanghai, China
Previous studies indicate that the automated 3D ultrasound provides advantages of high diagnostic accuracy, better lesion size prediction, operator-independence and visualization of the whole lesions and their relation with the neighboring tissues [8-15]. It is a promising modality in abdominal incisional hernia imaging. However, a disadvantage of automated 3D ultrasound is the cost of much time in data analysis. Taking the data set in this study for example, the automated 3D ultrasound system is able to capture 318 two-dimensional slices in a single scan. Manual processing is both time and energy consuming, liable to run into errors as well. In this paper, a fast detection and diagnosis algorithm based on multiplanar compounded images in three planes is proposed to improve the effectiveness and efficiency of abdominal incisional hernia lesions diagnosis. To the best of our knowledge, this is one of the first computer-aided diagnosis studies dealing with the automated 3D ultrasound images of abdominal incisional hernia. II.
MATERIALS AND METHODS
A.
Automated 3D Ultrasound System and Data Acquisition In this study, 3D ultrasound data sets from abdominal incisional hernias were acquired by the ACUSON S2000TM ABVS (Siemens Medical Solutions, Mountain View, CA, USA). This system equipped with a wide bandwidth linear transducer (14L5BV transducer, Siemens Medical Solutions) that acquired a 15.4 cm × 16.8 cm × maximum 6 cm volume data sets in a single sweep. Customized settings were used to optimize the image depth, gain, frequency and view. Examinations were performed with the patient in a supine position. In each scanning pass, the motor-driver transducer automatically moved on the abdominal skin and a sequence of 318 2D slices could be obtained for the scanned location. The typical scanning time of ABVS was 60 s per scan, and the data set were recorded at slice intervals of 0.5 mm. Data were reviewed in multiple orientations using an attached workstation with a multiplanar reconstruction display. The volumetric data could be reconstructed from these continuous 2D slices because the distance of neighboring slices is fixed and small [16].
86
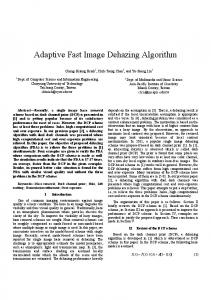
Figure 1. Automated 3D ultrasound images obtained from a 76 years old man with an abdominal incisional hernia. (a) Continuous 2D original slices in Axial view; (b) the reconstructed 3D image in Axial, Sagittal and Coronal views, the bounding box represents the selected abdominal incisional hernia lesions VOI; (c) the VOI in Axial, Sagittal and Coronal views; (d) the VOI in 3D view.
For example, some continuous 2D slices in an ABVS data set and their reconstructed 3D images are shown in Fig. 1 (a) and (b). B.
Targets Detection and Morphological Processing In this study, hernia sac is filled with the fluid, so the ultrasound image of hernia lesions shows hypoechoic areas with irregular borders. Therefore, the hernia lesions could be simply obtained by detecting black targets in ultrasound images. Unfortunately, there were false negatives for hernia lesions diagnosis when this method was applied directly. Because of the area uncoupled with the transducer is also rendered as the black. Thus, the morphological method needs to be used to remove false black targets. C.
VOI Extraction To focus on the abdominal incisional hernia lesion area, a VOI that contained the lesion and its neighboring tissues was detected before the further analysis [17]. In summary, firstly, a 2D bounding box was determined to indicate the true lesion area in the coronal plane. Secondly, the corresponding slices in the axial and sagittal plane were used to extend the 2D rectangle into a 3D cube. Thirdly, in order to ensure that the whole lesion was included in the cube, it was expanded by 40 pixels in each of the X , Y and Z dimensional. Finally, the VOI (expanded 3D cube) was cropped from the original volume data set, as illustrated in Fig. 1 (c) and (d).
D.
3D Speckle Reduction Even though speckle can give us information about the characteristics of the tissue, it also degrades both the spatial resolution and contrast of an ultrasound image, which makes its interpretation more difficult. Therefore, speckle makes the automatic segmentation of anatomical structures in ultrasound imaging a challenging task [18]. In Yu and Acton [19], a Speckle Reducing Anisotropic Diffusion (SRAD) filter for ultrasound images was reported. The SRAD filter could effectively remove speckle without destroying image detail and edge information. In Sun et al. [20], a 3D SRAD filter for 3D ultrasound volume data sets was reported. The 3D SRAD operates directly on the image volume instead of the 2D slice. Thus, information between slices of 2D image are explored and preserved [20]. Considering this, we apply the 3D SRAD filter to the VOI before the segment stage. E.
Volume Measurement of Lesions Computerized axial tomography permits accurate crosssectional radiographic visualization of visceral organs. Thus, “radiographic area” of an organ slice can be calculated and converted to the actual area. Because the width between slices is known, the volume of an organ slice can be calculated as area times width [21]. In this study, the volume data set was composed of 318 2D slices in the axial plane, and the slice intervals was fixed at 0.5 mm. Therefore, the volume of lesion in a VOI was defined as
87
k
V = ∑Sj ×D ,
(1)
j =1
where Sj is the area of lesion in slice j, D is the distance between slices, and k is the serial number of last slice in the VOI. The detail flow chart of the whole procedure is shown in Fig. 2.
Figure 3. The black targets detection results. (a) Original coronal-plane image No. 141 for black targets detection; (b) despeckling result of (a) with 2D SRAD; (c) binarization result of (b) with maximal variance between-class method; (d) an inverse view of (c); (e) morphological processing results of (d) with suppress light structures connected to image border; (f) black targets detection result of (a).
Figure 4. The white targets detection results. (a) Original coronal-plane image No. 1 for white targets detection; (b) despeckling result of (a) with 2D SRAD; (c) binarization result of (b) with maximal variance between-class method; (d) morphological processing results of (c) with suppress light structures connected to image border; (e) an inverse view of (d); (f) white targets detection result of (a).
Figure 2. The flow chart of the proposed algorithm.
III. A.
RESULTS AND DISCUSSIONS
Targets Detection and Morphological Processing Results Fig. 3 shows the black targets detection process and results of the coronal-plane image No. 141. However, the black targets shown in Fig. 3 (f) represent not only the hernia lesions but also the area uncoupled with the transducer.
Fig. 4 shows the white targets detection process and results of the coronal-plane image No. 1. Since the uncoupling area has a relatively hyperechoic feature in coronal-plane image No. 1, the white targets detection results shown in Fig. 4 (f) could be used to remove the false black targets. Fig. 5 shows true black targets detection result with morphological processing. Fig. 5 (a) is black targets detection result of coronal-plane image No. 141. Fig. 5 (b) is an inverse view of white targets detection result of coronal-plane image No. 1. The areas with red boundary shown in Fig. 5 (c)
88
represent the false black targets. For result shown in Fig. 5 (d), it appears that after logic multiplying black targets and white targets together, the false black targets areas significantly decreased, some of them even have disappeared. Fig. 5 (f) shows the true black targets detection result by removing small objects that have fewer than 1000 pixels, the bounding box represents the true lesion area in the coronal plane.
Figure 5. True black targets detection result with morphological processing. (a) black targets detection result of coronal-plane image No. 141; (b) an inverse view of white targets detection result of coronal-plane image No. 1; (c) true and false black targets, the areas with red boundary represent the false black targets; (d) result of logic multiplying (a) and (b) together; (e) morphological processing results of (d) with removing small objects that have fewer than 1000 pixels; (l) true black targets detection result.
C.
3D Reconstruction Results of Lesions Fig. 7 shows the result of three-dimensional reconstruction of abdominal incisional hernia lesion corresponding to the VOI displayed in Fig. 1 (c) and (d). Obviously, the multiplanar reconstruction displayed in three planes was not good enough in this case while the view of 3D reconstruction showed the whole structure and the details of the lesion.
Figure 7. Three-dimensional model of abdominal incisional hernia lesion
IV.
CONCLUSIONS
The automated 3D ultrasound imaging plays an important role in modern clinical application. It can display the location, shape, size and number of lesions in the coronal plane, so it can offer significant evidence for clinical diagnosis and surgical repair procedures. It is a promising modality in abdominal incisional hernia imaging. With automated 3D ultrasound images, the proposed algorithm can effectively detect abdominal incisional hernia lesions. It can also provide more diagnostic information by measuring the volume of lesions. ACKNOWLEDGMENT This work was supported by the National Natural Science Foundation of China (61271071, 11228411), and the National Science and Technology Support Program (2012BAI13B02). Figure 6. Despeckling results of the VOI displayed in Fig. 1 (c) with 3D SRAD.
REFERENCES [1]
B.
3D Speckle Reduction Results Fig. 6 shows the resultant images after 3D SRAD corresponding to the VOI displayed in Fig. 1 (c). The 3D SRAD filter could not only complete three-dimensional speckle reduction at one time, but also could preserve image detail and edge information. Despeckling preprocessing can highly enhance the segmentation efficiency.
[2]
[3]
89
D. A. Aguirre, A. C. Santosa, G. Casola, et al., “Abdominal Wall Hernias: Imaging Features, Complications, and Diagnostic Pitfalls at Multi–Detector Row CT1,” Radiographics, vol. 25, pp. 1501-1520, 2005. G. G. Ghahremani, M. A. Jimenez, M. Rosenfeld, et al., “CT diagnosis of occult incisional hernias,” American Journal of Roentgenology, vol. 148, pp. 139-142, 1987. J. D. Raffetto, Y. Cheung, J. B. Fisher, et al., “Incision and abdominal wall hernias in patients with aneurysm or occlusive aortic disease,” Journal of Vascular Surgery, vol. 37, pp. 1150-1154, 2003.
[4]
D. R. Flum, K. Horvath, T. Koepsell, “Have outcomes of incisional hernia repair improved with time?: A population-based analysis,” Annals of Surgery, vol. 237, pp. 129-135, 2003. [5] M. Bradley, D. Morgan, B. Pentlow, B, et al., “The groin hernia-an ultrasound diagnosis?” Annals of the Royal College of Surgeons of England, vol. 85, pp. 178-180, 2003. [6] N. Jain, N. Goyal, K. Mukherjee, et al., “Ultrasound of the abdominal wall: What lies beneath?,” Clinical Radiology, in press. [7] R. F. Chang, D. R. Chen, W. K. Moon, et al., “3-D ultrasound strain images for breast cancer diagnosis,” In International Congress Series, vol. 1281, pp. 1069-1074, 2005. [8] X. Lin, J. Wang, F. Han, et al., “Analysis of eighty-one cases with breast lesions using automated breast volume scanner and comparison with handheld ultrasound,” European Journal of Radiology, vol. 81, pp. 873878, 2012. [9] L. Fang, Y. Chen, L. Chen, et al., “Automatic ultrasonic volume tomography in the preoperative diagnosis of abdominal incisional hernia,” Chinese Journal of Medical Imaging Technology, vol. 27, pp. 1739-1742, 2011. [10] S. Wojcinski, A. Farrokh, U. Hille, et al., “The Automated Breast Volume Scanner (ABVS): initial experiences in lesion detection compared with conventional handheld B-mode ultrasound: a pilot study of 50 cases,” International Journal of Women's Health, vol. 3, pp. 337346, 2011. [11] M. Golatta, D. Franz, A. Harcos, et al., “Interobserver reliability of automated breast volume scanner (ABVS) interpretation and agreement of ABVS findings with hand held breast ultrasound (HHUS), mammography and pathology results,” European Journal of Radiology, vol. 82, pp. e332-e336, 2013. [12] M. Tozaki, S. Isobe, M. Yamaguchi, et al., “Optimal scanning technique to cover the whole breast using an automated breast volume scanner,” Japanese Journal of Radiology, vol. 28, pp. 325-328, 2010.
[13] M. Tozaki, E. Fukuma, “Accuracy of determining preoperative cancer extent measured by automated breast ultrasonography,” Japanese Journal of Radiology, vol. 28, pp. 771-773, 2010. [14] S. Isobe, M. Tozaki, M. Yamaguchi, et al., “Detectability of breast lesions under the nipple using an automated breast volume scanner: comparison with handheld ultrasonography,” Japanese Journal of Radiology, vol. 29, pp. 361-365, 2011. [15] M. Tozaki, E. Fukuma, “Category assessment based on 3D volume data acquired by automated breast ultrasonography,” Japanese Journal of Radiology, vol. 30, pp. 185-191, 2012. [16] W. K. Moon, Y. W. Shen, C. S. Huang, et al., “Computer-aided diagnosis for the classification of breast masses in automated whole breast ultrasound images,” Ultrasound in Medicine & Biology, vol. 37, pp. 539-548, 2011. [17] W. K. Moon, C. M. Lo, J. M. Chang, et al., “Computer-aided classification of breast masses using speckle features of automated breast ultrasound images,” Medical Physics, vol. 39, pp. 6465-6473, 2012. [18] B. Gutiérrez-Becker, F. A. Cosío, M. E. Huerta, et al., “Automatic segmentation of the fetal cerebellum on ultrasound volumes, using a 3D statistical shape model,” Medical & Biological Engineering & Computing, pp. 1-10, 2013. [19] Y. J. Yu, S. T. ACTON, “Speckle reducing anisotropic diffusion,” IEEE Transactions on Image Processing, vol. 11, pp. 1260-1270, 2002. [20] Q. L. Sun, J. A. Hossack, J. S. Tang, et al., “Speckle reducing anisotropic diffusion for 3D ultrasound images,” Computerized Medical Imaging and Graphics, vol. 28, pp. 461-470, 2004. [21] S. B. Heymsfield, T. FULENWIDER, B. Nordlinger, et al., “Accurate measurement of liver, kidney, and spleen volume and mass by computerized axial tomography,” Annals of Internal Medicine, vol. 90, pp. 185-187, 1979.
90