www.nature.com/scientificdata
OPEN SUBJECT CATEGORIES » Agroecology » Environmental sciences » Biodiversity » Plant ecology
Received: 14 March 2016 Accepted: 17 August 2016 Published: 27 September 2016
Data Descriptor: A global experimental dataset for assessing grain legume production Charles Cernay1, Elise Pelzer1 & David Makowski1 Grain legume crops are a significant component of the human diet and animal feed and have an important role in the environment, but the global diversity of agricultural legume species is currently underexploited. Experimental assessments of grain legume performances are required, to identify potential species with high yields. Here, we introduce a dataset including results of field experiments published in 173 articles. The selected experiments were carried out over five continents on 39 grain legume species. The dataset includes measurements of grain yield, aerial biomass, crop nitrogen content, residual soil nitrogen content and water use. When available, yields for cereals and oilseeds grown after grain legumes in the crop sequence are also included. The dataset is arranged into a relational database with nine structured tables and 198 standardized attributes. Tillage, fertilization, pest and irrigation management are systematically recorded for each of the 8,581 crop*field site*growing season*treatment combinations. The dataset is freely reusable and easy to update. We anticipate that it will provide valuable information for assessing grain legume production worldwide.
Design Type(s)
database creation objective • data integration objective
Measurement Type(s)
crop production measures
Technology Type(s)
data item extraction from journal article
Factor Type(s) Sample Characteristic(s)
Fabaceae
1 UMR Agronomie, INRA, AgroParisTech, Université Paris-Saclay, 78850 Thiverval-Grignon, France. Correspondence and requests for materials should be addressed to C.C. (email:
[email protected]) or to D.M. (email:
[email protected]).
SCIENTIFIC DATA | 3:160084 | DOI: 10.1038/sdata.2016.84
1
www.nature.com/sdata/
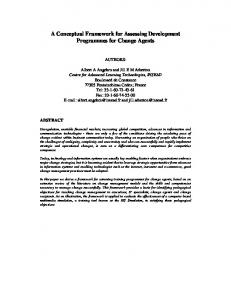
Background & Summary The 68th United Nations General Assembly has proclaimed 2016 as the International Year of Pulses. The Food and Agriculture Organization of the United Nations defines ‘pulses’ as plant species from the Fabaceae family cropped annually, and harvested only for dry grain (hereafter ‘grain legume’ for unambiguous use1). As part of this initiative, grain legumes are being promoted for use as nutritional protein-rich grains, and for their environmental and economic impacts2–7. Grain legumes can complement cereals as an affordable source of protein for the human diet8–10 and for animal feed11–13. Through atmospheric nitrogen fixation, grain legumes can significantly increase soil nitrogen supply and the yields of following crops14–19. Grain legumes can therefore play a significant role in maintaining global food security and ecosystem resilience. Fabaceae is one of the largest families of plants worldwide, with 20,000 species growing across a wide range of climatic conditions and soil types20,21. Grain legume crops play significant roles in the human diet and animal feed and the environment, but only a fraction of the species in this diverse group of plants is currently exploited in agriculture. From 1961 to 2014, 75 and 90% of the area under legumes was allocated to soybean (Glycine max) in South America and North America, respectively22. Over the same period, 70, 76 and 78% of the area under legumes was covered by only three species each in Europe, Oceania and Africa: garden pea (Pisum sativum), soybean and beans (Phaseolus spp. and Vigna spp.) in Europe; lupins (Lupinus spp.), chickpea (Cicer arietinum) and garden pea in Oceania, and groundnut (Arachis hypogaea), cowpea (Vigna unguiculata) and beans in Africa22. In Asia, 76% of the area under legumes was allocated to four species (i.e., soybean, beans, groundnut and chickpea)22. Experimental comparisons of grain legumes can help researchers and decision-makers to identify high-performance species with high yields. Over the last 50 years, many field experiments have assessed the agronomic and environmental performances of grain legumes. These performances vary between field sites and growing seasons, as a function of the climatic conditions and soil types. It would therefore be misleading to draw general conclusions from individual experiments considered separately. A global dataset would provide us with a unique opportunity to analyze variability in grain legume performances across a large spectrum of environmental conditions, and to rank legume species of agricultural and economic interest according to several criteria. We introduce here a global dataset including the results of field experiments comparing 39 grain legume species grown as sole crops. Most of grain legume species included in the database correspond to species of significant agricultural and economic importance. We have selected only experiments comparing at least two grain legume species grown at the same field site during the same growing season, to prevent any confusion between species characteristics and environmental conditions. We excluded experiments on single grain legume species because, in such experiments, differences between species can be confounded with the effects of environmental factors. Experimental data were extracted from 173 published articles2–4,6,14–19,23–185. In total, measurements from 360 field sites were collected across 18 Köppen-Geiger climatic zones186 in 41 countries (Fig. 1) over five continents (Table 1). The dataset contains 8,581 crop*field site*growing season*treatment combinations. Article references, field site locations, climatic conditions, soil types, yields, crop nitrogen contents, residual soil nitrogen contents
Equatorial rainforest climate, fully humid Equatorial monsoon climate Equatorial savannah climate with dry summer Equatorial savannah climate with dry winter Hot steppe climate Cold steppe climate Hot desert climate Warm temperate climate, fully humid with hot summer Warm temperate climate, fully humid with warm summer Warm temperate climate with dry and hot summer Warm temperate climate with dry and warm summer Warm temperate climate with dry winter and hot summer Warm temperate climate with dry winter and warm summer Snow climate, fully humid with hot summer Snow climate, fully humid with warm summer Snow climate, fully humid with cool summer and cold winter Snow climate with dry and cool summer and cold winter Snow climate with dry and cold winter and cool summer
Figure 1. Latitude and longitude coordinates of the field sites included in the database. The Köppen-Geiger climatic classification186 was used to link each field site to a grid size with a resolution of 0.50 degrees of latitude by 0.50 degrees of longitude. Eighteen Köppen-Geiger climatic zones are considered: equatorial climates (red), arid climates (orange), warm temperate climates (green) and snow climates (blue). Within each main Köppen-Geiger climatic zone, each Köppen-Geiger climatic subzone is indicated by a color gradient.
SCIENTIFIC DATA | 3:160084 | DOI: 10.1038/sdata.2016.84
2
www.nature.com/sdata/
Region
Field site
Field site*growing season
Field site*growing season*treatment
Grain yield
Aerial biomass
Grain nitrogen content
Aerial nitrogen content
Aerial fixed nitrogen content
Residual soil nitrogen content
Water use
Oceania
131 (36.39)
183 (22.45)
2,372 (27.64)
2,324 (28.25)
727 (27.16)
191 (19.47)
107 (12.53)
28 (7.11)
216 (11.71)
142 (16.01)
North America
72 (20.00)
165 (20.25)
2,597 (30.26)
2,524 (30.68)
600 (22.41)
285 (29.05)
178 (20.84)
38 (9.64)
806 (43.69)
474 (53.44)
Asia
65 (18.06)
253 (31.04)
1,475 (17.19)
1,408 (17.11)
598 (22.34)
129 (13.15)
171 (20.02)
87 (22.08)
468 (25.37)
259 (29.20)
243 (9.08)
161 (16.41)
172 (20.14)
145 (36.80)
70 (3.79)
0 (0.00)
479 (17.89)
181 (18.45)
188 (22.01)
74 (18.78)
255 (13.82)
12 (1.35)
Africa
48 (13.33)
101 (12.39)
907 (10.57)
827 (10.05)
Europe
39 (10.83)
102 (12.52)
1,174 (13.68)
1,089 (13.24)
South America
5 (1.39)
11 (1.35)
56 (0.65)
Total number (percentage) of available data
360 (100.00)
815 (100.00)
8,581 (100.00)
Total number (percentage) of missing data
0 (0.00)
0 (0.00)
Total number (percentage) of data
360 (100.00)
815 (100.00)
34 (3.47)
38 (4.45)
22 (5.58)
8,228 (95.89)
56 (0.68)
2,677 (31.20)
981 (11.43)
854 (9.95)
394 (4.59)
1,845 (21.50)
887 (10.33)
353 (4.11)
5,904 (68.80)
7,600 (88.57)
7,727 (90.05)
8,187 (95.41)
6,736 (78.50)
7,694 (89.66)
8,581 (100.00)
8,581 (100.00)
8,581 (100.00)
8,581 (100.00)
8,581 (100.00)
8,581 (100.00)
8,581 (100.00)
0 (0.00)
8,581 (100.00)
30 (1.12)
30 (1.63)
0 (0.00)
Table 1. Number (percentage) of field sites, field site*growing season and field site*growing
season*treatment combinations, and data for grain yield, aerial biomass, grain nitrogen content, aerial nitrogen content, fixed aerial nitrogen content, residual soil nitrogen content and water use, by main world regions. Regions are ranked in descending order of field sites. Grain yield includes data from the
‘Crop_Yield_Grain’ attribute. Aerial biomass includes data from both ‘Crop_Biomass_Aerial’ and ‘Crop_Harvest_Index’ attributes. Grain nitrogen content includes data from both ‘Crop_N_Quantity_Grain’ and ‘Crop_N_Percentage_Grain’ attributes. Aerial nitrogen content includes data from the ‘Crop_N_ Quantity_Aerial’, ‘Crop_N_Percentage_Aerial’ and ‘Crop_N_Harvest_Index’ attributes. Fixed aerial nitrogen content includes data from both ‘Crop_N_Fixed_Quantity_Aerial’ and ‘Crop_N_Fixed_Percentage_Aerial’ attributes. Residual soil nitrogen content includes data from both ‘Crop_N_Soil_Quantity_Percentage_Seeding’ and ‘Crop_N_Soil_Quantity_Percentage_Harvest’ attributes. Water use includes data from the ‘Crop_ Water_Use_Balance’, ‘Crop_Water_Use_Balance_Efficiency_Grain’ and ‘Crop_Water_Use_Balance_ Efficiency_Aerial’ attributes. The total number (percentage) of available data and the total number (percentage) of missing data are calculated over all considered world regions.
Table
Class attribute
Numerical attribute
Index attribute
Binary attribute
Date attribute
Total
1
0
1
0
0
2 (1.01)
5
0
2
0
1
8 (4.04)
11
12
2
0
4
29 (14.65)
Literature_Search Article Site Crop_Sequence_Trt Crop
3
2
2
1
0
8 (4.04)
47
41
3
5
10
106 (53.54) 19 (9.60)
Tillage
7
6
2
4
0
Fertilization
4
1
2
0
0
7 (3.54)
Weed_Insect_Fungi
2
1
2
6
2
13 (6.57)
Irrigation
2
1
2
1
0
6 (3.03)
82 (41.41)
64 (32.32)
18 (9.09)
17 (8.59)
17 (8.59)
198 (100.00)
Total
Table 2. Number (percentage) of attribute types included in the nine tables of the database. Tables are presented according to the cascade path of the database.
and management practices are systematically recorded for each crop*field site*growing season*treatment combination. When available, data on non-legume species grown at the same field site during the same growing season than grain legume species, and data on non-legume species grown after grain legumes in the crop sequence are also included. Most of these non-legume species correspond to cereals and oilseeds. The data are organized into a relational database with nine structured tables and 198 standardized attributes (Tables 2 and 3 (available online only)). The dataset can be used for two types of quantitative analysis. First, the dataset can be used to compare the crop production of a broad range of grain legume species, on the basis of experimental data with diverse criteria (e.g., grain yield, aerial biomass and crop nitrogen content). Second, the dataset can be used to assess the crop production of cereal and oilseed species following grain legume species cultivated as preceding crops in the same crop sequences, based on a consideration of field data for various criteria. SCIENTIFIC DATA | 3:160084 | DOI: 10.1038/sdata.2016.84
3
www.nature.com/sdata/
The dataset is freely available to facilitate such analyses. It could easily be updated in the future, by adding the results of new experiments not originally included in the dataset. It might also be interesting to expand the dataset to include legumes grown for purposes other than grain production (e.g., forage production) or legumes grown in intercropping systems. The global dataset should prove to be a useful support for experimental assessments of the agronomic and environmental performances of a large diversity of grain legumes.
Methods Literature search We carried out a systematic search of peer-reviewed journals for articles comparing grain legume yields. We defined a grain legume species as a plant from the Fabaceae family, based on the United States Department of Agriculture Plants Database (http://plants.usda.gov/java/), and cropped for grain production. The literature search was completed on February 15, 2016. The equation search was: ‘crop* AND (legum* OR pulse*) AND (yield* OR ‘dry matter’ OR biomass) AND (compar* OR assessment OR product* OR performance*) AND (trial* OR factorial OR experiment* OR treatment* OR condition*) NOT (intercrop* OR catch OR cover OR ‘green manure’ OR forage OR fodder)’. The search terms were used to query the Institute for Scientific Information Web of Science (http://wokinfo.com/), with no restrictions concerning the date and language of publication in the article title, abstract and author keywords. The initial literature search identified 8,386 articles as of potential interest (Fig. 2). Each article title and article abstract were screened for eligibility according to six criteria: (1) article title and/or article abstract reporting one or several annual grain legume species grown as sole crops, (2) article title and/or article abstract reporting at least two grain legume species grown at the same field site during the same growing season, (3) article title and/or article abstract reporting at least one experiment conducted during one or several growing seasons, from the seeding stage to the harvest stage, (4) article title and article abstract referring to an article published in a peer-reviewed journal, (5) article title or article abstract written in English and (6) full-text article available. We selected 223 eligible full-text articles that met these first six criteria (Fig. 2). Eligible full-text articles were then examined according to three additional criteria: (7) full-text article reporting raw data not duplicated in other articles or raw data that could be obtained by contacting authors, (8) full-text article reporting individual grain yield for each species and (9) full-text article reporting one or several experiments for which field site location or soil characteristics were precisely stated. We selected 60 full-text articles that met all nine criteria. This search was supplemented by screening the references cited in these 60 full-text articles. We also screened the references included in one meta-analysis about drought effects on food legume production187 for eligibility. When reviewing the full-text articles identified from references screening, all nine selection criteria defined above had to be met for the new article to be considered eligible. Note that, according to the criterion (2), experiments reporting data for single grain legume species were excluded. This selection criterion was used to ensure the direct comparability of different grain legume species, and avoid confounding effects between species characteristics and environmental factors. Experiments testing single species cannot be used to compare several species due to the effects of field site and growing season characteristics (e.g., climate conditions, soil types and plant diseases) on the growth and development of grain legumes. We finally selected 173 full-text articles2–4,6,14–19,23–185 published between 1967 and 2016 that met all nine selection criteria (Fig. 2). Database structure All data are recorded in a relational database (Data Citation 1). The Structured Query Language (SQL) system is used to query and maintain the database. We used the open-access application Sequel Pro version 1.0.2 (http://www.sequelpro.com/). The data collected are grouped into nine related tables including 198 standardized attributes of five types: class, numerical, index, binary and date (Fig. 3 and Table 2). Within the database, the tables are organized according to a cascade path: each ‘child’ table is related to a ‘mother’ table. For instance, the ‘Article’ table is the ‘mother’ table for the ‘child’ ‘Site’ table (Fig. 3). The cascade path from each ‘mother’ table to each ‘child’ table is structured by a ‘primary key’ and a ‘secondary key’ (Fig. 3). A ‘primary key’ assigns an index to each row of the table, whether the table is a ‘mother’ table or a ‘child’ table. A ‘secondary key’ assigns the ‘primary key’ of a ‘mother’ table to each row of a ‘child’ table. The cardinality from each ‘mother’ table to each ‘child’ table is based on ‘one-to-one’ and ‘one-to-many’ relationships (Fig. 3). The database is structured into nine separate but related tables, stored as CSV-formatted files (Data Citation 1). Tables are related to each other via primary and secondary keys, as explained in Fig. 3. The names, types and definitions of attributes included in the nine tables are listed in Table 3 (available online only). The ‘Literature_Search’ table describes each step in the literature search at which each original article was selected (e.g., selection from the initial literature search or from references screening). The corresponding file is entitled ‘Literature_Search.csv’ (Data Citation 1), and includes 2 columns and 3 rows (including the row header for the names of attributes). SCIENTIFIC DATA | 3:160084 | DOI: 10.1038/sdata.2016.84
4
www.nature.com/sdata/
The ‘Article’ table describes the references of the 173 selected articles (e.g., the name of the first author and the name of the journal). The corresponding file is entitled ‘Article.csv’ file (Data Citation 1), and includes 8 columns and 174 rows (including the row header for the names of attributes). The ‘Site’ table describes the characteristics of each field site considered in each article (e.g., latitude and longitude coordinates, soil texture, precipitation and temperature). The corresponding file is entitled ‘Site.csv’ (Data Citation 1), and includes 29 columns and 361 rows (including the row header for the names of attributes). The ‘Crop_Sequence_Trt’ table describes each combination of crop sequences and management practices into the treatments studied at each field site (e.g., names of the species and their order in each crop sequence). The corresponding file is entitled ‘Crop_Sequence_Trt.csv’ (Data Citation 1), and includes 8 columns and 4,560 rows (including the row header for the names of attributes). The ‘Crop’ table provides information about each crop (e.g., names of the species, seeding and harvest dates, number of replicates, grain yield, aerial biomass, crop nitrogen content, residual soil nitrogen content, water use, error terms and error types). The main attributes included in this central table are described below in the Data Records section. The corresponding file is entitled ‘Crop.csv’ (Data Citation 1), and includes 106 columns and 8,582 rows (including the row header for the names of attributes). The ‘Tillage’ table describes tillage management for each crop (e.g., tillage tools, incorporation of preceding crop residues, seeding density and legume inoculation). The corresponding file is entitled ‘Tillage.csv’ (Data Citation 1), and includes 19 columns and 8,582 rows (including the row header for the names of attributes). The ‘Fertilization’ table describes nitrogen, phosphate and potassium fertilizer management for each crop (e.g., names and doses of fertilizers). Only the total fertilizer dose is reported for each type of nutrient. The corresponding file is entitled ‘Fertilization.csv’ (Data Citation 1), and includes 7 columns and 25,744 rows (including the row header for the names of attributes). The ‘Weed_Insect_Fungi’ table describes weeds, insects, and fungi management for each crop (e.g., mechanical treatment, names and doses of pesticides). The corresponding file is entitled ‘Weed_Insect_Fungi.csv’ (Data Citation 1), and includes 13 columns and 45,002 rows (including the row header for the names of attributes). The ‘Irrigation’ table describes irrigation management for each crop (e.g., quantity of water applied and irrigation method). The corresponding file is entitled ‘Irrigation.csv’ (Data Citation 1), and includes 6 columns and 8,582 rows (including the row header for the names of attributes). In addition to the nine CSV-formatted files (tables), downloadable from Dryad Digital Repository (Data Citation 1), the entire content of the database is also stored in a SQL-formatted file. The corresponding file is entitled ‘Database.sql’, and is also downloadable from Dryad Digital Repository (Data Citation 1). Examples of SQL queries for extracting data for each table are stored in a TXT-formatted file. The corresponding file is entitled ‘Examples_SQL_Queries.txt’, and is also downloadable from Dryad Digital Repository (Data Citation 1). The names, types, and definitions of the 198 attributes included in the nine tables are reported in Table 3 (available online only). The values (including error terms) and dates reported in graphics were digitized manually with the open-access application WebPlotDigitizer (http://arohatgi.info/WebPlotDigitizer/). The maximum error was estimated at 5.0% for the digitization of low-resolution images, generally from articles published before 1990. ‘NA’ indicates that data were ‘Not Available’ for the cell concerned. ‘NULL’ indicates a logical absence of data for attributes included in the ‘Crop’, ‘Tillage’, ‘Fertilization’, ‘Weed_Insect_Fungi’, and ‘Irrigation’ tables. For example, for the ‘Fertilization’ table, if no nitrogen fertilizer was applied to the crop (i.e., ‘0.00’ was reported in the ‘Fertilization_NPK_Dose’ attribute), then ‘NULL’ was reported for the ‘Fertilization_NPK_Dose_Product_Name’ attribute.
Data Records
We describe below the main attributes of the ‘Crop’ table because this table includes most of the experimental data extracted from the 173 selected articles. Information on other attributes (e.g., articles, field sites, combinations of crop sequences and management practices) is defined in Table 3 (available online only). In the ‘Crop’ table, grain yield is by far the attribute including the highest number of data. This high reporting rate reflects the explicit requirement for presence of grain yield data during the article selection process (i.e., criterion 8). Reporting rates are lower for aerial biomass, grain nitrogen content, aerial nitrogen content, fixed aerial nitrogen content, residual soil nitrogen content and water use. Table 1 presents the total number (percentage) of available and missing data for these attributes over all crop*field site*growing season*treatment combinations. When data were not reported for some attributes (e.g., aerial biomass or water use) in the selected articles, we systematically collected data for related attributes (e.g., harvest index or grain water use efficiency) in order to retrieve the missing data. For examples, aerial biomass can be deduced from grain yield and harvest index, and water use can be deduced from grain yield and grain water use efficiency. When data were not available for any related attributes, we contacted the authors of the selected articles, and we asked them to provide us with additional raw data when available. SCIENTIFIC DATA | 3:160084 | DOI: 10.1038/sdata.2016.84
5
www.nature.com/sdata/ ‘Crop_Sequence_Treatment_Name’ attribute The name of each combination of crop sequences and management practices was based on the common names of the species, such as for both ‘Crop_Sequence_Trt_Name’ and ‘Crop_Sequence_Trt_Species_ Order' attributes in the ‘Crop_Sequence_Trt’ table. For instance, the name of a legume-cereal sequence without application of nitrogen fertilizer (0N) could be ‘Garden pea-Common wheat, 0N’ where ‘Garden pea’ and ‘Common wheat’ are the common names listed in the United States Department of Agriculture Plants Database (http://plants.usda.gov/java/) for Pisum sativum and Triticum aestivum, respectively. Malik et al.105 and McEwen et al.108 described several crop sequences including grain legumes and crop sequences including barrelclover (Medicago truncatula) or common oat (Avena sativa), both preceding common wheat. For these two articles, we excluded the crop sequences including barrelclover and common oat because these crops were grown for forage production. ‘Crop_Site_Growing_Season_ID’ attribute This attribute is an index identifying each species grown at a given field site during one or several growing seasons. Identical raw data were found to have been duplicated in two pairs of articles: Muchow et al.114 and Sinclair et al.153 on the one hand, and Heenan et al.71 and Armstrong et al.2 on the other. The duplicated raw data from Sinclair et al.153 and Heenan et al.71 were excluded because the number of crop*field site*growing season*treatment combinations was smaller in these two articles than in their duplicates. ‘Crop_Species_Scientific_Name’ and ‘Crop_Species_Common_Name’ attributes These attributes give the scientific and common names of the species. The scientific name of each species was related to the common name listed in the United States Department of Agriculture Plants Database (http://plants.usda.gov/java/), to avoid confusion due to the use of different common names for the same species. In the absence of a common name for Brassica campestris, Lupinus atlanticus and Triticum sativum, the scientific names of these species were used as common names. In the presence of fallow period, it was not possible to give a scientific name and a common name, and ‘Fallow’ was reported. ‘Crop_Date_From_Seeding_To_Harvest_Day_Number’ attribute We calculated the number of days from seeding date to harvest date, with the open-access application Time and Date (http://www.timeanddate.com/). For data averaged across multiple growing seasons, we calculated the number of days from seeding date to harvest date for each growing season and then obtained the average by dividing by the total number of growing seasons. Some articles approximated seeding date and harvest date by describing these events as occurring in the ‘early’, ‘middle’ or ‘late’ part of the month. We defined ‘early’ as the first 15-day period of the month Articles identified from the literature search (n0=8,386)
Selection based on article titles and abstracts (Criteria 1 to 6)
Articles excluded (n1=8,163)
n0=n1+n2
Articles excluded (n4=364)
n2+n3=n4+n5
Articles selected (n2=223)
Articles identified from references screening (n3=314)
Selection based on article full-texts (Criteria 1 to 9)
Articles included in the database (n5=173)
Figure 2. Flowchart of the steps in the literature search. Boxes with solid lines represent the articles identified (orange), excluded (red) or included in the database (green). In these boxes, the number of articles (ni) is indexed according to each step i of the literature search. Boxes with dashed edges represent the selection process, and selection criteria are indexed in italic.
SCIENTIFIC DATA | 3:160084 | DOI: 10.1038/sdata.2016.84
6
www.nature.com/sdata/
Literature_Search
Site
Article
IDEQ
IDSite
identifiant
Attribute 2
IDRotation
(1,n)
(1,n) (1,1)
Attributes 4 to 9
Tillage
Attributes 12 to 38
(1,1)
identifiant_Paper
IDEQ_Equation
IDCrop (1,n)
(1,n) (1,1)
Crop
Crop_Sequence_Trt
Attributes 41 to 46
(1,1)
IDSite_Site
IDRotation_Crop System
(1,1)
(1,3)
(1,n with n
(1,1)
(1,1)
(1,1)
Fertilization
Attributes 49 to 152
Weed_Insect_Fungi
3)
(1,1) (1,1)
Irrigation
IDTillage
IDFertilization
IDPDW
IDIrrigation
Attributes 155 to 171
Attributes 174 to 178
Attributes 181 to 191
Attributes 194 to 197
IDCrop_Crop
IDCrop_Crop
IDCrop_Crop
IDCrop_Crop
Figure 3. Relational model of the database. Each box represents one table. One ‘primary key’ and one ‘secondary key’ are assigned to each table (except for the ‘Literature_Search’ table, which is exclusively a ‘mother’ table). Each table includes many attributes. For the sake of readability, attributes are indexed in italic from one ‘mother’ table to one or many ‘child’ tables along the cascade path of the database (Table 3 (available online only)). Arrows indicate relationships from one ‘mother’ table to one or many ‘child’ tables. For upward and backward matching between tables, each pair of numbers in brackets indicates the cardinality of the relationships between attributes. The cardinality may involve ‘one-to-one’ (i.e., 1,1) relationship or ‘one-to-many’ (i.e., 1,n) relationship. For upward matching, for instance, the cardinality (1,n) from the ‘Article’ table to the ‘Site’ table indicates that one article may have one or many field sites. For backward matching, the cardinality (1,1) from the ‘Site’ table to the ‘Article’ table indicates that each field site may belong to only one article. Within each table, the names of primary and secondary keys are indicated in purple and blue, respectively.
(1st–15th), ‘middle’ as the 15th day of the month and ‘last’ as the second 15-day period of the month (15th–30th or 15th–31st). In these cases, the number of days from seeding to harvest was calculated by selecting the last day of the period concerned, i.e., the 15th day of the month for ‘early’ and ‘middle’ and the 30th or 31st day of the month for ‘late’. Some articles reported only the number of days from seeding to harvest, without indicating precise dates or months. In these cases, we reported only the number of days from seeding to harvest. We used the expression ‘NA NA NA’ (i.e., ‘Day Month Year’ formatted expression) for both seeding and harvest dates.
‘Crop_Following_Number’ attribute This attribute is used to distinguish preceding crops from following crops in the crop sequence. It takes three values: ‘0’ (i.e., the main crop or the preceding crop, mostly grain legumes), ‘1’ (i.e., the following crop, mostly cereals and oilseeds) and ‘2’ (i.e., the crop after the following crop, mostly cereals and oilseeds). ‘Crop_Multiple_Following_For_Same_Preceding’ attribute Some studies reported results for many different crops and management practices following the same preceding crop. The binary ‘Crop_Multiple_Following_For_Same_Preceding’ attribute was used to identify data associated with the same preceding crop. ‘Crop_Across_Treatment_Averaged_Value’ and ‘Crop_Across_Treatment_Averaged_Value_Type’ attributes For species grown at the same field site during the same growing season, some articles reported only data averaged over combinations of treatments (e.g., cultivar*seeding date*presence of irrigation). We included these data provided that each type of individual treatment was precisely defined in the article. In all cases, we systematically reported whether or not the data were averaged over combinations of SCIENTIFIC DATA | 3:160084 | DOI: 10.1038/sdata.2016.84
7
www.nature.com/sdata/
treatments. When data were averaged over combinations of treatments, the total number of replicates was calculated as the sum of the replicates for each of the treatments for which results were averaged. For articles reporting data for several cultivars of the same species but without data averaging, the data were reported separately for each cultivar. For articles reporting data averaged over several cultivars of the same species, only the averaged data were included in the dataset. The total number of replicates was calculated by multiplying the number of replicates of each cultivar by the total number of cultivars.
‘Crop_Across_Species_Same_Treatment_Value’ and ‘Crop_Across_Species_Same_ Treatment_Value_Type’ attributes In some articles, different types of treatment were applied to species grown at the same site during the same growing season. Each different type of treatment was reported in this case. ‘Crop_Replicate_Number’ attribute As mentioned above, when averaged data were reported in the articles, the number of replicates was equal to the sum of the replicates used to calculate each average. ‘Crop_Yield_Grain’ attribute This attribute corresponds to grain yield data, with a few exceptions. For Brassica chinensis (pak choi), Citrullus lanatus (watermelon), Gossypium hirsutum (upland cotton), Ipomoea batatas (sweet potato) and Solanum lycopersicum (garden tomato), the yields reported are the economic yields. For Arachis hypogaea (peanut), pods are included in grain yields. In all other situations, the yield data given correspond to grain yields. Mutant non-nodulating legume cultivars, shading treatment and under-sowing treatment were excluded from the database. When grain yield data of following crops were confounded between the effect of preceding species and the effect of nitrogen fertilizer dose, these data were also excluded. Data were reported in 96% of all crop*field site*growing season*treatment combinations. Grain yield varied strongly both between grain legume species and between articles for a given species (Fig. 4a). Median grain yield was lowest for Vigna subterranea (bambarra groundnut) and highest for Trigonella foenum-graecum (sicklefruit fenugreek). ‘Crop_Biomass_Aerial’ attribute This attribute corresponds to aerial biomass data. Data were reported in 27% of all crop*field site*growing season*treatment combinations. Aerial biomass varied considerably both between grain legume species and between articles for a given species (Fig. 4b). Median aerial biomass was lowest for Vigna aconitifolia (moth bean) and highest for Trifolium repens (white clover). ‘Crop_Yield_Grain_DM_Percentage’ and ‘Crop_Biomass_Aerial_DM_Percentage’ attributes These two attributes correspond to the percentage of dry matter to which grain yield and aerial biomass correspond, respectively. When only the percentage of dry matter corresponding to aerial biomass was available and grains were included in aerial biomass, we assumed that the grains accounted for the same percentage of dry matter as the aerial biomass. ‘Crop_Harvest_Index’ attribute This attribute was reported in the database to calculate aerial biomass at physiological maturity from grain yield. Data were reported in 4% of all crop*field site*growing season*treatment combinations (Fig. 4c). Median harvest index was lowest for Vicia villosa (winter vetch) and highest for Vicia faba (fababean). ‘Crop_N_Quantity_Grain’ and ‘Crop_N_Quantity_Aerial’ attributes These two attributes correspond to the quantity of nitrogen in grains and aerial components, respectively. For the ‘Crop_N_Quantity_Grain’ attribute, data were reported in 10% of all crop*field site*growing season*treatment combinations. For the ‘Crop_N_Quantity_Aerial’ attribute, data were reported in 10% of all crop*field site*growing season*treatment combinations. As previous attributes, grain and aerial nitrogen quantities varied both between grain legume species and between articles for a given species (Fig. 5a,b). Median grain nitrogen quantity was lowest for Vigna subterranea (bambarra groundnut) and highest for Lupinus albus (white lupine). Median aerial nitrogen quantity was lowest for Vicia narbonensis (purple broad vetch) and highest for Lupinus mutabilis (sweet tarwi). ‘Crop_N_Fixed_Percentage_Aerial’ attribute This attribute corresponds to the percentage of aerial nitrogen fixed by legume species. ‘NA’ was systematically reported for non-legume species. Data were reported in 3% of all crop*field site*growing season*treatment combinations (Fig. 5c). Median fixed aerial nitrogen percentage was lowest for Cajanus cajan (pigeonpea) and highest for Trifolium repens (white clover). SCIENTIFIC DATA | 3:160084 | DOI: 10.1038/sdata.2016.84
8
www.nature.com/sdata/
n=5,118
n=1,432
Trigonella foenum−graecum Lathyrus clymenum Phaseolus lunatus Vicia faba Pisum sativum Lathyrus cicera Lupinus angustifolius Vicia articulata Glycine max Lupinus albus Phaseolus vulgaris Cicer arietinum Arachis hypogaea Vicia narbonensis Vicia sativa Vigna unguiculata Lathyrus aphaca Lens culinaris Lathyrus ochrus Vigna mungo Vicia benghalensis Vicia ervilia Lupinus luteus Lathyrus sativus Vigna angularis Cajanus cajan Lablab purpureus Lupinus atlanticus Vicia pannonica Vigna radiata Vicia hybrida Vicia villosa Cyamopsis tetragonoloba Macrotyloma uniflorum Lupinus pilosus Lupinus mutabilis Vigna aconitifolia Trifolium repens Vigna subterranea
Trifolium repens Lupinus angustifolius Lathyrus cicera Vicia faba Lupinus luteus Pisum sativum Lupinus albus Vicia benghalensis Lathyrus ochrus Cicer arietinum Lupinus mutabilis Cajanus cajan Arachis hypogaea Vicia pannonica Vicia sativa Vicia villosa Lupinus atlanticus Lupinus pilosus Lens culinaris Vigna mungo Vicia ervilia Vigna radiata Glycine max Lathyrus sativus Phaseolus vulgaris Vigna unguiculata Vicia narbonensis Vigna subterranea Cyamopsis tetragonoloba Macrotyloma uniflorum Vigna aconitifolia
0
2
4
6
8
10
12
0
5
−1
10
15
20
25
−1
Grain yield (t ha )
Aerial biomass (t ha )
n=252
Vicia faba Pisum sativum Phaseolus vulgaris Vicia sativa Glycine max Lupinus angustifolius Vicia narbonensis Vicia ervilia Lupinus albus Lathyrus sativus Lathyrus cicera Cicer arietinum Vicia benghalensis Lens culinaris Lathyrus ochrus Arachis hypogaea Vigna unguiculata Vigna radiata Vicia villosa
0.0
0.2
0.4
0.6
0.8
1.0
Harvest index
Figure 4. Distribution of grain yield (t ha − 1) for 39 grain legume species (a), aerial biomass (t ha − 1) for 31 grain legume species (b), and harvest index for 19 grain legume species (c). Distributions are derived using data extracted from the database without additional calculations. Intrabox lines indicate medians, box edges indicate 25th and 75th percentiles, and whiskers indicate minimum and maximum values. The number of observations (n) is also indicated. The scientific names of the species are ranked in descending order of median values.
SCIENTIFIC DATA | 3:160084 | DOI: 10.1038/sdata.2016.84
9
www.nature.com/sdata/
n=354
n=458
Lupinus albus
Lupinus mutabilis
Lupinus angustifolius
Trifolium repens
Vicia faba
Lupinus albus
Lupinus luteus
Lablab purpureus
Pisum sativum
Vicia faba
Lens culinaris
Lupinus luteus
Cicer arietinum
Vicia benghalensis
Glycine max
Pisum sativum
Lathyrus sativus
Lens culinaris
Lupinus mutabilis
Lupinus angustifolius
Vicia benghalensis
Phaseolus vulgaris
Vigna radiata
Glycine max
Vicia narbonensis
Arachis hypogaea
Vicia sativa
Vigna mungo
Lablab purpureus
Cajanus cajan
Vigna angularis
Phaseolus lunatus
Arachis hypogaea Vigna unguiculata
Vigna radiata
Cajanus cajan
Vigna subterranea
Vigna mungo
Cicer arietinum
Phaseolus vulgaris
Vigna unguiculata
Phaseolus lunatus
Lathyrus sativus
Trifolium repens
Vicia sativa
Vigna subterranea
Vicia narbonensis
0
100
200
300
400
500
600
0
−1
100
200
300
400
500
600
−1
Grain nitrogen (kg ha )
Aerial nitrogen (kg ha )
n=246
Trifolium repens Lupinus luteus Vicia faba Lupinus albus Lens culinaris Lupinus angustifolius Pisum sativum Cicer arietinum Arachis hypogaea Glycine max Vigna subterranea Vigna radiata Vigna unguiculata Vigna mungo Cajanus cajan
0
20
40
60
80
100
Fixed aerial nitrogen (%)
Figure 5. Distribution of grain nitrogen (kg ha − 1) for 24 grain legume species (a), aerial nitrogen (kg ha − 1) for 23 grain legume species (b), and fixed aerial nitrogen (%) for 15 grain legume species (c). Distributions are derived using data extracted from the database without additional calculations. Intrabox lines indicate medians, box edges indicate 25th and 75th percentiles, and whiskers indicate minimum and maximum values. The number of observations (n) is also indicated. The scientific names of the species are ranked in descending order of median values.
SCIENTIFIC DATA | 3:160084 | DOI: 10.1038/sdata.2016.84
10
www.nature.com/sdata/ ‘Crop_N_Fixed_Percentage_Aerial_Method’ and ‘Crop_N_Fixed_Percentage_Aerial_ Reference_Species’ attributes These two attributes correspond to the method used to determine the percentage of aerial nitrogen fixed by legume species (e.g., the 15N isotope dilution method or the A-value method), and the scientific name of the non-fixing reference species. Some articles used a legume reference species rather than a non-legume reference species. In all cases, the legume reference species was a mutant non-nodulating legume cultivar that did not fix atmospheric nitrogen. ‘Crop_Biomass_Aerial_Stage_Detailed’, ‘Crop_Biomass_Aerial_Stage_Simplified’, ‘Crop_N_Fixed_Percentage_Aerial_Stage_Detailed’ and ‘Crop_N_Fixed_Percentage_ Aerial_Stage_Simplified’ attributes These attributes correspond to the phenological stages at which aerial biomass and the percentage of fixed aerial nitrogen (or the quantity of fixed aerial nitrogen with the ‘Crop_N_Fixed_Quantity_Aerial’ attribute) were determined. The ‘Crop_Biomass_Aerial_Stage_Detailed’ and ‘Crop_N_Fixed_Percentage_ Aerial_Stage_Detailed’ attributes correspond to the detailed phenological stage originally stated in the article. The ‘Crop_Biomass_Aerial_Stage_Simplified’ and ‘Crop_N_Fixed_Percentage_Aerial_Stage_ Simplified’ attributes correspond to a simplified phenological stage divided into ‘Before physiological maturity’ and ‘Physiological maturity’. ‘Crop_Protein_Quantity_Percentage_Grain’ attribute This attribute corresponds to the percentage or the quantity of protein in grains. In the selected articles, these protein contents were often calculated by multiplying the percentage or the quantity of nitrogen in grains by a constant. However, this constant differed between articles. Note that only a few articles referred to the percentage or the quantity of protein. We reported the percentage or the quantity of protein in grains independently of the percentage or the quantity of nitrogen in grains. ‘Crop_N_Balance_Simplified’ attribute This attribute corresponds to the simplified nitrogen balance originally calculated in the articles (e.g., the difference between the quantity of nitrogen in grains and the quantity of fixed aerial nitrogen). Nitrogen balance data were only reported if the attributes used to calculate them were not directly available from raw data (e.g., the quantity of nitrogen in grains and the quantity of fixed aerial nitrogen). This was the case for only three articles. ‘Crop_N_Soil_Quantity_Percentage_Seeding’ and ‘Crop_N_Soil_Quantity_Percentage_ Harvest’ attributes These two attributes correspond to the percentage or the quantity of soil nitrogen at seeding and at harvest, respectively. ‘Crop_N_Soil_Quantity_Percentage_Seeding_Type’, ‘Crop_N_Soil_Quantity_Percentage_ Seeding_Depth’, ‘Crop_N_Soil_Quantity_Percentage_Seeding_Date’, ‘Crop_N_Soil_ Quantity_Percentage_Harvest_Type’, ‘Crop_N_Soil_Quantity_Percentage_Harvest_Depth’ and ‘Crop_N_Soil_Quantity_Percentage_Harvest_Date’ attributes These attributes correspond to (i) the type of nitrogen (e.g., nitrogen or nitrate or mineral), (ii) the depth of soil used to determine the percentage or the quantity of soil nitrogen and (iii) the date at which soil measurements were made. These attributes were reported at both seeding and harvest. ‘Crop_Water_Use_Balance’ attribute This attribute corresponds to the water use or the water balance, according to the equation given in the selected articles. Data were reported in 6% of all crop*field site*growing season*treatment combinations. Water use (or water balance) varied both between grain legume species and between articles for a given species (Fig. 6). Median water use (or water balance) was lowest for Vigna aconitifolia (moth bean) and highest for Lablab purpureus (hyacinthbean). ‘Crop_Harvest_Index’, ‘Crop_N_Percentage_Grain’, ‘Crop_N_Percentage_Aerial’, ‘Crop_N_ Harvest_Index’, ‘Crop_N_Fixed_Quantity_Aerial’, ‘Crop_Water_Use_Balance_Efficiency_ Grain’ and ‘Crop_Water_Use_Balance_Efficiency_Aerial’ attributes These seven attributes were reported in the database to calculate missing data: aerial biomass, quantity of nitrogen in grains, quantity of nitrogen in aerial components, percentage of fixed aerial nitrogen, and water use. SCIENTIFIC DATA | 3:160084 | DOI: 10.1038/sdata.2016.84
11
www.nature.com/sdata/
n=324 Lablab purpureus Cajanus cajan Vicia faba Lupinus angustifolius Lens culinaris Pisum sativum Vigna mungo Cicer arietinum Arachis hypogaea Lathyrus sativus Phaseolus vulgaris Glycine max Vigna unguiculata Macrotyloma uniflorum Vigna radiata Vicia sativa Cyamopsis tetragonoloba Vigna aconitifolia
0
200
400
600
800
1000
Water use (mm)
Figure 6. Distribution of water use (mm) for 18 grain legume species. Water use is calculated using different types of equations, indicated within the ‘Crop_Water_Use_Balance_Equation’ attribute. The distribution is derived using data extracted from the database without additional calculations. Intrabox lines indicate medians, box edges indicate 25th and 75th percentiles, and whiskers indicate minimum and maximum values. The number of observations (n) is also indicated. The scientific names of the species are ranked in descending order of median values.
‘Crop_Biomass_Aerial_Definition’, ‘Crop_N_Percentage_Aerial_Definition’, ‘Crop_N_ Quantity_Aerial_Definition’, ‘Crop_N_Fixed_Quantity_Aerial_Definition’ and ‘Crop_Water_ Use_Balance_Efficiency_Aerial_Definition’ attributes Different aerial components were included in the aerial biomass, the percentage or the quantity of aerial nitrogen, and the efficiency of aerial water use or aerial water balance. These five attributes were used to determine the aerial components originally reported in the articles. When the ‘shoot’, ‘straw’ and ‘stubble’ terms were used to define the aerial components in the articles, we assumed that the grains were not included in the aerial components. This information was reported for (i) the aerial biomass in the ‘Crop_Biomass_Aerial_Definition’ attribute, (ii) the percentage of aerial nitrogen in the ‘Crop_N_Percentage_Aerial_Definition’ attribute, (iii) the quantity of aerial nitrogen in the ‘Crop_N_Quantity_Aerial_Definition’ attribute, (iv) the quantity of fixed aerial nitrogen in the ‘Crop_N_Fixed_Quantity_Aerial_Definition’ attribute, and (v) the efficiency of aerial water use or aerial water balance in the ‘Crop_Water_Use_Balance_Efficiency_Aerial_Definition’ attribute. ‘Crop_N_Balance_Simplified_Equation’ and ‘Crop_Water_Use_Balance_Equation’ attributes For these two attributes, we reported the equations used to calculate simplified nitrogen balance and water use or water balance, respectively. Attributes relating to error terms and error types When available, we systematically reported error terms and error types associated with data about grain yield, aerial biomass, crop nitrogen content, residual soil nitrogen content and water use. For the ‘Crop_Yield_Grain’ attribute, the ‘Crop_Yield_Grain_Error’ attribute indicates the error term and the ‘Crop_Yield_Grain_Error_Type’ attribute indicates the error type for a given item of grain yield data for a given crop in the ‘Crop’ table. Error terms and error types were reported as raw data. For instance, when an article reported the error type as Fisher's Least Significant Difference, the data were directly reported as Fisher's Least Significant Difference. Unidentified error bars digitized from graphs were assumed to represent standard errors. When available, the numbers of replicates were also reported. For SCIENTIFIC DATA | 3:160084 | DOI: 10.1038/sdata.2016.84
12
www.nature.com/sdata/
48% of grain yields, both error terms and the numbers of replicates were reported. For 47% of grain yields, only the number of replicates was reported.
Technical Validation Each article was read carefully at least three times by the same person, to determine the type and the quantity of data reported by the authors. Once the data had been extracted, all the data reported in the tables were checked at least three times by the same person, to identify possible mistakes. SQL subset queries were systematically performed, to check the structural validity and coherence of class, numerical, index, binary and date attributes within each table, and to check the relationships between ‘mother’ and ‘child’ tables. Once the set of data was complete, SQL queries were carried out, to compare the entire content of the database with the original data reported in the selected articles. We systematically and manually checked for outliers in order to detect possible mistakes made during data extraction. We returned to the original articles as many times as needed to check the accuracy of the data. We checked the qualitative and quantitative contents of all class, numerical, index, binary and date attributes by importing each table in turn into the R software (version 3.2, https://cran.r-project.org/), and by visualizing data distribution for each attribute in turn. When the meaning of the data reported in the articles was unclear, authors were directly contacted and asked to provide additional information about their experimental protocols. Authors were also asked to provide additional data, particularly if large numbers of treatments had been averaged in their articles. Overall, 17 authors provided us with additional information and raw data (see the Acknowledgements section).
Usage Notes The dataset is based on a compilation of experimental data published in 173 articles over the last 50 years. To our knowledge, this dataset is unique and constitutes the most comprehensive agronomic dataset for grain legume crops worldwide. The dataset can be analyzed to assess performances for a broad diversity of grain legume species, and to provide global rankings for these species in terms of grain yield, aerial biomass, harvest index, aerial nitrogen fixation, nitrogen content in aerial components, nitrogen balance, and water use. It can also be used to assess the effect of including different grain legumes as preceding crops, before cereals and oilseeds in the same crop sequences. Global species rankings were recently estimated for energy crops188, but never for grain legumes. Rankings of grain legume species could be directly derived from our dataset by using standard meta-analysis methods based on random-effect models188. Attributes describing environmental factors (e.g., climate conditions and soil types) and management practices (e.g., tillage, fertilization, pest management and irrigation) can be used to analyze the variability of grain legume performances over field sites, growing seasons, and management practices. Our dataset covers several contrasted geographical areas. It can be used to target suitable grain legume species for cultivation in particular pedoclimatic conditions. In the context of climate change, the database represents a useful resource to assess comparatively the production of grain legume species in drought-prone environments, or to identify innovative agricultural techniques for improving grain legume cultivation under yield-limiting abiotic and biotic stresses. Subsets of the dataset can be used to address regional issues. Figure 7 presents six regional networks including the pairs of grain legume species frequently compared at the same field sites during the same growing seasons, and the grain legume species that were not frequently compared with each other. Such networks can be used to identify the species for which reliable comparisons are feasible, and those for which limited data are available. A quantitative analysis can then be computed to determine regional rankings of grain legume species. This approach could be used to identify highly productive species, and to compare them with major regional grain legume crops (e.g., garden pea in Europe or soybean in North America). Our dataset could thus shed new light on the potential value of as yet underused grain legumes from regional to global scales. As geographical coordinates of the experiments were systematically reported, our dataset can be connected to large-scale climate and soil maps, and to Geographic Information Systems. An example is shown in Fig. 1 where the Köppen-Geiger climatic classification was indicated for field sites included in the database. Similar maps could be easily produced using other global classification of agroecological zones (e.g., the Global Agro-Ecological Zones Data Portal, http://gaez.fao.org/Main.html#), or soil typology (e.g., the Soils Portal of the Food and Agriculture Organization of the United Nations, http:// www.fao.org/soils-portal/soil-survey/soil-maps-and-databases/harmonized-world-soil-database-v12/en/). The dataset is also useful for comparing productivity levels of native and non-native grain legume species used as raw materials for food and feed across diverse geographic regions. Grain yield data can be converted into crude protein or energy contents metabolizable for livestock animals (e.g., pigs and poultry) using, for example, the Feedipedia Animal Feed Resources Information System (http://www. feedipedia.org/). In the future, the dataset could be expanded in different ways. Results of new experiments comparing grain legume species can be easily included in our database. So far, we focused on legume species produced for grains, but legume grown for forage can also be included in the database without changing the relational database structure. In many world regions such as Africa, Asia and South America, agricultural grain legumes are frequently intercropped. Data collected in intercropping experiments could SCIENTIFIC DATA | 3:160084 | DOI: 10.1038/sdata.2016.84
13
www.nature.com/sdata/
Africa
Europe
Asia
CC
CC
VR
LCi CT
GM VU
VSa
AH VR
VAc
AH
VU
VM
VB
CA
PV
LPu GM
LL
VP
VSu LO
CA
VF
PS
LCu
VF LAn
MU
PV
PL
LCu
PS
LM VV VSa
LS
PS
LS
LAl
VE VN
CA
Oceania
North America PL
GM
CT
VAr
GM
South America VU
VM
VU LAt
VU
LCl
CC
AH
PV
LS
LAl
TFG
LPi
CC LAl
GM LAn
VR
GM AH
LL VF
CT
PV
LO
LAp
VR
VSa VN
VV
CA PS
LCu LAl
LCi
LL
LS
LPu
PS
VE PS LCu
VF
TR
VH
LAn
VB
LAl
AH VAn
CA
LAn
Figure 7. Regional networks of grain legume species included in the database. The regions considered are: (a) Africa, (b) Asia, (c) Europe, (d), North America (e) Oceania, and (f) South America. The links represent the pairs of species grown simultaneously at the same field sites during the same growing seasons. The thickness of the links increases with the number of field sites and the number of growing seasons over which the species are compared. The three most widely cropped grain legume species in each region over the 1961–2014 period, according to the crop classification and crop data from the Statistics Division of Food and Agriculture Organization of the United Nations22, are indicated as nodes in dark blue. The three most frequently compared grain legume species in the experimental dataset are indicated, by region, with light blue edges. The scientific names of grain legume species are abbreviated: AH, Arachis hypogaea; CA, Cicer arietinum; CC, Cajanus cajan; CT, Cyamopsis tetragonoloba; GM, Glycine max; LAl, Lupinus albus; LAn, Lupinus angustifolius; LAp, Lathyrus aphaca; LAt, Lupinus atlanticus; LCi, Lathyrus cicera; LCl, Lathyrus clymenum; LCu, Lens culinaris; LL, Lupinus luteus; LM, Lupinus mutabilis; LO, Lathyrus ochrus; LPi, Lupinus pilosus; LPu, Lablab purpureus; LS, Lathyrus sativus; MU, Macrotyloma uniflorum; PL, Phaseolus lunatus; PS, Pisum sativum; PV, Phaseolus vulgaris; TFG, Trigonella foenum-graecum; TR, Trifolium repens; VAc, Vigna aconitifolia; VAn, Vigna angularis; VAr, Vicia articulata; VB, Vicia benghalensis; VE, Vicia ervilia; VF, Vicia faba; VH, Vicia hybrida; VM, Vigna mungo; VN, Vicia narbonensis; VP, Vicia pannonica; VR, Vigna radiata; VSa, Vicia sativa; VSu, Vigna subterranea; VU, Vigna unguiculata; VV, Vicia villosa.
be further included in our dataset. Note that the relational structure of the database is relatively coercive, and should be modified with great care. The addition of a new table can have consequences on the relational framework and the cardinality relationships. But new data or new attributes can be easily incremented in existing tables. The CSV format is well adapted for analyzing data using standard statistical softwares such as the R software (https://cran.r-project.org/). However, because of the cascade path between tables and of the cardinality relationships between attributes (Fig. 3), data extraction can be easily performed using SQL queries. An example of query is presented below for extracting binary data indicating absence (‘0’) or presence (‘1’) of tillage management for grain legume species included in the article indexed ‘29’ in our dataset: SELECT IDCrop, Crop_Species_Scientific_Name, IDTillage, Tillage_Presence_Tillage FROM Article, Site, Crop_Sequence_Trt, Crop, Tillage WHERE identifiant = identifiant_Paper SCIENTIFIC DATA | 3:160084 | DOI: 10.1038/sdata.2016.84
14
www.nature.com/sdata/
AND AND AND AND
IDSite = IDSite_Site IDRotation = IDRotation_CropSystem IDCrop = Tillage.IDCrop_Crop identifiant = '29'
The result of the SQL query is: IDCrop, Crop_Species_Scientific_Name, IDTillage, Tillage_Presence_Tillage 853 Cicer arietinum 849 1 854 Vicia faba 851 1 857 Lens culinaris 856 1 858 Pisum sativum 858 1 859 Cicer arietinum 860 1 860 Vicia faba 861 1 861 Lens culinaris 862 1 862 Pisum sativum 863 1 864 Cicer arietinum 864 1 865 Vicia faba 865 1 866 Lens culinaris 866 1 867 Pisum sativum 867 1 869 Cicer arietinum 868 1 870 Vicia faba 870 1 871 Lens culinaris 871 1 872 Pisum sativum 872 1 873 Cicer arietinum 873 0 874 Vicia faba 874 0 875 Lens culinaris 875 0 876 Pisum sativum 876 0 877 Cicer arietinum 877 0 878 Vicia faba 878 0 879 Lens culinaris 879 0 880 Pisum sativum 880 0 881 Cicer arietinum 881 0 882 Vicia faba 882 0 883 Lens culinaris 883 0 884 Pisum sativum 884 0 885 Cicer arietinum 885 0 887 Vicia faba 886 0 888 Lens culinaris 887 0 890 Pisum sativum 889 0 Other examples of SQL queries are shown in the TXT-formatted file entitled ‘Examples_SQL_Queries. txt’, downloadable from Dryad Digital Repository (Data Citation 1).
References 1. Vollmann, J. Soybean versus other food grain legumes: a critical appraisal of the United Nations International Year of Pulses 2016. Bodenkultur 67, 17–24 (2016). 2. Armstrong, E. L., Heenan, D. P., Pate, J. S. & Unkovich, M. J. Nitrogen benefits of lupins, field pea, and chickpea to wheat production in south-eastern Australia. Aust. J. Agr. Res. 48, 39–47 (1997). 3. Ahmad, T., Hafeez, F. Y., Mahmood, T. & Malik, K. A. Residual effect of nitrogen fixed by mungbean (Vigna radiata) and blackgram (Vigna mungo) on subsequent rice and wheat crops. Aust. J. Exp. Agr. 41, 245–248 (2001). 4. Bado, B. V., Bationo, A. & Cescas, M. P. Assessment of cowpea and groundnut contributions to soil fertility and succeeding sorghum yields in the Guinean savannah zone of Burkina Faso (west Africa). Biol. Fert. Soils 43, 171–176 (2006). 5. Duranti, M. Grain legume proteins and nutraceutical properties. Fitoterapia 77, 67–82 (2006). 6. Lizarazo, C. I. et al. Nutritive quality and protein production from grain legumes in a boreal climate. J. Sci. Food Agr. 95, 2053–2064 (2014). 7. Reckling, M. et al. Trade-offs between economic and environmental impacts of introducing legumes into cropping systems. Front. Plant Sci. 7, 669 (2016). 8. Asif, M., Rooney, L. W., Ali, R. & Riaz, M. N. Application and opportunities of pulses in food system: a review. Crit. Rev. Food Sci. Nutr. 53, 1168–1179 (2013). 9. Mudryj, A. N., Yu, N. & Aukema, H. M. Nutritional and health benefits of pulses. Appl. Physiol. Nutr. Metab. 39, 1197–1204 (2014). 10. Temba, M. C., Njobeh, P. B., Adebo, O. A., Olugbile, A. O. & Kayitesi, E. The role of compositing cereals with legumes to alleviate protein energy malnutrition in Africa. Int. J. Food Sci. Tech. 51, 543–554 (2016). 11. Jezierny, D., Mosenthin, R. & Bauer, E. The use of grain legumes as a protein source in pig nutrition: a review. Anim. Feed Sci. Tech. 157, 111–128 (2010). 12. Martens, S. D., Tiemann, T. T., Bindelle, J., Peters, M. & Lascano, C. E. Alternative plant protein sources for pigs and chickens in the tropics—nutritional value and constraints: a review. J. Agr. Rural Dev. Trop. 113, 101–123 (2012). 13. Koivunen, E. et al. Digestibility and energy value of pea (Pisum sativum L.), faba bean (Vicia faba L.) and blue lupin (narrow-leaf) (Lupinus angustifolius) seeds in broilers. Anim. Feed Sci. Tech. 218, 120–127 (2016).
SCIENTIFIC DATA | 3:160084 | DOI: 10.1038/sdata.2016.84
15
www.nature.com/sdata/
14. Badaruddin, M. & Meyer, D. W. Grain legume effects on soil nitrogen, grain yield, and nitrogen nutrition of wheat. Crop Sci. 34, 1304–1309 (1994). 15. Jawale, S. M., Jadhav, A. S. & Patil, V. G. Productivity and economics of legumes-winter sorghum (Sorghum bicolor) double cropping systems under tillage practices in western Maharashtra. Indian J. Agron. 43, 396–403 (1998). 16. Bloem, A. A. & Barnard, R. O. Effect of annual legumes on soil nitrogen and on the subsequent yield of maize and grain sorghum. S. Afr. J. Plant Soil 18, 56–61 (2001). 17. Cheruiyot, E. K., Mumera, L. M., Nakhone, L. N. & Mwonga, S. M. Effect of legume-managed fallow on weeds and soil nitrogen in following maize (Zea mays L.) and wheat (Triticum aestivum L.) crops in the Rift Valley highlands of Kenya. Aust. J. Exp. Agr. 43, 597–604 (2003). 18. Espinoza, S. et al. Contribution of legumes to wheat productivity in Mediterranean environments of central Chile. Field Crop. Res. 133, 150–159 (2012). 19. Williams, C. M. et al. Effects of three pulse crops on subsequent barley, canola, and wheat. Agron. J. 106, 343–350 (2014). 20. Yahara, T. et al. Global legume diversity assessment : concepts, key indicators, and strategies. Taxon 62, 249–266 (2013). 21. Smýkal, P. et al. Legume crops phylogeny and genetic diversity for science and breeding. Crit. Rev. Plant Sci. 34, 43–104 (2015). 22. Statistics Division of Food and Agriculture Organization of the United Nations (FAOSTAT). http://faostat3.fao.org/home/E/ (2016). 23. Abd El Moneim, A. M., Khair, M. A. & Cocks, P. S. Growth analysis, herbage and seed yield of certain forage legume species under rainfed conditions. J. Agron. Crop Sci. 164, 34–41 (1990). 24. Abd El Moneim, A. M. Agronomic potential of three vetches (Vicia spp.) under rainfed conditions. J. Agron. Crop Sci. 170, 113–120 (1993). 25. Adela, J., Simona, N., Gheorghe, D., Pîrşan, P. & Alda, S. The behaviour of some varieties of pea, soybean and lentils concerning the relationship bacterization-sowing period on the yield and quality in Timiş Plain. Res. J. Agr. Sci. 42, 82–87 (2010). 26. Al-Thahabi, S. A., Yasin, J. Z., Abu-Irmaileh, B. E., Haddad, N. I. & Saxena, M. C. Effect of weed removal on productivity of chickpea (Cicer arietinum L.) and lentil (Lens culinaris Med.) in a Mediterranean environment. J. Agron. Crop Sci. 172, 333–341 (1994). 27. Anderson, R. L., Tanaka, D. L. & Merrill, S. D. Yield and water use of broadleaf crops in a semiarid climate. Agr. Water Manage. 58, 255–266 (2003). 28. Angadi, S. V. et al. Adaptation of alternative pulse and oilseed crops to the semiarid Canadian prairie: seed yield and water use efficiency. Can. J. Plant Sci. 88, 425–438 (2008). 29. Annicchiarico, P. Adaptation of cool-season grain legume species across climatically-contrasting environments of southern Europe. Agron. J. 100, 1647–1654 (2008). 30. Avola, G., Tuttobene, R., Gresta, F. & Abbate, V. Weed control strategies for grain legumes. Agron. Sustain. Dev. 28, 389–395 (2008). 31. Ayaz, S., McKenzie, B. A., Hill, G. D. & McNeil, D. L. Variability in yield of four grain legume species in a subhumid temperate environment I. Yields and harvest index. J. Agr. Sci. 142, 9–19 (2004). 32. Bailey, K. L., Gossen, B. D., Derksen, D. A. & Watson, P. R. Impact of agronomic practices and environment on diseases of wheat and lentil in southeastern Saskatchewan. Can. J. Plant Sci. 80, 917–927 (2000). 33. Baroowa, B., Gogoi, N., Paul, S. & Sarma, B. Morphological responses of pulse (Vigna spp.) crops to soil water deficit. Belgrade J. Agr. Sci. 57, 31–40 (2012). 34. Beck, D. P., Wery, J., Saxena, M. C. & Ayadi, A. Dinitrogen fixation and nitrogen-balance in cool-season food legumes. Agron. J. 83, 334–341 (1991). 35. Bharambe, P. R., Sondge, V. D., Rodge, R. P. & Oza, S. R. Performance of different crop sequences under various levels of irrigation in Vertisols. Indian J. Agr. Sci. 60, 402–405 (1990). 36. Boddey, R. M., Urquiaga, S., Neves, M. C. P., Suhet, A. R. & Peres, J. R. Quantification of the contribution of N2 fixation to field-grown grain legumes–A strategy for the practical application of the 15N isotope dilution technique. Soil Biol. Biochem. 22, 649–655 (1990). 37. Bolland, M. D. A., Siddique, K. H. M., Loss, S. P. & Baker, M. J. Comparing responses of grain legumes, wheat and canola to applications of superphosphate. Nutr. Cycl. Agroecosys. 53, 157–175 (1999). 38. Borowska, M., Prusinski, J. & Kaszkowiak, E. Production results of intensification of cultivation technologies in three lupin (Lupinus L.) species. Plant Soil Environ. 61, 426–431 (2015). 39. Brennan, R. F., Bolland, M. D. A. & Shea, G. Comparing how Lupinus angustifolius and Lupinus luteus use zinc fertilizer for seed production. Nutr. Cycl. Agroecosys. 59, 209–217 (2001). 40. Brennan, R. F. & French, R. J. Grain yield and cadmium concentration of a range of grain legume species grown on two soil types at Merredin, western Australia. Aust. J. Exp. Agr. 45, 1167–1172 (2005). 41. Calderón, F. J., Vigil, M. F., Nielsen, D. C., Benjamin, J. G. & Poss, D. J. Water use and yields of no-till managed dryland grasspea and yellow pea under different planting configurations. Field Crop. Res. 125, 179–185 (2012). 42. Chemining’wa, G. N., Muthomi, J. W. & Theuri, S. W. M. Effect of rhizobia inoculation and starter-N on nodulation, shoot biomass and yield of grain legumes. Asian J. Plant Sci. 6, 1113–1118 (2007). 43. Chen, C. et al. Winter pea and lentil response to seeding date and micro- and macro-environments. Agron. J. 98, 1655–1663 (2006). 44. Christiansen, S., Ryan, J. & Singh, M. Forage and food legumes in a multi-year, wheat-based rotation under drought-stressed conditions in northern Syria’s medium rainfall zone. J. Agron. Crop Sci. 197, 146–154 (2011). 45. Christiansen, S. et al. Potential legume alternatives to fallow and wheat monoculture for Mediterranean environments. Crop Pasture Sci. 66, 113–121 (2015). 46. Cutforth, H. W., McConkey, B. G., Ulrich, D., Miller, P. R. & Angadi, S. V. Yield and water use efficiency of pulses seeded directly into standing stubble in the semiarid Canadian prairie. Can. J. Plant Sci. 82, 681–686 (2002). 47. Dakora, F. D., Aboyinga, R. A., Mahama, Y. & Apaseku, J. Assessment of N2 fixation in groundnut (Arachis hypogaea L.) and cowpea (Vigna unguiculata L. Walp.) and their relative N contribution to a succeeding maize crop in northern Ghana. MIRCEN J. Appl. Microb. 3, 389–399 (1987). 48. De, R., Rao, Y. Y. & Ali, W. Grain and fodder legumes as preceding crops affecting the yield and N economy of rice. J. Agr. Sci. 101, 463–466 (1983). 49. Debaeke, P. & Hilaire, A. Production of rainfed and irrigated crops under different crop rotations and input levels in southwestern France. Can. J. Plant Sci. 77, 539–548 (1997). 50. Devries, J. D., Bennett, J. M., Boote, K. J., Albrecht, S. L. & Maliro, C. E. Nitrogen accumulation and partitioning by three grain legumes in response to soil water deficits. Field Crop. Res. 22, 33–44 (1989). 51. Eaglesham, A. R. J., Ayanaba, A., Rao, V. R. & Eskew, D. L. Mineral N effects on cowpea and soybean crops in a Nigerian soil I. Development, nodulation, acetylene reduction and grain yield. Plant Soil 68, 171–181 (1982).
SCIENTIFIC DATA | 3:160084 | DOI: 10.1038/sdata.2016.84
16
www.nature.com/sdata/
52. Enyi, B. A. C. An analysis of the effect of weed competition on growth and yield attributes in sorghum (Sorghum vulgare), cowpeas (Vigna unguiculata) and green gram (Vigna aureus). J. Agr. Sci. 81, 449–453 (1973). 53. Estevez de Jensen, C., Kurle, J. E. & Percich, J. A. Integrated management of edaphic and biotic factors limiting yield of irrigated soybean and dry bean in Minnesota. Field Crop. Res. 86, 211–224 (2004). 54. Fernandez, A. L., Sheaffer, C. C., Wyse, D. L. & Michaels, T. E. Yield and weed abundance in early- and late-sown field pea and lentil. Agron. J. 104, 1056–1064 (2012). 55. French, R. J. & Ewing, M. A. Soil type influences the relative yields of different cereals and crop legumes in the western Australian wheat-belt. Aust. J. Exp. Agr. 29, 829–835 (1989). 56. French, R. J., Sweetingham, M. W. & Shea, G. G. A comparison of the adaptation of yellow lupin (Lupinus luteus L.) and narrow-leafed lupin (L. angustifolius L.) to acid sandplain soils in low rainfall agricultural areas of western Australia. Aust. J. Agr. Res. 52, 945–954 (2001). 57. Gan, Y. T., Miller, P. R., Liu, P. H., Stevenson, F. C. & McDonald, C. L. Seedling emergence, pod development, and seed yields of chickpea and dry pea in a semiarid environment. Can. J. Plant Sci. 82, 531–537 (2002). 58. Gan, Y., Campbell, C. A., Liu, L., Basnyat, P. & McDonald, C. L. Water use and distribution profile under pulse and oilseed crops in semiarid northern high latitude areas. Agr. Water Manage. 96, 337–348 (2009). 59. Ghosh, P. K. & Singh, N. P. Production potential of summer legumes-maize (Zea mays) sequence under varying levels of nitrogen. Indian J. Agron. 41, 525–528 (1996). 60. Ghosh, P. K., Dayal, D., Mandal, K. G., Wanjari, R. H. & Hati, K. M. Optimization of fertilizer schedules in fallow and groundnut-based cropping systems and an assessment of system sustainability. Field Crop. Res. 80, 83–98 (2003). 61. Gregory, P. J. Alternative crops for Duplex soils: growth and water use of some cereal, legume, and oilseed crops, and pastures. Aust. J. Agr. Res. 49, 21–32 (1998). 62. Gül, I.,̇ Yildirim, M., Akinci, C., Doran, I.̇ & Kiliç, H. Response of silage maize (Zea mays L.) to nitrogen fertilizer after different crops in a semi arid environment. Turk. J. Agr. For. 32, 513–520 (2008). 63. Gupta, J. P. & Gupta, G. N. Effect of grass mulching on growth and yield of legumes. Agr. Water Manage. 6, 375–383 (1983). 64. Hanbury, C. D., Siddique, K. H. M., Galwey, N. W. & Cocks, P. S. Genotype-environment interaction for seed yield and ODAP concentration of Lathyrus sativus L. and L. cicera L. in Mediterranean-type environments. Euphytica 110, 45–60 (1999). 65. Hatch, D. J., Joynes, A. & Stone, A. Nitrogen uptake in organically managed spring sown lupins and residual effects on leaching and yield of a following winter cereal. Soil Use Manage. 26, 21–26 (2010). 66. Hauggaard-Nielsen, H., Mundus, S. & Jensen, E. S. Nitrogen dynamics following grain legumes and subsequent catch crops and the effects on succeeding cereal crops. Nutr. Cycl. Agroecosys. 84, 281–291 (2009). 67. Hauggaard-Nielsen, H., Mundus, S. & Jensen, E. S. Grass-clover undersowing affects nitrogen dynamics in a grain legume-cereal arable cropping system. Field Crop. Res. 136, 23–31 (2012). 68. Hayat, R. & Ali, S. Potential of summer legumes to fix nitrogen and benefit wheat crop under rainfed condition. J. Agron. 3, 273–281 (2004). 69. Hayat, R. & Ali, S. Nitrogen fixation of legumes and yield of wheat under legumes-wheat rotation in Pothwar. Pak. J. Bot. 42, 2317–2326 (2010). 70. Haynes, R. J., Martin, R. J. & Goh, K. M. Nitrogen fixation, accumulation of soil nitrogen and nitrogen balance for some field-grown legume crops. Field Crop. Res. 35, 85–92 (1993). 71. Heenan, D. P. Effects of sowing time on growth and grain yield of lupin and field pea in south-eastern New South Wales. Aust. J. Exp. Agr. 34, 1137–1142 (1994). 72. Henry, J. L., Slinkard, A. E. & Hogg, T. J. The effect of phosphorus fertilizer on establishment, yield and quality of pea, lentil and faba bean. Can. J. Plant Sci. 75, 395–398 (1995). 73. Herridge, D. F. & Holland, J. F. Production of summer crops in northern New South Wales. I. Effects of tillage and double cropping on growth, grain and N yields of six crops. Aust. J. Agr. Res. 43, 105–122 (1992). 74. Hodgson, A. S., Holland, J. F. & Rayner, P. Effects of field slope and duration of furrow irrigation on growth and yield of six grain-legumes on a waterlogging-prone Vertisol. Field Crop. Res. 22, 165–180 (1989). 75. Imai, H., Kamata, K., Ma, C.-H. & Yang, Y.-F. Developing improved cropping systems for vegetables and legumes in the tropics 1. Assessment of cropping sequences in terms of yields. Jpn. J. Trop. Agr. 33, 106–115 (1989). 76. Khan, D. F. et al. Effects of below-ground nitrogen on N balances of field-grown fababean, chickpea, and barley. Aust. J. Agr. Res. 54, 333–340 (2003). 77. Jat, R. A., Dungrani, R. A., Arvadia, M. K. & Sahrawat, K. L. Diversification of rice (Oryza sativa L.)-based cropping systems for higher productivity, resource-use efficiency and economic returns in south Gujarat, India. Arch. Agron. Soil Sci. 58, 561–572 (2012). 78. Jemo, M. et al. Phosphorus benefits from grain-legume crops to subsequent maize grown on acid soils of southern Cameroon. Plant Soil 284, 385–397 (2006). 79. Jensen, E. S. Symbiotic N2 fixation in pea and field bean estimated by 15N fertilizer dilution in field experiments with barley as a reference crop. Plant Soil 92, 3–13 (1986). 80. Jensen, C. R. et al. The effect of lupins as compared with peas and oats on the yield of the subsequent winter barley crop. Eur. J. Agron. 20, 405–418 (2004). 81. Jessop, R. S. & Mahoney, J. The effect of soil nitrogen on grain legume yield and nitrogen fixation. J. Agr. Sci. 105, 231–236 (1985). 82. Jones, M. J. & Singh, M. Yields of crop dry matter and nitrogen in long-term barley rotation trials at two sites in northern Syria. J. Agr. Sci. 124, 389–402 (1995). 83. Jones, M. J. & Singh, M. Long-term yield patterns in barley-based cropping systems in northern Syria. 2. The role of feed legumes. J. Agr. Sci. 135, 237–249 (2000). 84. Kaizzi, K. C. et al. Optimizing smallholder returns to fertilizer use: bean, soybean and groundnut. Field Crop. Res. 127, 109–119 (2012). 85. Kang, S., McKenzie, B. A. & Hill, G. D. Effect of irrigation on growth and yield of Kabuli chickpea (Cicer arietinum L.) and narrow-leafed lupin (Lupinus angustifolius L.). Agron. N. Z. J. 38, 11–32 (2008). 86. Kar, G. & Kumar, A. Evaluation of post-rainy season crops with residual soil moisture and different tillage methods in rice fallow of eastern India. Agr. Water Manage. 96, 931–938 (2009). 87. Karrou, M. & Oweis, T. Water and land productivities of wheat and food legumes with deficit supplemental irrigation in a Mediterranean environment. Agr. Water Manage. 107, 94–103 (2012). 88. Kaul, H.-P. Pre-crop effects of grain legumes and linseed on soil mineral N and productivity of subsequent winter rape and winter wheat crops. Bodenkultur 55, 95–102 (2004). 89. Kirchhof, G. et al. The effect of soil puddling on the soil physical properties and the growth of rice and post-rice crops. Soil Till. Res. 56, 37–50 (2000). 90. Kirchhof, G. et al. Growth and yield response of grain legumes to different soil management practices after rainfed lowland rice. Soil Till. Res. 56, 51–66 (2000).
SCIENTIFIC DATA | 3:160084 | DOI: 10.1038/sdata.2016.84
17
www.nature.com/sdata/
91. Krupinsky, J. M., Tanaka, D. L., Merrill, S. D., Liebig, M. A. & Hanson, J. D. Crop sequence effects of 10 crops in the northern Great Plains. Agr. Syst. 88, 227–254 (2006). 92. Kumar, K. & Goh, K. M. Biological nitrogen fixation, accumulation of soil nitrogen and nitrogen balance for white clover (Trifolium repens L.) and field pea (Pisum sativum L.) grown for seed. Field Crop. Res. 68, 49–59 (2000). 93. Lafond, J. & Pageau, D. Nitrogen and non nitrogen benefit of legumes to a subsequent spring barley crop. Can. J. Soil Sci. 87, 445–454 (2007). 94. Lal, R. No-tillage effects on soil properties under different crops in western Nigeria. Soil Sci. Soc. Am. J 40, 762–768 (1976). 95. Larbi, A. et al. Annual feed legume yield and quality in dryland environments in north-west Syria: 2. Grain and straw yield and straw quality. Anim. Feed Sci. Tech. 160, 90–97 (2010). 96. Laurence, R. C. N. A comparison of the grain and protein yield potential of some annual legume species in south Australia. Aust. J. Exp. Agr. Anim. Husb. 19, 495–503 (1979). 97. Lawn, R. J. Response of four grain legumes to water stress in south-eastern Queensland. III Dry matter production, yield and water use efficiency. Aust. J. Agr. Res. 33, 511–521 (1982). 98. Lemerle, D. & Hinkley, R. B. Tolerances of canola, field pea, lupin and faba bean cultivars to herbicides. Aust. J. Exp. Agr. 31, 379–386 (1991). 99. Lenssen, A. W., Johnson, G. D. & Carlson, G. R. Cropping sequence and tillage system influences annual crop production and water use in semiarid Montana, USA. Field Crop. Res. 100, 32–43 (2007). 100. López-Bellido, R. J. et al. Chickpea and faba bean nitrogen fixation in a Mediterranean rainfed Vertisol: effect of the tillage system. Eur. J. Agron. 34, 222–230 (2011). 101. López-Bellido, L., Benítez-Vega, J., García, P., Redondo, R. & López-Bellido, R. J. Tillage system effect on nitrogen rhizodeposited by faba bean and chickpea. Field Crop. Res. 120, 189–195 (2011). 102. Lutman, P. J. W., Dixon, F. L. & Risiott, R. The response of four spring-sown combinable arable crops to weed competition. Weed Res. 34, 137–146 (1994). 103. Maidl, F. X., Haunz, F. X., Panse, A. & Fischbeck, G. Transfer of grain legume nitrogen within a crop rotation containing winter wheat and winter barley. J. Agron. Crop Sci. 176, 47–57 (1996). 104. Malhi, S. S., Johnston, A. M., Schoenau, J. J., Wang, Z. H. & Vera, C. L. Seasonal biomass accumulation and nutrient uptake of pea and lentil on a black Chernozem soil in Saskatchewan. J. Plant Nutr. 30, 721–737 (2007). 105. Malik, R. S. et al. Dynamic crop sequencing in western Australian cropping systems. Crop Pasture Sci. 66, 594–609 (2015). 106. Matus, A., Derksen, D. A., Walley, F. L., Loeppky, H. A. & van Kessel, C. The influence of tillage and crop rotation on nitrogen fixation in lentil and pea. Can. J. Plant Sci. 77, 197–200 (1997). 107. McDonagh, J. F., Toomsan, B., Limpinuntana, V. & Giller, K. E. Grain legumes and green manures as pre-rice crops in northeast Thailand I. Legume N2-fixation, production and residual nitrogen benefits to rice. Plant Soil 177, 111–126 (1995). 108. McEwen, J., Darby, R. J., Hewitt, M. V. & Yeoman, D. P. Effects of field beans, fallow, lupins, oats, oilseed rape, peas, ryegrass, sunflowers and wheat on nitrogen residues in the soil and on the growth of a subsequent wheat crop. J. Agr. Sci. 115, 209–219 (1989). 109. Miller, P. R., McDonald, C. L., Derksen, D. A. & Waddington, J. The adaptation of seven broadleaf crops to the dry semiarid prairie. Can. J. Plant Sci. 81, 29–43 (2001). 110. Miller, P. R., Gan, Y., McConkey, B. G. & McDonald, C. L. Pulse crops for the northern Great Plains: I. Grain productivity and residual effects on soil water and nitrogen. Agron. J. 95, 972–979 (2003). 111. Miller, P. R. & Holmes, J. A. Cropping sequence effects of four broadleaf crops on four cereal crops in the northern Great Plains. Agron. J. 97, 189–200 (2005). 112. Miller, P. R., Brandt, S. A., McDonald, C. L. & Waddington, J. Chickpea, lentil, and pea response to delayed spring seeding on the northern Great Plains. Can. J. Plant Sci. 86, 1059–1070 (2006). 113. Moschini, V. et al. Performance of organic grain legumes in Tuscany. Ital. J. Agron. 9, 38–43 (2014). 114. Muchow, R. C. Phenology, seed yield and water use of grain legumes grown under different soil water regimes in a semi-arid tropical environment. Field Crop. Res. 11, 81–97 (1985). 115. Muchow, R. C., Robertson, M. J. & Pengelly, B. C. Accumulation and partitioning of biomass and nitrogen by soybean, mungbean and cowpea under contrasting environmental conditions. Field Crop. Res. 33, 13–36 (1993). 116. Muhammad, A., Dikko, A. U., Audu, M. & Singh, A. Comparative effects of cowpea and soybean genotypes on N2-fixation and N-balance in Sokoto dry sub-humid agro-ecological zone of Nigeria. Niger. J. Basic Appl. Sci. 18, 297–303 (2010). 117. Muthomi, J. W., Otieno, P. E., Chemining’wa, G. N., Nderitu, J. H. & Wagacha, J. M. Effect of chemical spray on insect pests and yield quality of food grain legumes. J. Entomol. 5, 156–163 (2008). 118. Nan, Z. B., Abd El-Moneim, A. M., Larbi, A. & Nie, B. Productivity of vetches (Vicia spp.) under alpine grassland conditions in China. Trop. Grasslands 40, 177–182 (2006). 119. Ncube, B., Twomlow, S. J., van Wijk, M. T., Dimes, J. P. & Giller, K. E. Productivity and residual benefits of grain legumes to sorghum under semi-arid conditions in southwestern Zimbabwe. Plant Soil 299, 1–15 (2007). 120. Neugschwandtner, R. W., Wagentristl, H. & Kaul, H.-P. Nitrogen yield and nitrogen use of chickpea compared to pea, barley and oat in central Europe. Int. J. Plant Prod. 9, 291–304 (2015). 121. Nielsen, D. C. Production functions for chickpea, field pea, and lentil in the central Great Plains. Agron. J. 93, 563–569 (2001). 122. Niţă, S. et al. Results obtained for soybean, pea and lentils crops on a Cambic Chernozem in the Banat’s Plain during 2008-2010. Rom. Agr. Res. 29, 155–162 (2012). 123. Ojiem, J. O., Vanlauwe, B., de Ridder, N. & Giller, K. E. Niche-based assessment of contributions of legumes to the nitrogen economy of western Kenya smallholder farms. Plant Soil 292, 119–135 (2007). 124. Pala, M., Harris, H. C., Ryan, J., Makboul, R. & Dozom, S. Tillage systems and stubble management in a Mediterranean-type environment in relation to crop yield and soil moisture. Exp. Agr. 36, 223–242 (2000). 125. Pandey, R. K., Herrera, W. A. T. & Pendleton, J. W. Drought response of grain legumes under irrigation gradient: I. Yield and yield components. Agron. J. 76, 549–553 (1984). 126. Pandey, R. K., Morris, R. A. & Whisler, F. D. Water extraction patterns, water use and yield of ten upland crops following rainfed lowland rice in the tropics. Philipp. J. Crop Sci. 12, 163–168 (1987). 127. Payne, W. A., Chen, C. & Ball, D. A. Agronomic potential of narrow-leafed and white lupins in the inland Pacific northwest. Agron. J. 96, 1501–1508 (2004). 128. Phoomthaisong, J., Toomsan, B., Limpinuntana, V., Cadisch, G. & Patanothai, A. Attributes affecting residual benefits of N2-fixing mungbean and groundnut cultivars. Biol. Fert. Soils 39, 16–24 (2003). 129. Piha, M. I. & Munns, D. N. Nitrogen-fixation capacity of field-grown bean compared to other grain legumes. Agron. J. 79, 690–696 (1987). 130. Pilbeam, C. J., Wood, M. & Mugane, P. G. Nitrogen use in maize-grain legume cropping systems in semi-arid Kenya. Biol. Fert. Soils 20, 57–62 (1995). 131. Plaza-Bonilla, D., Nolot, J.-M., Passot, S., Raffaillac, D. & Justes, E. Grain legume-based rotations managed under conventional tillage need cover crops to mitigate soil organic matter losses. Soil Till. Res. 156, 33–43 (2016).
SCIENTIFIC DATA | 3:160084 | DOI: 10.1038/sdata.2016.84
18
www.nature.com/sdata/
132. Pospišil, A. & Pospišil, M. Influence of sowing density on agronomic traits of lupins (Lupinus spp.). Plant Soil Environ. 61, 422–425 (2015). 133. Pratibha, G., Pillai, K. G. & Satyanarayana, V. Production potential and profitability of some rice (Oryza sativa)-based cropping systems involving sequence cropping of pulses and oilseeds in rice fallows. Indian J. Agr. Sci. 67, 98–101 (1997). 134. Prasad, N. K. & Kumar, S. Nutrient harvest and soil fertility as influenced by legume-wheat (Triticum aestivum) sequences. Indian J. Agr. Sci. 69, 167–171 (1999). 135. Przednowek, D. W. A., Entz, M. H., Irvine, B., Flaten, D. N. & Thiessen Martens, J. R. Rotational yield and apparent N benefits of grain legumes in southern Manitoba. Can. J. Plant Sci. 84, 1093–1096 (2004). 136. Rao, S. C. & Northup, B. K. Capabilities of four novel warm-season legumes in the southern Great Plains: grain production and quality. Crop Sci. 49, 1103–1108 (2009). 137. Rennie, R. J. & Dubetz, S. Nitrogen-15-determined nitrogen fixation in field-grown chickpea, lentil, fababean, and field pea. Agron. J. 78, 654–660 (1986). 138. Ruisi, P. et al. Tillage effects on yield and nitrogen fixation of legumes in Mediterranean conditions. Agron. J. 104, 1459–1466 (2012). 139. Ryan, J., Singh, M. & Christiansen, S. Assessment of long-term barley-legume rotations in a typical Mediterranean agro-ecosystem: grain and straw yields. Arch. Agron. Soil Sci. 58, 233–246 (2012). 140. Sandaña, P. A., Harcha, C. I. & Calderini, D. F. Sensitivity of yield and grain nitrogen concentration of wheat, lupin and pea to source reduction during grain filling. A comparative survey under high yielding conditions. Field Crop. Res. 114, 233–243 (2009). 141. Santonoceto, C., Monti, M. & Anastasi, U. A comparison of the agronomic performance of grasspea and faba bean in a semiarid Mediterranean environment. Options Méditerranéennes 60, 223–228 (2004). 142. Schultz, J. E. Crop production in a rotation trial at Tarlee, south Australia. Aust. J. Exp. Agr. 35, 865–876 (1995). 143. Schulz, S., Keatinge, J. D. H. & Wells, G. J. Productivity and residual effects of legumes in rice-based cropping systems in a warm-temperate environment I. Legume biomass production and N fixation. Field Crop. Res. 61, 23–35 (1999). 144. Senthong, C. & Pandey, R. K. Response of five food legume crops to an irrigation gradient imposed during reproductive growth. Agron. J. 81, 680–686 (1989). 145. Sharma, S. N., Prasad, R. & Singh, S. Residual effects of growing mungbean and uridbean on the yield and nitrogen uptake of a succeeding wheat crop. Fert. Res. 44, 163–168 (1996). 146. Sharma, G. L., Mahapatra, B. S., Singh, A. K. & Pandey, B. M. Role of summer legumes on productivity of maize (Zea mays)-wheat (Triticum aestivum) cropping system on sandy-loam soil of western Uttar Pradesh. Indian J. Agr. Sci. 68, 295–298 (1998). 147. Siddique, K. H. M., Walton, G. H. & Seymour, M. A comparison of seed yields of winter grain legumes in western Australia. Aust. J. Exp. Agr. 33, 915–922 (1993). 148. Siddique, K. H. M. & Loss, S. P. Growth and seed yield of vetches (Vicia spp.) in south-western Australia. Aust. J. Exp. Agr. 36, 587–593 (1996). 149. Siddique, K. H. M., Loss, S. P., Regan, K. L. & Jettner, R. L. Adaptation and seed yield of cool season grain legumes in Mediterranean environments of south-western Australia. Aust. J. Agr. Res. 50, 375–387 (1999). 150. Siddique, K. H. M. & Loss, S. P. Studies on sowing depth for chickpea (Cicer arietinum L.), faba bean (Vicia faba L.) and lentil (Lens culinaris Medik) in a Mediterranean-type environment of south-western Australia. J. Agron. Crop Sci. 182, 105–112 (1999). 151. Sidhu, M. S., Sharma, B. D., Sharma, R. K. & Singh, S. Performance of cropping systems based on winter maize (Zea mays) under irrigated condition. Indian J. Agr. Sci. 64, 745–750 (1994). 152. Silsbury, J. H. Grain yield and flowering of some introduced grain legumes in south Australia. Aust. J. Exp. Agr. Anim. Husb. 15, 556–560 (1975). 153. Sinclair, T. R. et al. Field and model analysis of the effect of water deficits on carbon and nitrogen accumulation by soybean, cowpea and black gram. Field Crop. Res. 17, 121–140 (1987). 154. Singh, K. & Singh, S. Different wheat (Triticum aestivum)-based cropping systems, and their fertilizer requirement, yield and economic returns. Indian J. Agr. Sci. 61, 709–714 (1991). 155. Singh, M. K., Thakur, R., Verma, U. N. & Pal, S. K. Production potential of crop sequences in plateau region of Bihar. Indian J. Agr. Sci. 65, 242–245 (1995). 156. Singh, V. & Deo, R. Productivity and economics of different cropping systems under various levels of irrigation. Indian J. Agron. 43, 419–425 (1998). 157. Singh, R. & Kundu, D. K. Water use by horsegram (Macrotyloma uniflorum), greengram (Phaseolus radiatus) and sesame (Sesamum indicum) under shallow water-table condition in Orissa. Indian J. Agr. Sci. 73, 89–93 (2003). 158. Smith, S. C., Bezdicek, D. F., Turco, R. F. & Cheng, H. H. Seasonal N2 fixation by cool-season pulses based on several 15N methods. Plant Soil 97, 3–13 (1987). 159. Spaner, D., Todd, A. G. & McKenzie, D. B. Pea and soybean performance in Newfoundland. Can. J. Plant Sci. 81, 723–726 (2001). 160. Srivastava, G. P. & Srivastava, V. C. Nitrogen economy and productivity of wheat (Triticum aestivum) succeeding grain legumes. Indian J. Agr. Sci. 63, 694–698 (1993). 161. Stringi, L., Giambalvo, D., Trapani, P., Scarpello, C. & Attardo, C. Effect of soil management techniques on performance of different grain legumes in a Mediterranean environment. Options Méditerranéennes 60, 79–83 (2004). 162. Suwanarit, A., Suwannarat, C. & Chotechaungmanirat, S. Quantities of fixed N and effects of grain legumes on following maize, and N and P status of soil as indicated by isotopes. Plant Soil 93, 249–258 (1986). 163. Tanaka, D. L., Anderson, R. L. & Rao, S. C. Crop sequencing to improve use of precipitation and synergize crop growth. Agron. J. 97, 385–390 (2005). 164. Tanaka, D. L., Krupinsky, J. M., Merrill, S. D., Liebig, M. A. & Hanson, J. D. Dynamic cropping systems for sustainable crop production in the northern Great Plains. Agron. J. 99, 904–911 (2007). 165. Tesfaye, K., Walker, S. & Tsubo, M. Radiation interception and radiation use efficiency of three grain legumes under water deficit conditions in a semi-arid environment. Eur. J. Agron. 25, 60–70 (2006). 166. Thakur, H. C. & Sharma, N. N. Production potential and economic profitability of different cropping patterns including cereals, pulses and oilseeds. Indian J. Agr. Sci. 58, 194–201 (1988). 167. Thakur, R. B., Jha, G. & Choudhary, S. K. Production and economics of rice (Oryza sativa)-based cropping systems. Indian J. Agron. 43, 572–575 (1998). 168. Thies, J. E., Singleton, P. W. & Bohlool, B. B. Influence of the size of indigenous rhizobial populations on establishment and symbiotic performance of introduced rhizobia on field-grown legumes. Appl. Environ. Microbiol. 57, 19–28 (1991). 169. Thomas, G. A. et al. Crop rotations for sustainable grain production on a Vertisol in the semi-arid subtropics. J. Sustain. Agr. 35, 2–26 (2011).
SCIENTIFIC DATA | 3:160084 | DOI: 10.1038/sdata.2016.84
19
www.nature.com/sdata/
170. Thomson, B. D., Siddique, K. H. M., Barr, M. D. & Wilson, J. M. Grain legume species in low rainfall Mediterranean-type environments I. Phenology and seed yield. Field Crop. Res. 54, 173–187 (1997). 171. Toomsan, B. et al. Biological N2 fixation and residual N benefit of pre-rice leguminous crops and green manures. Neth. J. Agr. Sci. 48, 19–29 (2000). 172. Turpin, J. E., Herridge, D. F. & Robertson, M. J. Nitrogen fixation and soil nitrate interactions in field-grown chickpea (Cicer arietinum) and fababean (Vicia faba). Aust. J. Agr. Res. 53, 599–608 (2002). 173. Vasilakoglou, I., Vlachostergios, D., Dhima, K. & Lithourgidis, A. Response of vetch, lentil, chickpea and red pea to pre- or post-emergence applied herbicides. Span. J. Agr. Res. 11, 1101–1111 (2013). 174. Wall, D. A. Lentil (Lens culinaris) and fababean (Vicia faba) tolerance to post-emergence applications of Imazethapyr. Can. J. Plant Sci. 76, 525–529 (1996). 175. Wang, X., Gan, Y., Hamel, C., Lemke, R. & McDonald, C. Water use profiles across the rooting zones of various pulse crops. Field Crop. Res. 134, 130–137 (2012). 176. Webber, H. A. et al. Water use efficiency of common bean and green gram grown using alternate furrow and deficit irrigation. Agr. Water Manage. 86, 259–268 (2006). 177. Wen, G., Chen, C., Neill, K., Wichman, D. & Jackson, G. Yield response of pea, lentil and chickpea to phosphorus addition in a clay loam soil of central Montana. Arch. Agron. Soil Sci. 54, 69–82 (2008). 178. Wendt, J. W. & Atemkeng, M. F. Soybean, cowpea, groundnut, and pigeonpea response to soils, rainfall, and cropping season in the forest margins of Cameroon. Plant Soil 263, 121–132 (2004). 179. Wetselaar, R. Estimation of nitrogen fixation by four legumes in a dry monsoonal area of north-western Australia. Aust. J. Exp. Agr. Anim. Husb. 7, 518–522 (1967). 180. Withers, N. J. A comparison of several grain legumes at two sowing times I. Seed yield and components. New Zeal. J. Exp. Agr. 7, 361–364 (1979). 181. Wright, A. T. Yield effect of pulses on subsequent cereal crops in the northern prairies. Can. J. Plant Sci. 70, 1023–1032 (1990). 182. Yau, S. K. & Ryan, J. Differential impacts of climate variability on yields of rainfed barley and legumes in semi-arid Mediterranean conditions. Arch. Agron. Soil Sci. 59, 1659–1674 (2013). 183. Yusuf, A. A., Abaidoo, R. C., Iwuafor, E. N. O. & Olufajo, O. O. Genotype effects of cowpea and soybean on nodulation, N2-fxation and N balance in the northern Guinea savanna of Nigeria. J. Agron. 7, 258–264 (2008). 184. Zentner, R. P. et al. Economics of crop diversification and soil tillage opportunities in the Canadian prairies. Agron. J. 94, 216–230 (2002). 185. Zhang, H., Pala, M., Oweis, T. & Harris, H. Water use and water-use efficiency of chickpea and lentil in a Mediterranean environment. Aust. J. Agr. Res. 51, 295–304 (2000). 186. Kottek, M., Grieser, J., Beck, C., Rudolf, B. & Rubel, F. World map of the Köppen-Geiger climate classification updated. Meteorol. Z. 15, 259–263 (2006). 187. Daryanto, S., Wang, L. & Jacinthe, P.-A. Global synthesis of drought effects on food legume production. PLoS ONE 10, e0127401 (2015). 188. Laurent, A., Pelzer, E., Loyce, C. & Makowski, D. Ranking yields of energy crops: a meta-analysis using direct and indirect comparisons. Renew. Sust. Energ. Rev. 46, 41–50 (2015).
Data Citation 1. Cernay, C., Pelzer, E. & Makowski, D. Dryad Digital Repository http://dx.doi.org/10.5061/dryad.mf42f (2016).
Acknowledgements We thank G. Amato, C. Chen, A. L. Fernandez, Y. T. Gan, K. E. Giller, N. Gogoi, D. Herridge, H.-P. Kaul, G. Kirchhof, M. A. Liebig, P. Miller, R. Neugschwandtner, K. H. M. Siddique, D. Spaner, M. Unkovich, C. S. Wortmann and A. A. Yusuf for providing us with additional information and raw data. We thank A. Bône for assistance with the literature search. We thank D. Beillouin, T. Ben-Ari, G. Corre-Hellou, L. Hossard, M.-H. Jeuffroy, J.-M. Meynard, O. Réchauchère, A. Schneider, J.-M. Teulé and A.-S. Voisin for insightful comments. This work was supported by the French National Research Agency (ANR) under the ‘Investments for the Future’ program (ANR-10-IDEX-0003-02) as part of the LabEx BASC (ANR‐11‐LABX‐0034).
Author Contributions C.C. compiled data records, performed standardization and technical validation of the database. D.M. and E.P. conceived and supervised the work. C.C., D.M. and E.P. wrote the Data Descriptor.
Additional Information Table 3 is only available in the online version of this paper. Competing financial interests: The authors declare no competing financial interests. How to cite this article: Cernay, C. et al. A global experimental dataset for assessing grain legume production. Sci. Data 3:160084 doi: 10.1038/sdata.2016.84 (2016). This work is licensed under a Creative Commons Attribution 4.0 International License. The images or other third party material in this article are included in the article’s Creative Commons license, unless indicated otherwise in the credit line; if the material is not included under the Creative Commons license, users will need to obtain permission from the license holder to reproduce the material. To view a copy of this license, visit http://creativecommons.org/licenses/by/4.0 Metadata associated with this Data Descriptor is available at http://www.nature.com/sdata/ and is released under the CC0 waiver to maximize reuse. © The Author(s) 2016
SCIENTIFIC DATA | 3:160084 | DOI: 10.1038/sdata.2016.84
20