! "
# $
Universiteit Utrecht Copernicus Institute
Department of Science, Technology and Society
% & '(() ** + & % ,)- ,( -.)' ('* / '(()
I
A Greenhouse Gas Balance of Electricity Production from Co-firing Palm Oil Products from Malaysia
Contact persons:
Birka Wicke, MSc Veronika Dornburg, PhD André Faaij, PhD Martin Junginger, PhD
Department of Science, Technology and Society Copernicus Institute Utrecht University Heidelberglaan 2 3584 CS Utrecht The Netherlands Phone: +31 (0)30 253 7600 Fax: +31 (0)30 253 7601 Email:
[email protected],
[email protected],
[email protected],
[email protected] Website: http://www.chem.uu.nl/nws
II
A Greenhouse Gas Balance of Electricity Production from Co-firing Palm Oil Products from Malaysia
Executive Summary The Netherlands imports significant quantities of biomass for energy production, among which palm oil has been used increasingly for co-firing in existing gas-fired power plants for renewable electricity production. Imported biomass, however, cannot simply be considered a sustainable energy source. The production and removal of biomass in other places in the world result in ecological, land-use and socio-economic impacts and in GHG emissions (e.g. for transportation). As a result of the sustainability discussions, the Cramer Commission in the Netherlands has formulated (draft) criteria and indicators for sustainable biomass production (Cramer Commission, 2007). This study develops a detailed methodology for determining the GHG balance of co-firing palm oil products in the Netherlands based on the Cramer Commission methodology (Bergsma et al., 2006). Then the methodology is applied to a specific bio-electricity chain: the production of palm oil and a palm oil derivative, palm fatty acid distillate (PFAD), in Northeast Borneo in Malaysia, their transport to the Netherlands and co-firing with natural gas for electricity production at the Essent Claus power plant. Methodology The methodology is based on the preliminary Cramer Commission methodology for greenhouse gas calculations for bio-electricity (Bergsma et al., 2006). While the Cramer Commission methodology only gives the rough outline for calculating GHG emissions from bio-energy (bio-electricity, heat and fuels), this study has extended this methodology for bio-electricity from palm oil products. The bio-electricity chain is based on the co-firing of natural gas (NG) with palm fatty acid distillate (PFAD) and crude palm oil (CPO) at the Essent Claus power plant. CPO is the main product of an oil palm plantation, while PFAD is a by-product of CPO refining. Due to this difference (main product vs. by-product), two separate bio-energy chains are defined and their emissions are calculated independently. Table A lists the various GHG emissions flows for each component of the CPO and PFAD production chains. Table A: Overview of CPO/PFAD electricity production chains and their components CPO PFAD GHG emissions from carbon stock changes due n/a Land use to conversion from original land type to oil palm plantation: • biomass • soil • dead organic matter GHG emissions from: n/a Plantation • fossil energy use (establishment, maintenance and operation of plantation, harvest, transport of FFB to mill) • fertilizer production • fertilizer application GHG emissions from: n/a Mill • Fossil energy use (milling FFB) • Palm oil mill effluent treatment GHG emission credits from: • Palm kernel oil • Palm kernel expeller n/a GHG emissions from: Refinery • Fossil energy use (refining of CPO and producing PFAD as by-product) • Alternative PFAD use GHG emissions from: GHG emissions from: Transport • Fossil energy use (transport by truck to • Fossil energy use (sea transport to the harbour, sea transport to the Netherlands, Netherlands, and inland transport to and inland ship transport to power plant) power plant by ship) CPO electricity production is carbon neutral PFAD electricity production is carbon neutral Use
III
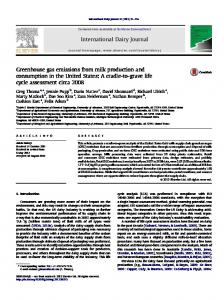
A Greenhouse Gas Balance of Electricity Production from Co-firing Palm Oil Products from Malaysia The GHG emissions of by-products are calculated on the basis of system extension. This approach assumes that the by-product generated can replace the same or a similar product that was produced from another feedstock. Due to this replacement, an emission credit for the avoided GHG emission from the original production of the product can be determined. As suggested by Bergsma et al. (2006), allocation of emissions to by-products will be based on market prices when system extension is not possible. The concept of GHG emission reductions from co-firing biomass, i.e. CPO and PFAD, for electricity production compares the emissions from this bio-electricity chain to a fossil reference system. The functional unit of this comparison is defined as producing 1 kWh electricity. The overall emissions of the whole electricity production chain, both fossil- and bio-based, include all emissions occurring anywhere during resource extraction, treatment, transport, and power production. The three most important greenhouse gases, carbon dioxide (CO2), methane (CH4) and nitrous oxide (N2O), are accounted for. For comparing the emissions of these three gases, the concept of global warming potential (GWP) is applied by which the radiative forcing of the different gases can be compared. Results Investigating the overall emissions for different land types, CPO production on peatland and natural rain forest was found not to be an option for producing sustainable electricity as its emission reduction potential is negative compared to fossil reference systems (Figure A). Moreover, it was found that CPO production on logged-over forest also does not meet the Cramer Commission criterion of 70% emission reduction compared to various fossil reference systems and that the 50 percent emission reduction target can only be reach when compared to electricity production from coal. However, when CPO is produced on degraded land, GHG emission reductions of well over 100 percent may be reached, indicating that oil palm plantations may serve as carbon sinks.
GHG emissions (g CO2-eq / kWh)
4000
3000
2000
CPO
Fossil electricity
PFAD 1000
Base case Natural rain forest Degraded land Peatland forest Use of biomass No land use emissions Improvement 13 yr allocation 100 yr allocation Market price allocation Mass allocation Energy allocation Best case Worst case PFAD base case PFAD energy allocation PFAD mass allocation No refinery Claus power plant Average Dutch Modern natural gas Coal Average EU
0
CPO chains
CPO methodological aspects
CPO sensitivity
PFAD
Fossil
Figure A: Overview of GHG emissions of CPO and PFAD chains per kWh electricity produced from biomass through co-firing in a natural gas power plant and comparison to the fossil reference chains
IV
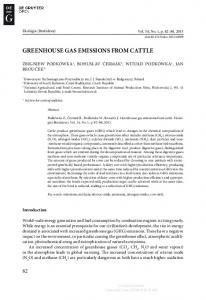
A Greenhouse Gas Balance of Electricity Production from Co-firing Palm Oil Products from Malaysia This study also investigated potential improvement options in the management of the oil palm plantation and the mill and their effect on the GHG emission reductions. This investigation resulted in three options that can have large impacts on the emissions, with the largest effect being caused by planting oil palm on degraded land. Also, a fourth option (applying more organic fertilizer) was examined but it showed only very little effect on the GHG balance. Together the four options cause the overall emissions of the CPO-based electricity chain to become negative so that the oil palm plantation may actually serve as a carbon sink. The second source of bio-electricity that was investigated in this study is palm fatty acid distillate, a by-product of CPO refining. It was found that PFAD has a very positive GHG balance and compared to the fossil reference systems it can reduce GHG emissions by over 70 percent, meeting the Cramer Commission criteria in all cases. Discussion and Conclusions The study found that the land use conversion for oil palm plantation makes up a very large share of the overall emissions and, due to this significance, may not be neglected in the overall GHG emission calculations for palm oil-based electricity or, in fact, for any other biomass-based electricity. However, especially this aspect has shown to be difficult to analyse because the conversion of specific land types to oil palm plantation and the quantities of land converted specifically for oil palm are not well studied. The sensitivity analysis of the GHG emissions from CPO production illustrates how the emissions can vary when different values for CPO production parameters are assumed. This points out that the actually level of emissions depends largely on the local settings, the specific management of the plantation and the particular production methods. The study has established further that methodological choices can have large impacts on the results and on whether the GHG emission reduction targets of the Cramer Commission may or may not be reached. Especially significant is the decision of the time period for which land use change emissions are accounted for. With respect to the allocation of emissions to by-products, the results have shown much less variation, even though a difference in results could be found between system extension and market price allocation. PFAD-based electricity was found to have very small emissions, both compared to fossil reference systems and to CPO-based electricity production. The most important reason for why PFAD has such small emissions and so large GHG emission reduction potentials is that PFAD is treated as by-product so that, according to the Cramer Commission methodology, only those emissions need to be accounted for that are generated in direct connection with PFAD processing and use. While, based on the mass balance of a refinery (where PFAD is a by-product produced at a rate of less than 5 percent by weight), this is a valid assumption, the choice to treat PFAD as a by-product may be debatable when considering that PFAD is a valuable product for the oleochemical and animal feed production industries. Moreover, one might not want to consider PFAD sustainable just because the GHG balance is positive, especially when it comes from unsustainably produced CPO. It needs to be discussed again when a product is considered only a by-product and how to account for the possibly un-sustainability of the CPO that is used for PFAD production. Based on the results of the calculation a simple decision tree for determining whether the Cramer Commission criteria on GHG emissions can be reached was made (Figure B). It must be noted that this decision tree is simple and crude, and that actual compliance with GHG emission criteria depends strongly on the local conditions.
V
A Greenhouse Gas Balance of Electricity Production from Co-firing Palm Oil Products from Malaysia What biomass is used?
70 % GHG emission reductions can be reached*
PFAD
CPO
What is the previous land use type? Logged over forest
Tropical rain forest Or Peatland
Are management improvement options** applied?
Degraded land No
What fossil reference is it compared to? Coal
Yes
70 % GHG emission reductions can be reached
70 % GHG emission reductions may be reached
Claus power plant, Modern natural gas Dutch average EU average
50% GHG emission reductions may be reached
50% GHG emission reductions cannot be reached
Figure B: A simple decision tree - When can electricity production from palm oil products meet the Cramer Commission criteria? * Assuming that PFAD is treated as a by-product ** The improvement options refer to 1) establishing a new plantation on degraded land, 2) increasing FFB yields, 3) POME is treated in a closed anaerobic digester and CH4 is collected and burned for electricity production and 4) slurry from POME treatment is applied to the plantation as organic fertilizer.
This study demonstrates that it is possible to calculate the GHG emissions of a specific bio-electricity chain with an extended version of the Cramer Commission methodology for GHG emissions. While GHG emissions can vary strongly for different land use changes and methodological approaches, many of the chains studied were found not to be sustainable according to the Cramer Commission GHG emission criteria. However, if CPO production takes place on previously degraded land, the management of the production of CPO is improved, or if the by-product PFAD is used for electricity production, the criteria can be achieved, and palm oil-based electricity can be considered sustainable from a GHG emission point of view. If bioelectricity is to be produced from palm oil and its derivatives, these sustainable options should therefore be focussed on.
VI
A Greenhouse Gas Balance of Electricity Production from Co-firing Palm Oil Products from Malaysia
Table of Contents EXECUTIVE SUMMARY
III
LIST OF FIGURES
VIII
LIST OF TABLES
VIII
ABBREVIATIONS
IX
1.
INTRODUCTION
1
2.
MALAYSIA
3
3.
METHODOLOGY
5
3.1. 3.2. 3.3. 3.4. 3.5.
GHG EMISSION REDUCTIONS CPO PRODUCTION CHAIN PFAD PRODUCTION CHAIN FOSSIL ELECTRICITY REFERENCE SYSTEM OTHER ENVIRONMENTAL CRITERIA OF THE CRAMER COMMISSION
5 6 17 20 21
4.
INPUT DATA
22
5.
RESULTS
27
5.1. 5.2. 5.3. 5.4. 5.5. 6. 6.1. 6.2. 6.3.
CPO PRODUCTION CHAIN PFAD PRODUCTION CHAIN OVERVIEW OF BIO-ELECTRICITY CHAINS GHG EMISSION REDUCTIONS OTHER ENVIRONMENTAL CRITERIA OF THE CRAMER COMMISSION DISCUSSION
27 32 33 35 38 41
CRAMER COMMISSION METHODOLOGY SPECIFIC APPROACH TAKEN IN THIS STUDY RESULTS
41 41 42
7.
CONCLUSION AND RECOMMENDATIONS
45
8.
ACKNOWLEDGEMENTS
47
9.
REFERENCES
48
10.
APPENDIX
51
VII
A Greenhouse Gas Balance of Electricity Production from Co-firing Palm Oil Products from Malaysia
List of Figures Figure 1: CPO production chain and overview of emission sources/credits .....................................................7 Figure 2: PFAD production chain and overview of emission sources .............................................................17 Figure 3: Natural gas production chain and overview of emission sources ....................................................20 Figure 4: Breakdown of GHG emissions by chain component for the production of CPO in the base case27 Figure 5: Breakdown of GHG emissions by source for CPO delivered to power plant.................................29 Figure 6: GHG emissions from the mill, the plantation and the land use change of the base case compared to improvements in management ......................................................................................................29 Figure 7: GHG emission of CPO production: Influence of methodological aspects on the results...............30 Figure 8: Sensitivity of base case GHG emissions: analysing data ranges found for the base case in a best case and worst case.............................................................................................................................31 Figure 9: Sensitivity of base case GHG emissions: spider diagram .................................................................32 Figure 10: GHG emissions of the PFAD production chain, by component.....................................................33 Figure 11: Overview of GHG emissions of CPO and PFAD chains per kWh electricity produced from biomass through co-firing in a natural gas power plant and comparison to the fossil reference chains...................................................................................................................................................34 Figure 12: GHG emission reductions of various CPO electricity production chains compared to different fossil reference systems ......................................................................................................................36 Figure 13: GHG emission reductions: methodological aspects ........................................................................37 Figure 14: Sensitivity of GHG emission reductions from CPO based electricity production .......................37 Figure 15: GHG emission reduction of PFAD electricity compared to various fossil reference systems .....38 Figure 16: A simple decision tree - When can electricity production from palm oil products meet the Cramer Commission criteria?...........................................................................................................47
List of Tables Table 1: Description of CPO production cases..................................................................................................15 Table 2: Description of PFAD cases ...................................................................................................................19 Table 3: Input data: Land use change................................................................................................................22 Table 4: Input data: Oil palm plantation ...........................................................................................................23 Table 5: Input data: Mill .....................................................................................................................................23 Table 6: Input data: Transport...........................................................................................................................24 Table 7: Input data: Refinery .............................................................................................................................25 Table 8: Input data: GHG emissions of fossil electricity reference systems ...................................................25 Table 9: Input data: Prices of oil palm products...............................................................................................25 Table 10: Input Data: Parameters and their ranges for sensitivity analysis...................................................26 Table 11: Input Data: Global warming potential of the most important greenhouse gases ..........................26 Table 12: Break down of GHG emissions by chain components for various CPO production cases ...........28 Table 13: Break down of emission reductions by improvement options .........................................................30 Table 14: GHG emissions of three PFAD production chains ...........................................................................33 Table 15: Overall emissions of CPO production chains ...................................................................................33 Table 16: GHG emission reductions and percentage reduction from fossil reference system ......................35 Table 17: Fertilizer and pesticide application at visited plantations (2006)....................................................39 Table 18: Timetable and Activities of Field Visit (Sabah, Malaysia)...............................................................51 Table 19: Methodology for carbon stock changes for land use change ...........................................................52 Table 20: Abbreviations used in the land use change emission methodology .................................................52
VIII
A Greenhouse Gas Balance of Electricity Production from Co-firing Palm Oil Products from Malaysia
Abbreviations C – carbon – methane CH4 CO2 – carbon dioxide CPO – crude palm oil DOM – dead organic manner EF – emission factor EFB – empty fruit bunch FFB – fresh fruit bunch GHG – greenhouse gas GWP – global warming potential IPCC – International Panel for Climate Change kWh – kilowatt hour N – nitrogen n/a – not applicable NG – natural gas N2O – nitrous oxide PFAD – palm fatty acid distillate PKE – palm kernel expeller PKFAD – palm kernel fatty acid distillate PKO – palm kernel oil PKS – palm kernel shells POME – palm oil mill effluent RBD – refined, bleached, deodorized SOC – soil organic carbon
IX
A Greenhouse Gas Balance of Electricity Production from Co-firing Palm Oil Products from Malaysia
1. Introduction The Netherlands imports significant quantities of biomass for energy production. Important examples are wood pellets from Canada, residues from palm oil production from Malaysia as well as crude palm oil and palm oil derivatives, which have been used recently for co-firing in existing coal-fired and gas-fired power plants for renewable electricity production (Junginger et al., 2006). Imported biomass, however, cannot simply be considered a sustainable energy source. The production and removal of biomass in other places in the world result in ecological, land-use and socio-economic impacts and in GHG emissions (e.g. for transportation). As a results of the sustainability discussions, the Cramer Commission in the Netherlands has formulated (draft) criteria and indicators for sustainable biomass production (Cramer Commission, 2007). Details on the evaluation procedure (e.g. a methodology for the calculation of greenhouse gas balances) are currently worked out by the commission (Cramer Commission, 2007; Bergsma et al., 2006). So far, no products have been officially certified according to these criteria and the protocols on, for example, the GHG balance calculations remain fairly general. Not only are the protocols fairly general but also are there issues that still remain unsolved, such as whether, and then, how to deal with land use change and the associated GHG emissions. Especially the GHG emission criterion and the calculation methodology still require further development. Therefore, it is the main objective of this study to demonstrate how a GHG balance according to the Cramer Commission methodology can be carried out and, based on the developed approach, to assess the sustainability a specific bio-electricity production chain. The specific bio-electricity chain considered in this study is the production of palm oil and a palm oil derivative, palm fatty acid distillate (PFAD), in Northeast Borneo in Malaysia, their transport to the Netherlands and their co-firing with natural gas for electricity production at the Essent Claus power plant. This choice is based on the intense discussions around the sustainability of palm oil production in Southeast Asia and on the use of this palm oil for energy purposes in Europe. The discussions mainly stem from the very rapidly expanding palm oil industry and, linked to that, the large scale land conversion to oil palm plantations. The main negative impacts of the expanding palm oil industry include the loss of high conservation value forest and biodiversity, increased erosion, increased vulnerability to fires, air pollution due to the fires and displacement of indigenous people (Wakker, 2004). The reasons for the rapid expansion are the increased demand from the traditional use of palm oil in the food industry and in the oleochemical industry – mainly because of the lower prices for palm oil compared to other vegetable oils – and the recently increasing use of palm oil products in the energy sector, where palm oil products are used as feedstock for biodiesel production or co-firing with coal (e.g. palm kernel shells) or natural gas (e.g. crude palm oil or PFAD) for electricity production. The use of palm oil products for energy purposes is driven mainly by the increasing renewable energy demand in Europe but also the local use of palm oil for biodiesel or electricity production is becoming more widespread. Especially the sustainability of palm-oil-derived energy is being discussed widely. One particular reason is that bioenergy is assumed to be more environmentally friendly in terms of GHG emissions than fossil energy - but it is not certain that this assumption is actually valid. Dehue (2006) explains that palm oil has a positive GHG balance as long as the land use change is not taken into account. However, when including the effects of the land use change, 1
A Greenhouse Gas Balance of Electricity Production from Co-firing Palm Oil Products from Malaysia
such as the removal of biomass and the possibly the burning of biomass, Reijnders and Huijbregts (2006) as well as Hooijer et al. (2006) both demonstrated that the GHG emissions from palm oil when planted on peat are extremely large and that the use of peatland for oil palm plantations should be avoided. Helms et al. (2006) also show that if tropical rain forest is converted to oil palm the large GHG emissions are caused during the land conversion but that the GHG balance of palm oil diesel is still better than for fossil diesel, even when only slightly. The GHG balance is improved when degraded land is used for oil palm plantations (Helms et al., 2006; Reinhardt, 2006 and Syahrinudin, 2005) and good management practices are applied. Existing literature of GHG emissions from palm oil derived energy have focused mainly on palm oil diesel, while electricity production has been treated rarely and then does not include emissions from land use change (Dehue, 2006). Especially the comparison of different land use system and their effect on the GHG balance, as was done by Helms et al. (2006) for palm oil diesel, is still missing for electricity production. Moreover, existing literature on GHG emissions has not dealt with the CPO refinery by-product, PFAD and the methodological issues of a GHG balance of a by-product. Another aspect that has not completely been discussed in existing literature is the description of improvement options and their effects on the GHG balance. Finally, the use of actual field data is lacking in the existing literature and this can cause problems with data quality. Based on these shorting comings, this study investigates the GHG balance of electricity production from the palm oil products crude palm oil and PFAD, now also including the GHG emissions from land use change, and the options for reducing the emissions throughout the production chain. For this study, case specific data from a field visit of two plantations, two mills and one refinery in Sandakan region of Northeast Borneo, Malaysia (see Appendix 1 for more information on the field visit). The field visit was conducted in connection with a RSPO and a Cramer Commission pre-audit by the certification body Control Union (the Netherlands) in February 2007. The visited plantations were well managed and one of the plantations had been managed according to many of the RSPO standards. Each plantation is equipped with its own mill. The refinery is located in the port city of Sandakan, from where CPO and its derivative products can be directly shipped abroad. The data collected during the field visit is applied for calculating the GHG emission of the early stages of the production chain. The analysis of this concrete case of palm oil and PFAD production is supported by an analysis of other typical situations in which palm oil is produced in order to comprehend the GHG emissions of other production scenarios. Finally, to calculate the GHG emission reductions of bio-electricity production in Europe from Malaysian CPO and PFAD, the emissions from the whole bio-electricity chain are compared to the emissions from various fossil electricity reference systems, i.e. production of electricity in the same power plant as for the bio-electricity chain but with the only feedstock being natural gas, average Dutch electricity production, coal electricity production, modern natural gas electricity production and average European electricity production. In the following chapter background information on Malaysia and its palm oil industry is described in more detail (Chapter 2) before the applied methodology is discussed in Chapter 3. Input data is described in Chapter 4. The results of this study are presented in Chapter 5 and a discussion of them follows next (Chapter 6). Chapter 7 finishes this report with conclusions of the analysis. 2
A Greenhouse Gas Balance of Electricity Production from Co-firing Palm Oil Products from Malaysia
2. Malaysia Located in Southeast Asia, Malaysia covers over 32 million hectares of land; a land area almost eight times the size of the Netherlands. Malaysia is divided into two areas, peninsular Malaysia, where the capital city of Kuala Lumpur is to be found, and insular Malaysia (Borneo), where the two states Sarawak and Sabah are situated. While Sarawak and Sabah cover 60 percent of the total land, they only house one fifth of the total population. The remainder of the 24 million people are concentrated on the peninsula. A middle-income country, Malaysia’s GDP (purchasing power parity) amounts to 309 billion US dollar in 2006 with a real growth rate of 5.5 percent in the same year. The economy is multi-sectoral, 48 percent of the GDP is generated in industry (rubber and palm oil processing, light manufacturing, electronics, logging, petroleum production and refining) while services account for 44 percent. While the agricultural sector contributes 8 percent to the Malaysian GDP, the palm oil industry by itself accounts for 6.6 percent of the GDP (CIA, 2006; own calculations based on MPOB, 2006). The palm oil industry’s orientation towards export is represented by its 5.5 percent share of the total Malaysian export earnings (CIA, 2006; MPOB, 2006). Malaysia is the largest producer of palm oil in the world, producing 14.9 million tonnes of palm oil in 2005 (MPOB, 2006). Malaysia is closely followed by Indonesia with 13.6 million tonnes of palm oil in 2005 (MPOB, 2006). The Indonesian palm oil industry has been growing at a faster rate than the Malaysian and is predicted to surpass Malaysia as the world’s largest producer within a few years.1 Malaysia is also the world’s leading palm oil exporter: exporting 87 percent of the palm oil produced domestically or imported2 and processed in Malaysia, Malaysia can account for 50 percent of world exported palm oil. Together with Indonesia, they even account for as much as 85 percent of the world exported palm oil (Dehue, 2006). Besides the production of palm oil, several other products are generated in the palm oil industry, either during the production of palm oil or during the refining of palm oil.3 Among these products, palm fatty acid distillate (PFAD) is important for this study as it is used as a feedstock for electricity production in the Netherlands. PFAD is the free fatty acids (FFA) that are removed from crude palm oil (CPO) refining. The FFA content of CPO is 3.7 percent so that PFAD should be produced at a rate of about 3.7 percent of the processed CPO. In 2006, this amounted to 619 084 tonnes (MPOB, 2006). In Malaysia, approximately 4 million hectares of land are occupied by oil palm plantations (2005), representing 12 percent of total land area. The state with the highest production of palm oil was Sabah, making up more than one fourth of all Malaysian production. The peninsular states of Johor and Pahang follow next, together amounting to another fourth of the total production while Sarawak on fourth place accounts for 13 percent.
1
The increasing palm oil production in Indonesia is closely linked to Malaysia, as Malaysian palm oil companies are investing heavily in the Indonesian palm oil industry. 2 Imported palm oil only accounts for 3% of the Malaysian palm oil production. 3 These products include palm kernels (and its derivatives palm kernel oil and palm kernel expeller), refined, bleached and deodorized (RBD) palm oil (and its downstream derivatives RBD stearin and RBD olein), palm fatty acid (PFAD) and finished products such as shortening, margarine, and soap, among many others.
3
A Greenhouse Gas Balance of Electricity Production from Co-firing Palm Oil Products from Malaysia
Land use conversion as a result of palm oil production is a significant factor for the GHG balance of palm oil and this is why it is important to understand the current land use system and possible future changes. In Malaysia, 63 percent of land is covered by forest (down from 68 percent in 1990), including 3.8 million hectare of primary forest (same as in 1990), 15.5 million semi-natural forest (1 million hectares less than in 1990) and 1.6 million productive plantation (0.4 million hectares less than in 1990) (FAO, 2006). The semi-natural forest makes up almost 50 percent of Malaysia’s total land area and it is the forest type with most of the deforestation. It refers to a “forest or other wooded land of native species, established through planting, seeding or assisted natural regeneration” (FAO, 2006). This type of land includes those areas that were logged but no information is publicly available with which the degree or severity of disturbance can be determined. Thus, this land type may include land that is degraded as well as land that is only slightly altered from its original state. Sabah covers 7.3 million hectares of land of which nearly 50 percent is covered by forest. This is mainly forest with commercial purposes (3 million hectares including mangrove forests for commercial activities) where logging takes place, protected forest (0.57 million hectares) with different purposes such as conservation of flora, fauna and wildlife, conservation and protection of watersheds (Sabah Forestry Department, 2006). Representing less than two percent of the land in Sabah, peatland is estimated at 120 000 hectares of land (UNDP Malaysia, 2006). Currently, 1.2 million hectares are planted with oil palm in Sabah (MPOB, 2006). Oil palm growth until 2010 is projected at 3.7 percent per year so that the total land planted with oil palm will become 4.6 million hectare for Malaysia and the new plantations would account for 0.6 million hectares. It is projected that most of this expansion will take place on Borneo because of scarcity of land and higher prices for land in peninsular Malaysia and that the expansion will be mainly in the state of Sarawak as most of the suitable soils for oil palm have already been planted in Sabah (Teoh, 2000). Little information is available on what kind of land this expansion may take place. However, Teoh (2000) suggests that most of the suitable land for agricultural development, including the expansion of oil palm, in Sarawak are either in hilly or steep terrain or peat swamps, which may not make this land suitable in economic terms. A concern from the expansion of oil palm is Sarawak comes from that it accounts for over 70 percent of Malaysia’s peatland, amounting to 1.12 million hectares or 10 percent of the total land area in Sarawak (UNDP Malaysia, 2006) and that, at least some, plantations will be located on peatland, causing large emissions from drainage and oxidation of the organic matter. An option for reducing the pressure on this type of land and other ecologically valuable land is the oil palm expansion on severely degraded land, which was estimated to cover 0.5 million hectares of land in Malaysia (Hairiah (2000, In: Dehue, 2006). This amount of land could already cover 80 percent of the future required land. However, planting oil palm on degraded land will increase establishment costs and may reduce oil yields so that this land type is not as favourable for the palm oil industry. Furthermore, because it could not be determined where this degraded land is located and how severe the degradation is, it is not possible to determine how much the economic feasibility of planting degraded land with oil palm is affected.
4
A Greenhouse Gas Balance of Electricity Production from Co-firing Palm Oil Products from Malaysia
3. Methodology In this study, the greenhouse gas emission reductions from co-firing biomass with natural gas compared to a fossil reference system are determined on the basis of a life cycle inventory; an approach which accounts for all emissions from cradle to grave. The following methodology is developed on the basis of the preliminary Cramer Commission methodology for greenhouse gas calculations for bio-electricity (Bergsma et al., 2006). While the Cramer Commission methodology only gives the rough outline for calculating GHG emissions from bio-energy (bio-electricity, heat and fuels), we have developed this methodology in more detail for bioelectricity from palm oil products. The bio-electricity chain is based on the co-firing of natural gas (NG) with palm fatty acid distillate (PFAD) and crude palm oil (CPO) at the Essent Claus power plant. CPO is the main product of an oil palm plantation, while PFAD is a by-product of CPO refining. Due to this difference (main product vs. by-product), in the following two separate bio-energy chains are defined and their emissions are calculated independently (see section 3.2 for a description of CPO and section 3.3 for PFAD). The GHG emissions of by-products are calculated on the basis of system extension. This approach assumes that the by-product generated can replace the same or a similar product that was produced from another feedstock. Due to this replacement, an emission credit for the avoided GHG emission from the original production of the product can be determined. The method for dealing with system extension of a specific by-product is explained in the sections below that correspond with the origin of the by-product. As suggested by Bergsma et al. (2006), allocation of emissions to by-products will be based on market prices when system extension is not possible. The emission calculations for CPO and PFAD chains are based on CPO and PFAD production data that was collected during a field visit of oil palm plantations, mills and a refinery in Sabah, Malaysia.4 Besides this case study, which serves as the base case throughout the report, several other, general electricity cases/chains based on palm oil products are studied, in which for example other land use scenarios are assumed than those found in the case study. The variation in chain components and methodological assumptions are explained in the corresponding sections below.
3.1.
GHG Emission Reductions
The concept of GHG emission reduction from co-firing biomass, i.e. CPO and PFAD, for electricity production compares the emissions from the bio-electricity chain to a fossil reference system. The functional unit of this comparison is defined as producing 1 kWh electricity. Thus, the net avoided GHG emissions of 1 kWh bio-electricity equal the overall emissions of producing 1 kWh fossil electricity minus the overall emissions of producing 1 kWh bio-electricity. The overall emissions of 1 kWh electricity, both fossil- and bio-based, include all emissions occurring anywhere during resource extraction, treatment, transport, and power production. 4
This field visit took place at two plantations in Sandakan region, Sabah, Malaysia in February 2007. See Appendix 1 for more details on the timetable and the activities of the visit.
5
A Greenhouse Gas Balance of Electricity Production from Co-firing Palm Oil Products from Malaysia
Various bio-electricity systems (see section 3.2.6 (CPO cases) and 3.3.5 (PFAD cases)) are compared to a range of fossil reference systems (section 3.4). The three most important greenhouse gases, carbon dioxide (CO2), methane (CH4) and nitrous oxide (N2O), are accounted for. For comparing the emissions of these three gases, the concept of global warming potential (GWP) is applied by which the radiative forcing of the different gases can be compared. The other greenhouse gases (hydrofluorocarbons, perfluorocarbons, and sulphur hexafluoride) are not taken into account as it was found that, if they are even emitted, they contributed only so little to the GWP that they can be neglected (Bauen et al., 2006) The percentage of GHG emission reduction by the bio-electricity chain compared to the fossil reference chain is calculated by GHG emission fossil chain - GHG emission bio chain GHG reduction % = (1) GHG emission fossil chain The Cramer Commission target for GHG emission reductions in electricity production need to be at least 50 to 70% compared to the fossil reference system.
3.2.
CPO Production chain
CPO is the main product of milling the fresh fruit bunches (FFB), which are produced on an oil palm plantation. Within 2 to 3 years, an oil palm tree bears its first fruits and from then on for the next 20 to 25 years, each tree produces one FFB every 10 to 21 days. After harvest, the FFB are transported to a close-by mill, where they are first sterilized and then fruits are stripped from the stalk (the empty fruit bunches – EFB). EFB are generally returned to the plantation and applied as organic fertilizer but in some cases EFB may be burned in an incinerator for using the ash as fertilizer on low quality soils or for producing steam and electricity in a biomass boiler. The fruits are then converted into a homogeneous oily mash in a digester and pressed to extract most of the oil. After clarification, the oil is considered crude palm oil. The waste water generated from clarification, the palm oil mill effluent (POME), is treated in a ponding system. As a by-product of the pressing process, press cake of kernels and fibre is produced. Fibre is separated from the kernel and the kernels are dried and cracked to separate the palm kernel shells from the kernel. PKS and fibre are used at the mill as fuel for the biomass boiler, while kernels are generally sent off to kernel crushing to produce palm kernel oil (PKO) and palm kernel expeller (PKE) GHG emissions of the CPO production chain originate from 1) the conversion of the previous land use system to an oil palm plantation, 2) energy inputs to the oil palm plantation, 3) fertilizer production and application, 4) energy inputs to the mill and 5) transport of CPO from mill to the Netherlands (as can been seen in Figure 1 below). However, as briefly mentioned above, the production of CPO also generates various by-products for which emission credits may be given. By-products at the mill included empty fruit bunches (EFB), kernels, palm oil mill effluent (POME), palm kernel shells (PKS) and fibre.
6
A Greenhouse Gas Balance of Electricity Production from Co-firing Palm Oil Products from Malaysia Byproducts:
System boundaries
Land use change Oil palm plantation
- Fossil energy - Fertilizer production and application
PKS and Fibre
(feedstock for biomass
boiler)
FFB transport
EFB
Palm oil mill
- Fossil energy
CPO transport Co-firing in power plant
Emissions
Emission credit
(spread on field as fertilizer)
POME
(methane emissions from ponding system) Kernels Animal feed
PKE PKO
Surfactants
Emission or Emission credit
Carbon neutral
Soybean meal Crude oil
System boundaries
Figure 1: CPO production chain and overview of emission sources/credits
The striped box “reference land use” in Figure 1 emphasizes that, depending on the previous land use, greenhouse gases could be emitted or could be absorbed due to the land use conversion. This will be further explained in the following section.
3.2.1. Land use change Land use change refers to the conversion of one type of land (e.g. forestland) to another (in this case oil palm plantation). Such a conversion affects the carbon stocks of standing biomass, below ground biomass, soil carbon and carbon stored in dead organic matter. For all negative carbon stock changes, it is assumed that, due to the land use change, carbon is removed (and not transferred to other carbon pools such as from above-ground biomass to dead organic matter or litter) and emitted entirely as atmospheric CO2 (as suggested by Tier 1 of the IPCC methodology). In some cases, more atmospheric carbon is taken up by the oil palm plantation than lost during land conversion (i.e. carbon stocks of degraded land is smaller than carbon stocks of an oil palm plantation) so that there is CO2 sequestration. The 2006 IPCC Guidelines for National Greenhouse Gas Inventories (IPCC, 2006; Volume 4) are used to determine the annual carbon stock changes in above- and below-ground biomass, dead organic matter (DOM) and soil as a result of land use change. As already noted in Bergsma, et al. (2006), the IPCC guidelines do not directly provide a methodology for accounting GHG emissions of projects which last several years. However, Bergsma, et al. (2006) suggest actually accounting for the GHG emissions from land use change over the full lifetime of a plantation. Therefore, the IPCC methodology is modified so that the calculations can incorporate the land use change effects over the lifetime of a plantation, which is 25 years for an oil palm plantation, and so that the calculations allocate these effects equally to each amount of FFB produced during this lifetime. This adjustment is made so that each tonne of palm oil includes its share of the GHG emissions that are associated with the land use change from the establishment of the plantation. Thus, first all carbon stock changes over the plantation lifetime are calculated (as explained below), added up and then divided by the plantation lifetime. 7
A Greenhouse Gas Balance of Electricity Production from Co-firing Palm Oil Products from Malaysia
Due to the modification of the IPCC methodology to this study (and also due to different objectives of this study from those of the IPCC guidelines), the applied equations from the IPCC guidelines have to be adjusted. The calculations are explained below and equations are presented in Appendix 2.
a. Carbon stock changes in above- and below-ground biomass Biomass carbon stock changes due to land use change are calculated for above-ground biomass and are the difference between carbon stored in biomass after and carbon stored in biomass before the land conversion. In accordance with Tier 1 of the IPCC guidelines, the carbon stock changes in below-ground biomass are assumed to be zero, meaning that the carbon assimilated in below-ground biomass is assumed to stay the same.5 Various scenarios of previous land use can be made and the following are considered in this study as they are land use types that are frequently encountered in areas with palm oil production (see Chapter 2):
Primary tropical forest Primary tropical forest is here considered to be unaffected by human activities and, for simplicity reasons, it is characterised only by a very high amount of standing biomass in this study. While it is unlikely that this forest type is converted to oil palm plantation in Malaysia (the land is protected by law), this type of land conversion is taking place in Indonesia. Logged over forest Logged over forest was originally primary forest but was then adversely affected by unsustainable timber harvest. It is estimated that nearly 65 percent of all forested land in Malaysia has been affected by logging (Musa et al., 2003) but as described above, no information is available on the severity of disturbance by logging, the amount of land affected by the different levels of disturbance, when it was logged and what has happened since. Here, an average 50 percent reduction (from the primary tropical forest) in standing biomass is assumed (based on 22 to 67 percent reduction in biomass (Lasco, 2002). Degraded forestland Degraded forestland is land that was originally covered by forest but was so severely damaged (by excessive timber harvest, poor management, repeated fires or other disturbances) that re-establishment of forest is inhibited or delayed for long periods of time. It is common that in such situations, weeds invade the land. The most common of those weeds in the tropical region is the perennial, rhizomatous grass Imperata cylindria (Syahrinudin, 2005). Hairiah (2000, In: Dehue, 2006) estimates that 500 thousand hectares of land are covered by Imperata cylindria, accounting for 1.5 percent of the total land in Malaysia. While this is a small share in the total land, it is almost enough by itself to meet the required land for future growth (see Chapter 2). Moreover, Imperata cylindria is estimated to have invaded 8 million hectares of land in Indonesia (Syahrinudin, 2005). Therefore, in this study it is assumed that the degraded land is covered by Imperata cylindria. Peatland Peatland is a wetland which is characterized by the accumulation of partially decomposed plant matter. Conversion of peatland to agro-forestry land not only results in the loss of
5
Whether this assumption is realistic is discussed in chapter 6 below.
8
A Greenhouse Gas Balance of Electricity Production from Co-firing Palm Oil Products from Malaysia
carbon from standing biomass (here it is assumed that it is a forest) but also in CO2 emissions from oxidising peat. Both of these emission streams are accounted for in this study. In this study, the land use system after conversion is an oil palm plantation, which assimilates some CO2 over its lifetime. Only the assimilation of CO2, which is fixed in the oil palm trunk and in the fronds which are not cut at harvest, is calculated. This assimilation is hereafter called net CO2 assimilation. Fresh fruit bunches (FFB) and the fronds that are cut off at harvest are not taken into account. This delineation is necessary so that it can be assumed that FFB and its products (CPO) and by-products (EFB, PKS, fibre) are carbon neutral in the rest of the production chain.
b. Carbon stock changes in dead organic matter (DOM) Carbon stock changes in dead organic matter (DOM) are the difference in DOM carbon of the new system minus DOM carbon of the old land use system. Appendix 2 presents the equation applied. DOM carbon before the conversion is estimated with the default value of IPCC, while DOM carbon directly after the conversion is assumed to be zero in IPCC’s Tier 1 approach. Over the 25 years of one plantation rotation DOM is generated again and it is enhanced at the oil palm plantation by the EFB and fronds application as fertilizer. In this study, the results from field experiments (Syahrinudin, 2005) are taken for estimating DOM carbon at the case study plantation.
c. Carbon stock changes in soil Carbon stock changes in soil are based on the difference in soil organic carbon (SOC) after the conversion minus the soil organic carbon before the conversion. The SOC before conversion is calculated by multiplying the reference SOC, which depends on the prevailing climate regime and soil type, by the stock change factors for management, carbon input and land use system. The SOC after conversion can be calculated in the same way but since these stock change factors are specific for oil palm plantation but rather agro-forestry systems in general, it is here chosen to take the results of field experiments (Syahrinudin, 2005) for estimating the soil carbon at an oil palm plantation. d. Displacement of prior crop production (indirect land use changes) Not included in this study, as suggested by Cramer methodology (Bergsma et al., 2006), is the displacement of prior crop production and the possible land use induced by the movement of prior crop production to other areas. However, it needs to be noted that this displacement may have a potentially large contribution to the overall GHG emissions. The effects of this issue are minimized for the case study because there was no prior crop production on the land (forest or degraded land). But if it is assumed that the previous land use was a rubber plantation, the displacement of rubber production to other sites may have a large impact on the GHG balance. This aspect is not taken in account in this study.
3.2.2. Oil Palm Plantation For the production of FFB at an oil palm plantation various inputs (e.g. diesel and fertilizer) that can cause GHG emissions are needed. While most of the harvest is done manually and with the help of oxen pulling the harvest to the roadside, some machinery and farm equipment are applied that run on diesel and that contribute to GHG emissions from fossil energy use. For the case study, fossil energy consumption for transporting FFB to the mill is accounted 9
A Greenhouse Gas Balance of Electricity Production from Co-firing Palm Oil Products from Malaysia
for in the total diesel consumption of the plantation (rather than in the transport section below) because the plantation managers provide the fuel and do not have separate accounts of this diesel consumption. The GHG emissions from fossil energy are calculated by GHGenergy = fuel × EF where GHG energy – GHG emissions from energy inputs (kg CO2-eq/ha.yr) fuel – the amount of diesel (GJ/ha.yr) EF – emission from diesel (kg CO2-eq/GJ)
(2)
GHG emissions from the production of machinery (both for biomass production and for milling) are not included because they are expected to be small compared to the emissions from the whole chain and because similar studies have also excluded them (Bauen et al., 2006). Similarly, the GHG emissions from the production of machinery and equipment in the other chain components are also not included. Moreover, nitrogen fertilizer is applied at the oil palm plantationswhich causes N2O emission on the field and other GHG emissions during its production. According to the suggestions by the Cramer methodology only the GHG emissions from nitrogen (N) fertilizer production are calculated. The reason for not including GHG emissions from phosphate (P) and potash (K) fertilizer production is that they are very small compared to N fertilizer production (approximately 40 times less for P and K fertilizer production than from N fertilizer production) (Bergsma et al., 2006). The GHG emissions from N fertilizer production are calculated by
GHG N production = where
2 F =1
( FertilizerF * EFF )
(3)
GHGN production – GHG emissions from N fertilizer production (kg CO2-eq / ha.yr) Fertilizer – amount of nitrogen input (tonne N/ha.yr) EF – emission factor of fertilizer production (kg CO2-eq/tonne N fertilizer) F = 1 – urea, F = 2 – ammonium sulphate
To determine the emission factor of fertilizer production it needs to be known what type of nitrogen fertilizer (e.g. urea, ammonium sulphate or other N fertilizers) is applied and how it is produced (old vs. modern fertilizer production). The N2O emissions from fertilizer application are calculated according to the IPCC guidelines for N2O emissions from managed soils (Vol. 4, Chapter 11) where, as a default value, it is assumed that 1 percent of the N applied to the soil is released to the atmosphere as N2O-N.6 The following equation is applied GHG N application = Fertilizer * EFN application (4) where GHGN application – GHG emissions from N fertilizer application (kg CO2-eq / ha.yr) Fertilizer – amount of nitrogen from urea and ammonium sulphate fertilizer (tonne N/ha.yr) 6
N2O-N refers to the amount of nitrogen that is present in the nitrous oxide emissions. In order to determine the N2O emissions this value has to be multiplied by the molecular weight ratio of N2O to N2O-N (44/28).
10
A Greenhouse Gas Balance of Electricity Production from Co-firing Palm Oil Products from Malaysia
EF N application – emission factor of nitrogen fertilizer application that is calculated by (kg CO2-eq / kg N) 0.01 kg N 2 O − N 44 mol N 2 O EFN application = × × GWPN 2O (5) kg N applied 28 mol N 2 O − N where 0.01 kg N2O-N/kg N applied - IPCC default value for direct N2O-N emissions from N fertilization, 44 mol N 2 O - conversion of N O-N emissions to N O 2 2 28 mol N 2 O − N
emissions, GWPN2O – global warming potential of N2O Also, organic fertilizers (such as fronds and EFB) are applied. However, their emissions are not accounted for as they are carbon neutral, assuming that they decompose aerobically and therefore only produce CO2 emissions which are equivalent to the CO2 assimilated during their growth (as explained in section 3.2.1). Another input is pesticides. The Cramer methodology suggests omitting the emissions from pesticide production because of its very small contribution to the overall GHG emissions (less than 0.5 percent according to Bauen et al. (2006)). Therefore, these emissions are excluded in this study as well. As the production of FFB and operation activities change with the age of the plantation, this study applies average values for diesel and fertilizer consumption. The GHG emissions are first calculated per hectare and converted to per “GJCPO” by dividing with the FFB yield, the oil extraction rate and the energy content of CPO.
3.2.3. GHG Emission Flows at Mill GHG emissions from the mill are produced primarily by the diesel generator and by the waste water (palm oil mill effluent (POME)) treatment. As shown in section 3.2.2, GHG emissions from energy inputs to the mill are calculated by multiplying the fuel input by the emission factor of the specific fuel type. Again, GHG emissions from the production of machinery are not included. The by-products of the mill include palm kernel shells (PKS), fibre, empty fruit bunches (EFB), POME and kernels. GHG emission credits are given if the by-product is used to replace another product outside the system boundaries (see Figure 1). PKS and fibre do not receive any GHG emission credit as they are used for electricity production within the mill by which the consumption of diesel is reduced. Since PKS and fibre are assumed to be carbon neutral as they sequestered the carbon previously on the plantation, no emissions are calculated. EFB are returned to the field as organic fertilizer and are considered carbon neutral (see section 3.2.1). Kernels are given GHG emission credits because they are used to produce PKO, which can then be used for surfactant production and therefore replaces surfactant production from crude oil, and palm kernel expeller, which is used as animal feed and is assumed to replace soy meal. 11
A Greenhouse Gas Balance of Electricity Production from Co-firing Palm Oil Products from Malaysia
PKO is here assumed to be a feedstock in the production of alcohol ethoxylates (AE) and that, as a final product, it replaces AE3 from petrochemical (Pc) feedstocks.7 Note that a Pcsurfactant-by-PKO-surfactant displacement of 1:1 is assumed based on Stalmans et al. (1995). Credit for PKO surfactant will be calculated by, first, determining the emission factor of crude oil surfactant and of PKO surfactant, based on the emissions determined for average production in Germany (Patel, 1999). Then, the difference in emission factors is taken and multiplied by the amount of surfactants that can be replaced by CPKO. (6) GHG EC PKO = Surfactant × ( EFPKO − EFPc ) where GHG EC PKO – GHG emission credit for palm kernel oil (kg CO2-eq / GJ CPO) Surfactant – amount of petrochemical surfactants replaced by PKO surfactant (tonne surfactant / GJ CPO). EF PKO - Emission factor of oleochemical (PKO) surfactant (kg CO2-eq/ tonne PKO surfactant) EF Pc – Emission factor of petrochemical surfactant (kg CO2-eq/ tonne Pc surfactant)
PKE is assumed to replace soybean meal as animal feed. GHG emission credit for PKE is calculated by multiplying the difference in emission factors of soybean meal, which is based average production in the USA, import to and processing in the Netherlands as was done in Damen and Faaij (2006), and PKE with the amount of soybean meal that is displaced by PKE.
GHG PKE = animal feed × ( EFPKE − EFsoy ) (7) where GHG EC PKO – GHG emission credit for palm kernel oil (kg CO2-eq / GJ CPO) Animal feed – amount of soy-based animal feed replaced by PKE (tonne animal feed / GJ CPO) EF PKE - Emission factor of PKE (kg CO2-eq/tonne PKE) EF soy – Emission factor of soybean meal (kg CO2-eq/tonne soybean meal) Palm oil mill effluent (POME) is a by product from the mill operation and during the first step of POME treatment (anaerobic digestion) methane is emitted.8 As no case-specific data is available on the methane emissions, values from literature are taken. Large discrepancies in CH4 emissions from POME were found in literature. Most of these studies refer to the results from Ma (1999 In: Shirai et al., 2003), who determined CH4 emissions under such conditions that complete anaerobic digestion can take place. More recently, Shirai et al. (2003) conducted field experiments in which they measured CH4 emissions from POME lagoons and ponds and found that emissions are lower than predicted by Ma (1999, In: Shirai et al., 2003). As outdoor conditions have a large impact on the completeness of the anaerobic digestion, it is in this study chosen to use the results of Shirai et al. (2003). CH4 is generated during the anaerobic digestion of POME, which is derived from FFB milling. Therefore, the amount of carbon released as CH4 is the same amount as had been sequester during the growth of FFB. But, because it does not decompose aerobically (when CO2 emissions would equal the CO2 assimilation absorption during FFB growth) but rather anaerobically, the carbon is released in the form of methane (rather than CO2), thereby 7
Other products or feedstocks may also be possible. The sensitivity analysis verifies how the results are affected when other feedstocks are applied. 8 The other steps in POME treatment, including aerobic digestion and settlement of solids, occur in separate ponds.
12
A Greenhouse Gas Balance of Electricity Production from Co-firing Palm Oil Products from Malaysia
increasing the net emissions. Thus, for each tonne of methane from anaerobic digestion one tonne of CO2 would have been emitted if the decomposition had taken place aerobically. Therefore, the emission factor for POME treatment (EFPOME) is taken as (23 tonne CO2-eq / tonne CH4 – 1 tonne CO2-eq / tonne CH4 = ) 22 tonne CO2-eq tonne CO2-eq / tonne CH4. Thus, the GHG emissions for POME are calculated as follows: GHG POME = methane × EFPOME (8) where GHG POME – GHG emissions from POME treatment (kg CO2-eq / GJ CPO) Methane – amount of methane emitted (m3 CH4 / GJ CPO) calculated by multiplying POME yield (m3 POME / tonne CPO) with the biogas yield (m3 biogas / m3 POME) and the share of methane in the biogas (%) and dividing by the energy content of CPO (GJ/tonne CPO) EFPOME – Emission factor of POME treatment (tonne CO2-eq tonne CO2-eq / tonne CH4, as described above)
3.2.4. GHG Emissions from CPO Transport GHG emissions from transport account for the transport of CPO by trucks to harbour, the transport of CPO by ship to Rotterdam, the Netherlands and the transport from Rotterdam to the Claus power plant (Maasbracht, the Netherlands). Typical transportation types, fuels and emissions are applied based on the calculations made by Damen and Faaij (2003). GHG emissions due to transporting CPO are calculated by GHGtransport = ( where
3
T =1
EF f ,T × distanceT) / CPO energy content
(9)
GHGtransport – GHG emissions from transport (kg CO2-eq/GJ CPO transported) EFf,T – emission factor (kg CO2-eq/tonne.km), depending on the fuel type used T = 1 – transport from mill to harbour T = 2 – transport from harbour to Rotterdam, the Netherlands T = 3 – transport from Rotterdam to Claus power plant, Maasbracht, the Netherlands distance – transport distance (km) CPO energy content – 36 GJ/tonne
3.2.5. GHG Emissions from Co-firing CPO The CO2 emissions from co-firing CPO for electricity production do not need to be accounted for in the GHG balance of CPO as the emitted CO2 is equal to what the palm tree had taken up in producing the oil-rich fruits. Another source of GHG emissions at the power production site is the investments that were necessary to adapt the Claus power plant to allow co-firing with bio-fuels. This investment was likely to have caused some emissions (i.e. during steel production). However, if they were to be allocated over the lifetime of the power plant and per tonne CPO consumed, the effects will be minor compared to the overall GHG emissions. Therefore, the Cramer Commission methodology (Bergsma et al., 2006) suggests to neglect these, as was done in this study.
13
A Greenhouse Gas Balance of Electricity Production from Co-firing Palm Oil Products from Malaysia
3.2.6. Overview of CPO Production Cases All emissions from CPO production chain are finally converted to emissions per GJCPO delivered and per kWh in order to allow comparison with other fuels (see section 4 for input data for conversion of CPO to electricity). As previously mentioned, various land use reference systems, methodological issues such as the allocation of land use emission over different time spans and different ways of dealing with by-products, and management improvement options for the plantation and mill are studied. Each case is briefly described below and Table 1 gives an overview of the different cases that are analysed.
Land use reference systems Base case The base case accounts for oil palm plantation on previously logged over forest as has been encountered in the Malaysian case study. Land use change emissions are allocated over a period of 25 years, which is the average lifetime of an oil palm plantation. System extension is applied in order to account for by-products during CPO production. Production data from the plantation and the mill are based on the field visit to oil palm plantations in north-eastern Borneo. Natural rainforest This case is the same as the base case except that the oil palm plantation is assumed to be located on previously natural rainforest land. Degraded land This case is the same as the base case except that the oil palm plantation is assumed to be located on previously degraded land. Peatland This case is the same as the base case except that the oil palm plantation is assumed to be located on forested peatland. Use of biomass This case is the same as the base case except that not all carbon stored in the standing biomass of a logged over forest is released as atmospheric carbon. It is assumed that 20 percent of the carbon is stored in furniture and other long-lasting timber products.9 No land use emissions This is the same as the base case but without accounting for emissions from land use change. Management Management improvement options for CPO chain Four improvement options are studied in order to determine by how much the GHG emissions of the base case can be reduced: 1. Replacing degraded land instead of logged over forest by oil palm plantation. 2. Reducing CH4 emissions from POME: This is possible if anaerobic digestion of POME takes place in a closed container so that the generated biogas can be collected easily. In this case, the CH4 emissions from outdoor POME treatment are avoided and, if the biogas is collected and then also burned for powering a generator, electricity can 9
This assumption was made because logging takes place primarily for timber purposes.
14
A Greenhouse Gas Balance of Electricity Production from Co-firing Palm Oil Products from Malaysia
be produced.10 Assuming the national electricity grid to be close to the mill, the produced electricity could be fed into the grid, replacing electricity from other sources. The emission credit for displacing average electricity production from the grid equals the amount of electricity produced from the collected methane multiplied by the GHG emission factor of average electricity production.11 3. Increasing the yield of oil palm by applying tree species with increased fruit production. 4. Applying more organic nitrogen fertilizer: It is here assumed that the nutrient-rich slurry from the POME treatment is returned to the field and applied as fertilizer, thereby reducing inorganic fertilizer application.12
Investigating methodological issues Two methodological issues of the GHG emission calculations are further investigated because they remain unsolved in the Cramer Commission. These are the allocation of GHG emissions from land use change over time and the distribution of GHG emissions to by-production (as also suggested by Reijnders and Huijbregts, 2002). Table 1: Description of CPO production cases Chain Name of case Land use change: # original land type
Land use 1 Base case 2 3
Natural rainforest Degraded
4 5
Peatland Use of biomass
6
No land use
Management 7 Management improvement
Method 8 9 10
13 yr allocation 100 yr allocation Market price
Logged-over rain forest Natural rain forest
Land use change emission: time for allocation (years) 25
Allocation / system extension
CPO/PFAD production data
""
system extension ""
Production data from case study ""
Degraded land (grassland) Peatland Some of the carbon is stored in timber products Emissions from land use change not accounted for
""
""
""
"" 25
"" ""
"" ""
""
""
""
Degraded land (grassland)
""
system extension
CH4 collected and electricity production, improved yields, increased organic fertilizer application
Logged-over rain forest ""
13
""
""
100
""
""
Logged-over rain
""
Allocation
""
10
If closed anaerobic digestion takes place, it is assumed that CH4 is produced at the rates suggested by Ma (1999 In: Chavalparit, 2006). 11 As the case study is situated in Malaysia, it is here assumed that one unit of POME-based electricity replaces one unit of average Malaysian electricity production. The emission factor for average Malaysian electricity production is taken from Damen and Faaij (2006) as 529 g CO2-eq / kWh. 12 This has been newly required by Malaysian law and is to be implemented this year.
15
A Greenhouse Gas Balance of Electricity Production from Co-firing Palm Oil Products from Malaysia
11 12
allocation
forest
Allocation by mass Allocation by energy
""
""
""
""
Applying the lower value of IPCC for standing biomass (logged over forest) Applying higher value of IPCC for standing biomass (logged over forest)
""
""
Applying the best production data for plantation and mill
""
""
Applying the worst production data for plantation and mill
Sensitivity 13 Best case
14
Worst case
by market price Allocation by mass Allocation by energy
"" ""
Note: "" - same as above
13 year This case is the same as the base case except that land use emissions are allocated over 13 years. This time span is suggested to be applied in the methodology for carbon reporting under the Renewable Transport Fuel Obligation (RTFO) in the UK (E4Tech, 2007). 100 year This case is the same as the base case except that land use emissions are allocated over 100 years as is done when calculating the global warming potential of GHG emissions (IPCC, 2006). Allocation by market prices This case is the same as the base case except that by-products are not accounted for by system extension, i.e. giving credits based on alternative uses, but by allocating emissions to them based on market prices of the products. This has been discussed as an alternative in the Cramer Commission methodology in case system extension is difficult to define (Bergsma et al., 2006). Allocation by mass This case is the same as the base case except that by-products are not accounted for by system extension but by allocating emissions to them based on the mass of the products. Allocation by energy This case is the same as the base case except that by-products are not accounted for by system extension but by allocating emissions to them based on the energy content of the products. Investigating the Sensitivity of the Base Case Two more cases are studied in order to determine the sensitivity of the overall GHG emissions on the found data ranges. During the field visit but also from literature review it was seen that large ranges can be found for many of the studied parameters (see input data tables section 4). To show this uncertainty, a best case and a worst case are determined based on the extremes of the data ranges. Best case In the best case, the values leading to the lowest GHG emissions of the CPO production chain are applied for all the parameters for which ranges were found. 16
A Greenhouse Gas Balance of Electricity Production from Co-firing Palm Oil Products from Malaysia
Worst case In the worst case, the values leading to the highest GHG emissions of the CPO production chain are applied for all the parameters for which ranges were found.
3.2.7. Sensitivity Analysis Besides the best case and worst case, a sensitivity analysis is conducted for individual parameters for which large ranges were found. The parameters that are tested and the ranges applied can be found in Table 10 (chapter 4). The results of the sensitivity analysis will be presented in a spider diagram.
3.3.
PFAD Production Chain
To make it edible, CPO is refined, filtering the fatty acids from the oil and producing refined, bleached and deodorized (RBD) oil. The filtered fatty acids then make up the palm fatty acid distillate. PFAD is commonly used in producing soap, animal feed, plastics and other intermediates for the oleochemical industry. Recently, PFAD has been applied for power production; its high energy content (43 GJ/tonne) and the small conversion that is needed to co-fire it with natural gas have contributed to the increasing use of PFAD in the energy industry. Being a by-product of CPO refining, the PFAD GHG balance does not need to account for the emissions from oil palm plantations and the milling process. Instead only those emissions from the energy use during refining, transportation to the power plant and the emissions from displaced alternative uses of PFAD are included. Figure 2 below illustrates the PFAD production chain, the various sources of GHG emissions and also emission allocation to byproducts; each of these topics is discussed below. CPO CPO refinery
- Fossil energy - Alternative use of PFAD
Main product of refinery: RBD oil
PFAD transport Co-firing in power plant System boundaries
Emissions
Allocation of emissions by market price
Carbon neutral
System boundaries
Figure 2: PFAD production chain and overview of emission sources
17
A Greenhouse Gas Balance of Electricity Production from Co-firing Palm Oil Products from Malaysia
3.3.1. GHG Emissions from CPO Refinery The main product of CPO refining is refined, bleached and deodorized (RBD) palm oil and its further derivatives such as RBD stearin and olein. While PFAD is considered a by-product, it is an important product for the oleochemical and animal feed industries. It is therefore chosen to include the refinery in the PFAD production chain even though the Cramer Commission methodology suggests not including this component for residues that are used for bio-energy production (the exclusion of the refinery and its emissions is discussed in section 6). As system extension is difficult with RBD palm oil (because of its multiple uses and functions in the food industry, the cosmetic and detergent industry and the chemical industry) and system extension is done for by-products and not for main products such as RBD, the energy inputs to the refinery are allocated to RBD palm oil and PFAD based on market prices. The CPO refinery consumes steam and electricity; in the case study electricity is bought from the grid, produced onsite from biomass, i.e. from combustion of EFB, PKS and fibre from independent mills, and produced onsite from fossil diesel in a generator. Biomass streams for steam and electricity production is assumed to be carbon neutral because EFB, PKS and fibre are by-products of palm oil milling. Emissions from grid-electricity are assumed to be the same as the average emission from Malaysia electricity production (see Table 3 for the input data). Other inputs required in the refinery are bleaching earth and phosphoric acid, both required in such small quantities (7 kg bleaching earth per tonne CPO processed and 0.5 kg phosphoric acid per tonne CPO processed) that the possible emissions of their production and use can be neglected here.
By-products from refining Besides PFAD, there are no other by-products from the CPO refining process.
3.3.2. Alternative use of PFAD PFAD can be used for many different applications in the food and oleochemical industry and as a raw material for animal feed production but its primary use is in soap and detergent production, where 30 percent of all fatty acids are consumed (Rupilius and Ahmad, 2006). Therefore, this study assumes that the alternative use of PFAD is for soap production. It is further assumed that the PFAD, which was formerly used for soap production is now used for energy purposes, is substituted by tallow from beef production as both contain mainly long chain esters (C16 to C18) and that this substitution takes place at a rate of 1:1 (by weight).13 The emission factor is based on the life cycle inventory of tallow production in Switzerland conducted by Nemecek et al. (2004). The GHG emissions of the alternative PFAD use are then calculated as follows:
GHGalternative PFAD use = tallow × EFtallow / EC PFAD (10) Where GHGalternative PFAD use – GHG emissions associated with alternative PFAD use (kg CO2-eq / GJPFAD) Tallow – amount of tallow that will be needed to replace PFAD in soap production (1 tonne tallow / 1 tonne PFAD) EF Tallow - Emission factor of tallow (kg CO2-eq/tonne tallow) 13 Because PFAD consists of exactly the same fatty acids as palm oil, it is assumed that the 1:1 substitution of tallow and palm oil as applied by Postlethwaite, 1995 is also valid for PFAD and tallow.
18
A Greenhouse Gas Balance of Electricity Production from Co-firing Palm Oil Products from Malaysia
EC – Energy content of PFAD (MJ/tonne PFAD)
3.3.3. GHG Emissions from PFAD Transport PFAD is transported by ship from Malaysia to Netherlands (T = 1) and then by ship to the Essent Claus power plant (T = 2). Due to similar energy content and density values of PFAD and CPO, it is assumed that the energy requirements for PFAD transport to and within the Netherlands is the same as that for CPO (see section 3.2.4). The emissions from PFAD transport will be lower since their transport within Malaysia does not need to be accounted for as it is a by-product of CPO refining.
3.3.4. GHG Emissions from Co-firing PFAD The CO2 emissions from co-firing the PFAD for electricity production do not need to be accounted for as it is assumed that, when CPO is produced sustainably, the emitted CO2 equals the CO2 assimilation that took place in growing the fruits, which are used for producing CPO.
3.3.5. Overview of PFAD Production Cases Also for PFAD different cases can be determined. Due to less components of the PFAD production chain, only four cases are distinguished (as presented in Table 2 below).
PFAD base case14 PFAD is produced as described above. As mentioned, system extension is not possible so that allocation of emissions to other products is based on market prices of the different products. Table 2: Description of PFAD cases Chain # Name of chain 1 PFAD base case 2 PFAD mass 3 PFAD energy 4 PFAD – no refinery emissions
Allocation Allocation by market prices Allocation by mass Allocation by energy n/a
PFAD mass Same as PFAD base case except that allocation is based on mass of the products. PFAD energy Same as PFAD base case except that allocation is based on the energy content of the products. PFAD no refinery emissions A fourth PFAD case is investigated in which the emissions of the refinery are not accounted for; i.e. the GHG emissions from the fossil energy consumption. This case is based on the idea that PFAD can be treated as a residue rather than a valuable by-product (as done in the other cases). For electricity production from residues, the Cramer Commission methodology 14
Note that the fly ash level of PFAD-based electricity production is higher than the Dutch standard of 0.06%, which is why PFAD must be co-fired with CPO (producing only 0.01% fly ash) in order to reduce fly ash content of the emissions (Bradley, 2006).
19
A Greenhouse Gas Balance of Electricity Production from Co-firing Palm Oil Products from Malaysia
suggests that only the emissions associated with PFAD treatment, transport or consumption need to be accounted for. Then, emissions from fossil energy consumption during refining need not be included.
3.4.
Fossil Electricity Reference System
For determining the GHG emission reductions from employing bio-energy chains, a fossil reference electricity system is defined. Here, for the base calculations the fossil reference system is the Essent Claus power plant, when operating only on natural gas.
3.4.1. Electricity from Claus Natural Gas Power Plant This study is based on the Essent Claus power plant, where CPO and PFAD are co-fired with natural gas (NG). The fossil electricity reference system is the production of electricity at the Claus power plant without co-firing CPO or PFAD. GHG emissions from the NG production chain include emissions from mining, transporting and combusting NG as presented in Figure 3 below. NG Production Chain System boundaries
NG extraction Energy inputs
NG
transport
NG power plant
Combustion of NG Emissions
Figure 3: Natural gas production chain and overview of emission sources
GHG Emission from Extraction and Transport of Natural Gas Energy requirements for winning and distributing natural gas range from 1 to 5 percent of energy delivered (Blok, 2004); here the GHG emissions of the winning and distribution of NG are assumed to be 2 percent of the direct emissions from NG combustion. GHG Emissions from Natural Gas Electricity Production The direct CO2 emissions of combusting natural gas in the case study are taken from the emission measurements of the Essent Claus power plant. While only CO2 emissions are measured there, also CH4 and N2O emissions are produced, generally though in much smaller quantities. From comparison with other NG power plants in the Netherlands it can be seen that approximately an additional 2 percent of CO2-equivalent is emitted due to CH4 and N2O emissions (UBA, 2006). Therefore, here an additional 2 percent of the CO2 emissions account for the CH4 and N2O emissions.
20
A Greenhouse Gas Balance of Electricity Production from Co-firing Palm Oil Products from Malaysia
3.4.2.
Other fossil reference systems
For further comparison other fossil reference electricity systems are also defined because that can influence the GHG emission reduction. These are • Average Dutch electricity production (based on Damen and Faaij, 2006)15 • Modern NG power plant (Alsema and Nieuwlaar, 2000 In: Reijnders and Huijbregts, 2003) • Coal power plant (based on Damen and Faaij, 2006) • Average EU electricity production (based on EU 25; UBA, 2006) For each fossil reference system the GHG emissions from electricity production are determined. Besides the direct emissions from electricity production, the applied emission factors also include the extraction, possible pre-treatment, and transportation of the fuel to the power plant. The emission factors are presented in Table 8 in the Input Data section.
3.5.
Other Environmental Criteria of the Cramer Commission
Besides the GHG balance, the Cramer Commission has also formulated criteria for other environmental criteria (Cramer Commission, 2007). The following five issues related to the environment are listed: 1. Waste management 2. Use of agro-chemicals (including fertilizer) 3. Prevention of erosion and soil exhaustion 4. Active improvement of the quality and quantity of surface and ground water 5. Emissions to air For 2007 the Cramer Commission has laid out that the plantations must comply with local and national law regarding the subtopics 1, 2 and 5, while they are obligated to report about the subtopics 3 and 4 (Cramer Commission, 2007). In this study, we qualitatively describe how the case study plantation deals with the five subtopics of the environmental criteria. In order to examine whether local and national laws are obeyed, a thorough analysis of the existing laws and regulations as well as an analysis of the general compliance (and not just for the case study) is needed. This is beyond the scope of this study and needs to be treated in additional studies.
15
The electricity mix for the Netherlands in 2000 is 62% natural gas, 26% coal, 5% oil, 2% nuclear and 5% other (hydropower, wind and waste) (Damen and Faaij, 2003).
21
A Greenhouse Gas Balance of Electricity Production from Co-firing Palm Oil Products from Malaysia
4. Input data Table 3: Input data: Land use change PARAMETER Unit
Value (Range)
Remarks
Source
Biomass Above ground biomass before land conversion tropical forest
Tonne dm / ha
350
logged over forest
Tonne dm / ha
175
degraded land Above ground biomass after land conversion Biomass over 25 years at oil palm plantation Carbon faction Natural rain forest
Tonnes dm/ha tonne dm / ha
6.2 0
Tonne dm / ha
118
Syahrinudin, 2005
Tonne C / tonne dm Tonne C / tonne dm Tonne C / tonne dm
0.49
IPCC, 2006
0.4
Syahrinudin, 2005
0.4
Grassland (Imperata cylindrica)
Syahrinudin, 2005
Tonne C / ha
2.1
Tropical, broadleaf deciduous
IPCC, 2006 (T2.2)
Tonne C / ha
0
Default value
IPCC, 2006
Tonne C / ha
5.9
Tonne C / ha
60
Palm tree Grassland DOM Carbon stocks of litter and dead wood before conversion Carbon stocks of litter and dead wood after conversion Carbon stock of litter and dead wood palm plantation Soil Reference soil organic carbon stock Soil organic carbon – oil palm plantation Stock change factor for land-use system, management, input – native forest Time Peatland Carbon emission factor from drained forested peatland16
Value depends on location and type of forest 50% of original (22-67% reduction) Grassland
years Tonne C / ha.yr
Lasco, 2002 IPCC, 2006 IPCC, 2006
Syahrinudin, 2005
Case study area: low activity clay, tropical, wet
IPCC, 2006 (T 2.3) Syahrinudin, 2005
Native forest
IPCC, 2006 (T5.10)
40 dimensionless
IPCC, 2006 (T4.7)
1.00
25
IPCC, 2006
10.7 (1.36 – 20)
16
Range: Emission factors for shallow drainage and for deep drainage
IPCC, 2006 (T4.6, 5.6)
In the IPCC guidelines CO2 emissions from peat oxidation are given depending on the original land type and the land type it is being converted to (since different land types have different drainage depth requirements). For cropland (needing deeper drainage), a value of 20 tonne C per hectare per year is assumed. However, the
22
A Greenhouse Gas Balance of Electricity Production from Co-firing Palm Oil Products from Malaysia N2O emission factor for drained peatland
kg N2O-N / ha.yr
8
IPCC, 2006 (T11.1)
Table 4: Input data: Oil palm plantation PARAMETER Unit Plantation characteristics Plantation density Trees/ha Rotation length Years FFB production Tonne FFB/ha.yr Energy Inputs Diesel consumption GJ/ha.yr Effective emission factor Kg CO2/GJ (Diesel) Nitrogen fertilizer production Emissions from ammonium Kg CO2-eq/kg N sulphate production produced Emissions from urea production Kg CO2-eq/kg N produced Nitrogen fertilizer application Ammonium sulphate Kg N/ha.yr Urea Kg N/ha.yr Direct N2O emissions from Kg N2O-N/kg N fertilizer application applied
Table 5: Input data: Mill PARAMETER Energy input Diesel input (electricity production) Processes Oil extraction rate Energy content CPO Palm oil mill effluent (POME) Biogas from POME
Value
Source
125 25 25
Case study Case study Case study / MPOB, 200617
3.2 74.1
Case study IPCC, 2006 (T1.4)
5.6
Wood and Cowie, 2004
1.3
Wood and Cowie, 2004
70 79 0.01
Case study Case study IPCC, 2006
Unit
Value
Source
litre diesel/tonne FFB
1.5
Case study
% MJ/kg
21 36
Case study
m3 biogas / tonne FFB
14
Biogas from POME treatment
m3 biogas/m3 POME
28
Methane content of biogas in open ponds/lagoons Methane content of biogas in closed digestion
%
40
%
65
Electricity production from biogas (65% CH4)
kWh/m3 (65% CH4)
1.8
Basiron and Weng, 2004 Chavalparit, 2006 Shirai et al., 2003 Shirai et al., 2003 Shirai et al.,
guidelines also say that if the drainage is shallower, such as for perennial tree systems, then the emission factor for forest management of organic soils may be assumed, for which the emission factor of 1.36 tonne C per hectare per year is given in IPCC (2006). Drainage depth of oil palm trees is commonly 60 cm (considered medium to shallow drainage) but can range from 30 cm to 2m depending on the local conditions. In this study, the average of the two emissions factors is taken as the base value (10.7 tonne C per hectare per year). 17 The FFB yield at the case study plantations for 2006 was 31 tonne FFB per hectare per year. This value is extremely high compared to the national average yield and it needs to be explained that the visited plantation is currently at maximum production and that higher yielding trees had been planted. The case study yield is, however, not applied in the study but rather an average over the lifetime of the plantation in order to account for the first two years in which the plantation is unproductive and for yield changes over time. The case study yield is applied in the calculations of the GHG emissions for the management improvement case and the effect of varying the yield on the overall emissions is analysed in the sensitivity analysis.
23
A Greenhouse Gas Balance of Electricity Production from Co-firing Palm Oil Products from Malaysia 2003 By-products and their emission credits Kernels Crude palm kernel oil (CPKO) CPKO extraction rate AE PKO 18
GHG emission factor AE PKO 19
GHG emission factor AE Pc GHG emission factor for average surfactant mix 20 (AE Pc, AE PKO, AE CNO) Palm kernel expeller (PKE) PKE extraction rate GHG emission factor of soy bean meal GHG emission factor of PKE21,22 Energy for kernel crushing Electricity from grid Diesel for steam production
Table 6: Input data: Transport PARAMETER Truck (CPO to harbour) Transport distance (one way) Type of transport Percentage energy demand for empty return trip Fuel type Emission factors (truck, diesel)
Tonne kernels / tonne CPO
0.24
Case study
% Tonne AE PKO / tonne CPKO kg CO2 / tonne AE PKO kg CO2 / tonne AE Pc kg CO2 / tonne surfactant mix
45 1.69
Case study Patel, 1999
2690
Patel, 1999
5210 3347
Patel, 1999 Patel, 1999
% kg CO2-eq/ tonne soy bean oil kg CO2-eq/ tonne PKE
53 550
Case study Damen and Faaij, 2006 Own calculations
kWh / tonne kernel input Litres / tonne kernel input
85
Unit km
Value 100 dedicated 65
%
155
19
Tang and Teoh, 1985 Tang and Teoh, 1985
Source Case study Damen and Faaij, 2006
diesel
18
The emission factor of the oleochemical surfactant (here AE3-PKO) is taken from Patel (1999, Ch.5). However, in this study the non-fossil CO2 emission related to fuel (PKS and fibre) and feedstock (kernels) are excluded as they are assumed to be carbon neural (see section 3.2.1). Furthermore, it needs to be noted that the emission factor also includes the emissions from production of FFB on the plantation and from the separation of kernels from other parts of the FFB. This is not further accounted for due to a lack of information regarding the breakdown of energy inputs for the whole chain and an only small share of energy input to the FFB production and kernel separation from the total energy requirement of the surfactant production. Thus, the current calculation represents an underestimation of the emission credit from PKE animal feed production. 19 GHG emission factors of surfactants are based on Patel (1999), who only determines CO2 emissions. The same is adopted here as only limited information is available on CH4 and N2O emissions from surfactant production. 20 In the base calculation it is assumed that one unit of PKO-based surfactant replaces one unit of petrochemical surfactant. However, it may be the case that it replaces one average-mix unit of alcohol ethoxylates. The effects of such a change will be taken into account in the “worst case” of the sensitivity analysis of emissions from CPO production. 21 The emission factor of PKE includes the emissions from the energy input for kernel crushing that is allocated to PKE by market price allocation and the emissions from transporting PKE to the Netherlands where it substitutes soy bean meal. 22 This includes only the GHG emissions from kernel crushing that are allocated to PKE based on market prices and the emissions from transporting PKE to the Netherlands. Energy input for kernel crushing is in form of electricity (90 kWh / ton kernel input) and steam (5 -30 litres diesel / ton kernel input, depending on the extraction method (Tang and Teoh, 1985).
24
A Greenhouse Gas Balance of Electricity Production from Co-firing Palm Oil Products from Malaysia CO2 g CO2-eq/tonne.km CH4 g CO2-eq/tonne.km N2O g CO2-eq/tonne.km Ocean vessel (CPO and PFAD to NL) Transport distance (one way) km Type of transport Fuel type Emission factors (ocean vessel, HFO) CO2 g CO2-eq/tonne.km CH4 g CO2-eq/tonne.km N2O g CO2-eq/tonne.km Inland vessel (CPO and PFAD to power plant) Transport distance (one way) km Type of transport Percentage energy demand for empty return trip Fuel type Emission factors (inland vessel, HFO) CO2 CH4 N2O
Table 7: Input data: Refinery PARAMETER PFAD production Energy input at refinery Energy input – diesel Energy input – biomass Energy input – electricity from national grid Emission factor MY electricity Alternative PFAD use Emission factor - Tallow Energy content - PFAD
90.5 0.107 0.0027
Damen and Faaij, 2003 Damen and Faaij, 2003 Damen and Faaij, 2003
15500 Not dedicated HFO 8.58 0.012 0.00005
Damen and Faaij, 2003 Damen and Faaij, 2003 Damen and Faaij, 2003
200
Essent, 2007, personal communication
dedicated 65
%
Damen and Faaij, 2006
HFO g CO2-eq/tonne.km g CO2-eq/tonne.km g CO2-eq/tonne.km
58.7 0.114 0.00068
Damen and Faaij, 2003 Damen and Faaij, 2003 Damen and Faaij, 2003
Unit Tonne PFAD/tonne RBD palm oil
Value 0.05
Source Case study
GJ/tonne CPO processed GJ/tonne CPO processed kWh/tonne CPO processed
0.197 0.647 23.4
Case study Case study Case study
g CO2-eq/kWh
529
Damen and Faaij, 2006
kg CO2-eq/kg tallow MJ/kg
0.11 38.5
Nemecek et al., 2004 Erbrink, 2004
Table 8: Input data: GHG emissions of fossil electricity reference systems PARAMETER Unit Value Source Essent Claus power plant g CO2-eq / kWh 559 Essent, 2007, personal communication23 Average Dutch electricity production g CO2-eq / kWh 615 Damen and Faaij, 2006 Modern NG power plant g CO2-eq / kWh 400 Alsema and Nieuwlaar, 2000 In: Reijnders and Huijbregts, 2006 Dutch coal power plant g CO2-eq / kWh 1000 Damen and Faaij, 2006 Average European power production g CO2-eq / kWh 486 UBA, 2006
Table 9: Input data: Prices of oil palm products PARAMETER 23
Unit
Electrical efficiency of 38%.
25
Value
Source
A Greenhouse Gas Balance of Electricity Production from Co-firing Palm Oil Products from Malaysia FFB (price at 1% OER) CPO (local delivered) Crude palm kernel oil (local delivered) Palm kernel (ex-mill) RBD palm oil (FOB) RBD palm olein (FOB) RBD palm stearin (FOB) PFAD (FOB) Palm kernel expeller/cake RBDPKO PKFAD PKS EFB
Euro2006 / tonne Euro2006 / tonne Euro2006 / tonne Euro2006 / tonne Euro2006 / tonne Euro2006 / tonne Euro2006 / tonne Euro2006 / tonne Euro2006 / tonne Euro2006 / tonne Euro2006 / tonne Euro2006 / tonne Euro2006 / tonne
3.4 329.3 415.8 194.5 334.4 353.5 326.1 258.3 75.1 547.5 422.9 15.3 6.5
MPOB, 2006 MPOB, 2006 MPOB, 2006 MPOB, 2006 MPOB, 2006 MPOB, 2006 MPOB, 2006 MPOB, 2006 MPOB, 2006 MPOB, 2006 MPOB, 2006 Evald, 2005 Evald, 2005
Table 10: Input Data: Parameters and their ranges for sensitivity analysis Parameter Unit Low Base High Source for range / remarks case Above-ground tonnes dm / ha 280 350 520 IPCC, 2006 biomass - before conversion Soil carbon Tonnes C / ha 20 40 8124 IPCC, 2006 FFB production tonne FFB / 19 25 31 Case study; MPOB, 2006 ha.yr Diesel consumption at GJ/ha.yr 3.2 5.2 Wambeck, 2000 In: Damen and mill Faaij, 2006 Emission factor kg CO2-eq / kg N 0.9 5.6 7.6 Wood and Cowie, 2004 ammonium sulphate produced production Emission factor - urea kg CO2-eq / kg N 0.9 1.3 4 Wood and Cowie, 2004 production produced N2O emission factor kg N2O-N / kg N 0.003 0.01 0.03 IPCC, 2006 applied Oil extraction rate % 19 21 23 MPOB, 2006 (OER) Methane production m3 CH4 / tonne 19.5 33.6 66.2 Chavalparit, 2006; Shirai et al., CPO 2003 Emission credit kg CO2 / tonne 3347 5210 Patel, 1999 surfactant surfactant Emission credit kg CO2 / tonne 275 550 825 +/- 50% variation from base soybean meal soy bean meal case value Damen and Faaij, 2006 Remarks: dm. – dry matter
Table 11: Input Data: Global warming potential of the most important greenhouse gases GHG Unit GWP CO2 kg CO2-eq / kg CO2 1 CH4 kg CO2-eq / kg CH4 23 N2O kg CO2-eq / kg N2O 296
24
Source IPCC, 2006 IPCC, 2006 IPCC, 2006
This value is based on the IPCC reference SOC multiplied with the stock change factors for land use systems (1.0), for input (1.11) and for management (1.22) that relate to oil palm plantations.
26
A Greenhouse Gas Balance of Electricity Production from Co-firing Palm Oil Products from Malaysia
5. Results In the following, first the results for the GHG emissions calculation of CPO production and then of PFAD production are presented. Then the GHG emissions for the whole chain, up to electricity production from CPO and PFAD, are given before finally the GHG emission reductions are portrayed.
5.1.
CPO Production Chain
For the base case, the breakdown of emissions by components is presented in Figure 4 below. It can be seen that the most important source of GHG emissions is land use conversion, even when the CO2 uptake of the oil palm plantation is accounted for, representing 60 percent of all emissions. Plantation 17%
Mill 14% Land use 60%
Transport 9%
Figure 4: Breakdown of GHG emissions by chain component for the production of CPO in the base case
The breakdown of emissions by components for the base case as well as its seven variations mentioned above are shown in Figure 5 and Table 12 below. The figure and the table highlight that, in most cases, the share of emissions from land use are as significant as was found for the base case. It can also be seen that the emissions from land use change are balanced by the carbon uptake from biomass growth on the plantation. For conversion of peatland, there are not only the direct emissions from land use change (carbon stock changes in biomass, soil and DOM) but also the emissions from the oxidation of the organic peat soils, which are by themselves as large as the emissions from the rest of the chain. As a result, the land use case with largest GHG emissions is the case when forested peatland is converted to oil palm plantation. GHG emissions from drained forested peatland amount to 283 g CO2-eq per GJ of CPO delivered. In comparison, Reijnders and Huijbergts (2006) found that emissions from draining peatland can range between 243 and 363 g CO2-eq per GJ CPO delivered (if assuming the same FFB production rate and oil extraction rate), while Hooijer et al. (2006) found 361 g CO2-eq per GJ CPO delivered (also assuming the same FFB production rate and oil extraction rate). These differences may be explained by different emission factors of peat oxidation and assuming different drainage depth.
27
A Greenhouse Gas Balance of Electricity Production from Co-firing Palm Oil Products from Malaysia Table 12: Break down of GHG emissions by chain components for various CPO production cases Land CO2 CO2 Plantation Mill Emission Transport use emissions assimilation credit to NL change from at oil palm PKE + drainage plantation PKO g CO2-eq / MJCPO delivered Land use Base case 102 0 -73 9 21 -14 4 Natural rain 177 0 -73 9 21 -14 4 forest Degraded land 34 0 -73 9 21 -14 4 Peatland forest 177 283 -73 9 21 -14 4 Use of biomass 72 0 -73 9 21 -14 4 No land use 0 0 0 9 21 -14 4 emissions Management Improvement 27 0 -58 7 -2 -14 4 Methodological issues 13 yr allocation 196 0 -73 9 21 -14 4 100 yr allocation 26 0 -73 9 21 -14 4 Market price 102 0 -73 7 17 0 4 allocation Mass allocation 102 0 -73 3 7 0 4 Energy 102 0 -73 3 8 0 4 allocation Sensitivity Best case 72 0 -80 2 12 -14 4 Worst case 229 0 -68 26 41 -5 4
Total
50 125 -19 408 19 20
-36 144 -27 59 45 46
-3 227
Large variations in net GHG emissions (grey bars in Figure 5) are found for different reference land use systems and when not accounting for land use change, indicating how significant land use change is in the overall emissions and how important the choice of what land is planted with oil palm is. Table 12 also lists the net (or total) GHG emissions from one GJ CPO delivered to the power plant. It can be seen that peatland and natural rain forest have extremely high emissions, while CPO production on previously degraded land as well as with the other management improvement options can even take up more CO2 than what is caused during the whole production chain. When the management improvements (as described in section 3.2.6) are put in place, more CO2 is assimilated than CO2 (-equivalent) is emitted during the production chain. Figure 6 shows the breakdown by components for the base case and the improvement case and Table 13 shows how each individual improvement options affects the results. It can be seen that the large emission reduction by using a different land use system (logged over forest vs. degraded land).
28
Land use change CO2 emissions from drainage CO2 assimilation at oil palm plantation Plantation Mill Emission credit PKE Emission credit PKO Transport to NL Total
600 500 400 300 200 100 0
Improvement
No land use emissions
Use of biomass
Peatland
Degraded land
Natural rain forest
-100
Base case
GHG emissions (g CO2-eq/MJCPO delivered)
A Greenhouse Gas Balance of Electricity Production from Co-firing Palm Oil Products from Malaysia
GHG emissions (g CO2-eq/MJCPO delivered)
Figure 5: Breakdown of GHG emissions by source for CPO delivered to power plant
Land use change CO2 assimilation at oil palm plantation Plantation Mill Emission credit PKE Emission credit PKO Transport to NL Total
150
100
50
0
-50
-100
Base case
Improvement
Figure 6: GHG emissions from the mill, the plantation and the land use change of the base case compared to improvements in management
Moreover, Figure 6 shows that emissions from the mill (CH4 from POME treatment) can be avoided and an even negative emission can be achieved because of the replacement of grid electricity by using biogas from POME treatment for electricity production. Furthermore, it can be seen from Table 13 and Figure 6 that 15 percent of the emissions can be avoided increasing the average FFB yields. It should also be noted that, if the FFB yield is improved, less new land will be needed for meeting the rising palm oil demand so that also less land has to be converted. Thus, indirectly, an increased FFB yield can have an even 29
A Greenhouse Gas Balance of Electricity Production from Co-firing Palm Oil Products from Malaysia
larger impact. Finally, it can be seen that the improvement option of applying more organic fertilizer has only a much smaller effect than the other options. Table 13: Break down of emission reductions by improvement options Improvement option Individual emissions reduction (%) 1. Degraded land 139 2. POME 46 3. FFB yields 15 4. POME slurry as organic fertilizer 1 Total (combined effect) 195
160 140 120 100 80 60
Base case (25 yrs, system extension)
40 20 Energy allocation
Mass allocation
Market price allocation
100 yr allocation
13 yr allocation
0 Base case
GHG emissions (g CO2-eq / MJCPO delivered)
Methodological issues A very significant effect on the results was found to be the allocation of land use emissions over time (Table 12). Allocation over 13 years (according to Bauen et al., 2006) causes the emissions per MJCPO to increase three times compared to the base case emissions while, when emissions are allocated over 100 years, an oil palm plantation can assimilate more CO2 than was lost originally during land conversion (Figure 7).
Figure 7: GHG emission of CPO production: Influence of methodological aspects on the results
Another methodological issue is how the emission should be allocated to valuable byproducts. The Cramer Commission methodology suggests applying system extension whenever possible. For the CPO production chain all emissions were accounted for by system extension of by-products but the GHG emissions of the CPO chain were also calculated with market prices, mass and energy allocation (Table 12 and right hand side of Figure 7). Applying allocation by market price shows that emissions of CPO are higher than if system extension is applied. This may be explained by the fact that CPO has much higher prices than its by-products. Allocation on the basis of weight or energy results in similar
30
A Greenhouse Gas Balance of Electricity Production from Co-firing Palm Oil Products from Malaysia
emissions, which are slightly lower than when system extension is applied. Overall, methodological issues of allocation have a rather small influence on the results.
GHG emissions (g CO2-eq / MJCPO delivered)
Sensitivity As explained above, for certain parameters of land use conversion and palm oil production large ranges were found. The extreme ends of each range were used to calculate the GHG emissions of CPO production in the best case and in the worst case. Figure 8 shows the results.
300
200
Land use change CO2 assimilation ( plantation) Plantation Mill Emission credit PKE Emission credit PKO Transport to NL Total
100
0
-100
Base case
Best case
Worst case
Figure 8: Sensitivity of base case GHG emissions: analysing data ranges found for the base case in a best case and worst case
It can be seen in Figure 8 that in the best case, land use conversion emissions are lowers while the CO2 assimilation at the oil palm plantation are higher – resulting in a lower net emissions than in the base case. Moreover, emissions at the plantation decreased largely due the very large range of GHG emissions from fertilizer production and application. The worst case shows, however, that also the higher end of the GHG emission range for fertilizer production and application can cause very high emissions at the plantations. Also significant is the land use change emission, which is almost twice as large as in the base case even though in both cases logged-over forest is assumed as land type. While the CO2 assimilation is now also smaller, an overall increase of GHG emissions by 100 percent is found. The sensitivity of individual parameters (see Table 10 for an overview of the parameters and the corresponding ranges) shows that the GHG emissions is affected most by the aboveground biomass and the soil carbon content before the land use conversion, followed by methane production from POME treatment and FFB production (Figure 9). Relatively small changes in FFB production yields can cause the GHG emissions to increase or decrease significantly.
31
A Greenhouse Gas Balance of Electricity Production from Co-firing Palm Oil Products from Malaysia Above-ground biomass - before conversion
85 GHG emissions (g CO 2-eq / MJ)
FFB yield
75
Diesel consumption at mill
65
Emission factor - ammonium sulphate production
55
Emission factor - urea production
45
N2O emission factor OER
35
Methane production
25
Emission credit - surfactant
15 0
100
200
300
Emission credit - soybean meal soil carbon
Parameter variation (% )
Figure 9: Sensitivity of base case GHG emissions: spider diagram
Also the emission credit that is given to PKO has a large effect on the overall emissions: If the PKO-based surfactants do not replace fossil-based surfactant, as assumed in the base case, but rather an average mix of surfactants, than the overall emissions would increase by nearly 20%. The factors that are most uncertain are the emission factors for fertilizer production, i.e. ammonium sulphate and urea production, and the N2O emission factor from nitrogen fertilizer application. Despite the uncertainty, ammonium sulphate and urea production affects the overall emissions only slightly. On the contrary, the N2O emission factor can cause the overall GHG emissions to increase or decrease by more than 10%. Factors that have little impact on the overall emissions are diesel consumption at the mill, oil extraction rate (OER), and the emission credits for soybean meal.
5.2.
PFAD Production Chain
Table 14 and Figure 10 present the results of the PFAD GHG emissions and shows that the total emissions of PFAD are only a fourth of the CPO base case. It is important to note that the alternative use of PFAD and the emissions produced from applying a substitute for PFAD (here tallow) makes up more than 30 percent of the total emissions, indicating how significant this component is in the overall GHG balance of PFAD. Comparison of market price and energy allocation does not have a large impact on the overall GHG emissions because of their relative small difference compared to the overall emissions of the bio-electricity chain (Table 14 and Figure 10). However, based on energy allocation, the GHG emissions are 8 percent higher than when calculated with market price allocation.
32
A Greenhouse Gas Balance of Electricity Production from Co-firing Palm Oil Products from Malaysia
PFAD no refinery 2.5 3.8 6.3
Refinery Alternative PFAD use Transport
10
8
6
4
2
No refinery
Mass allocation
Energy allocation
0
PFAD base case
GHG emissions (g CO2-eq / MJ PFAD delivered)
Table 14: GHG emissions of three PFAD production chains Component PFAD base case PFAD energy PFAD mass (market price allocation allocation allocation) g CO2eq/ GJPFAD delivered Energy inputs to 1.6 2.2 2.2 refinery Alternative use of 2.5 2.5 2.5 PFAD Transport 3.8 3.8 3.8 Total 7.8 8.4 8.4
Figure 10: GHG emissions of the PFAD production chain, by component
5.3.
Overview of Bio-Electricity Chains
Using CPO and PFAD for electricity generation results in GHG emissions per kWh as presented in Table 15 and Figure 11 below. It is shown that electricity from CPO on forested peatland causes the highest emissions, followed by natural rain forest. Some CPO cases (degraded land, 100 year allocation and the best case) can even become a carbon sink, having negative GHG emissions. Table 15: Overall emissions of CPO production chains GHG emissions g CO2eq / kWh Land use Base case (logged over forest) 473 Natural rain forest 1184 Degraded -176
33
A Greenhouse Gas Balance of Electricity Production from Co-firing Palm Oil Products from Malaysia Peatland Use of biomass No land use emissions Management Improvements for base case Methodological issues 13 yr allocation 100 yr allocation Market price allocation Mass allocation Energy allocation Sensitivity Best case Worst case PFAD PFAD base case Energy allocation Mass allocation No refinery
3876 183 192 -340 1369 -254 557 424 433 -32 2159 77 83 83 60
5000
GHG emissions (g CO2-eq / kWh)
4000
3000 CPO 2000
Fossil electricity
PFAD
1000
Base case Natural rain forest Degraded land Peatland forest Use of biomass No land use emissions Improvement 13 yr allocation 100 yr allocation Market price allocation Mass allocation Energy allocation Best case Worst case PFAD base case PFAD energy allocation PFAD mass allocation Claus power plant Average Dutch Modern natural gas Coal Average EU
0
CPO chains
Fossil
CPO PFAD CPO methodological sensitivity aspects
Figure 11: Overview of GHG emissions of CPO and PFAD chains per kWh electricity produced from biomass through co-firing in a natural gas power plant and comparison to the fossil reference chains
Figure 11 also indicates how the GHG emissions from the bio-electricity chains relate to the emissions from the fossil reference systems. It can be seen that some CPO cases emitted less than the fossil reference systems, while other CPO cases emit more. Also important to note is the extremely large difference in emissions from PFAD and CPO. The resulting GHG emission reductions are presented in the following section. 34
A Greenhouse Gas Balance of Electricity Production from Co-firing Palm Oil Products from Malaysia
5.4.
GHG Emission Reductions
Based on the GHG emissions of the bio-electricity chains, the GHG emission reductions compared to different fossil reference systems are calculated as shown in Table 16. It can be seen that depending on the bio-electricity chain and the reference system GHG emission reductions of 50% and even 70% can be achieved while in other cases the GHG emissions of bio-electricity become larger than the fossil reference system. For example, palm oil electricity from degraded land and from CPO production with the management improvement options discussed above always result in emission reductions of more than 70% independent of what fossil reference system it is compared to. The base case can meet the 50% emission reduction target only if it is compared to coal electricity. Table 16: GHG emission reductions and percentage reduction from fossil reference system REFERENCE SYSTEMS Claus NG Average Dutch Modern NG Coal power Average EU power plant electricity power plant plant electricity production production g CO2% g CO2% g CO2% g CO2% g CO2% BIOENERGY eq / eq / eq / eq / eq / SYSTEMS kWh
Land use Base case (logged 74 over forest) Natural rain forest -636 Degraded land 724 Peatland forest -3329 Use of biomass 365 No land use 356 Management Improvement 888 Methodological issues – CPO 13 yr allocation -821 100 yr allocation 802 Market price -9 Mass 124 Energy 115 Sensitivity – CPO Best case 580 Worst case -1579 PFAD PFAD base case 471 PFAD energy 465 PFAD mass 465 PFAD no refinery 488
kWh
kWh
kWh
kWh
14
141
23
-74
-18
526
53
12
3
-116 132 -607 67 65
-569 791 -3261 432 423
-93 129 -530 70 69
-784 576 -3476 217 208
-196 144 -869 54 52
-184 1176 -2876 817 808
-18 118 -288 82 81
-698 662 -3390 303 294
-144 136 -698 62 60
162
955
155
740
185
1340
134
826
170
-150 146 -2 23 21
-754 869 58 191 182
-123 141 9 31 30
-969 654 -157 -24 -33
-242 163 -39 -6 -8
-369 1254 443 576 567
-37 125 44 58 57
-883 740 -71 62 53
-182 152 -15 13 11
106 -288
647 -1512
105 -246
432 -1727
108 -432
1032 -1127
103 -113
518 -1641
107 -338
86 85 85 89
538 532 532 555
88 87 87 90
323 317 317 340
81 79 79 85
923 917 917 940
93 92 92 94
409 403 403 426
84 83 83 88
.
Remarks: GHG emission reductions are highlighted:
50 %
70 %
GHG Emission Reductions from CPO-Based Electricity The GHG emission reductions from CPO electricity are positive for the CPO chains degraded land (meets 70% emission reduction target compared to all reference systems), use of biomass (meets the 50% emission reduction target compared to all reference systems, in 35
A Greenhouse Gas Balance of Electricity Production from Co-firing Palm Oil Products from Malaysia
the case of average Dutch and coal electricity production, even a 70% emission reduction can be achieved), no land use (meets the 50% emission reduction target compared to all reference systems, in the case of electricity production from coal, even a 70% emission reduction can be achieved) and management improvement (meets 70% emission reduction target compared to all reference systems); see Figure 12. Based on extremely high GHG emissions when CPO is produced on previously natural rain forest or peatland, the GHG emission reductions are negative in all cases, so that the use of CPO from those chains results in more emissions than the fossil reference systems.
GHG emission reduction (%)
200
100
70% 50% 0
NG Claus Average Dutch Modern NG Coal Average EU 70% 50%
-100
-200
Improvement
No land use
Use of biomass
Peatland forest
Degraded
Natural rain forest
Base case
-300
Figure 12: GHG emission reductions of various CPO electricity production chains compared to different fossil reference systems
Methodological issues The effect of the allocation methodology for land use change emissions has a large impact on whether GHG emission reduction targets may be achieved (Figure 13). When land use change emissions are allocated over a short period of 13 years, the GHG emission reductions are always negative. If the allocation takes place over a period of 100 years, then the 70% emission reduction target is always reached. Figure 13 also shows the effects of different allocation methods for emissions from byproducts on the GHG emission reduction. While allocation by weight and by energy hardly affects the results, allocation by market price shows smaller emission reductions than the base case in which system extension is applied (based on the larger emissions found for allocation by market price.
36
A Greenhouse Gas Balance of Electricity Production from Co-firing Palm Oil Products from Malaysia
GHG emission reductions (%)
200
100 70% 50% 0
NG Claus Average Dutch Modern NG Coal Average EU Plot 1 70% Plot 1 50%
-100
-200
Energy allocation
Mass allocation
Market price
100 yr allocation
13 yr allocation
Base case
-300
Figure 13: GHG emission reductions: methodological aspects
Sensitivity Based on the GHG emissions from CPO production in the best and the worst case, Figure 14 shows the emission reductions by the two cases compared to the base case. As already seen in the results for the GHG emissions from the two cases, the best and the worst case differ largely from the base case. In the best case, 70% GHG emission reduction is always reached while in the worst case, more greenhouse gases are emitted than in the fossil reference systems.
GHG emission reduction (%)
100
70% 50%
0
-100
-200
-300
NG Claus Average Dutch Modern NG Coal Average EU 70% 50%
-400 Base case
best case
worst case
Figure 14: Sensitivity of GHG emission reductions from CPO based electricity production
37
A Greenhouse Gas Balance of Electricity Production from Co-firing Palm Oil Products from Malaysia
PFAD As the PFAD base case and its two sub-cases (energy allocation and mass allocation) have resulted in very similar emissions, the GHG emission reductions are presented only for the base case (Figure 15). Compared to all five reference systems, more than 80 percent of the emissions can be avoided when producing electricity from PFAD showing the large potential for reducing GHG emissions. The differences in GHG emission reductions between different fossil reference systems are small (81 percent to 92 percent GHG emission reductions).
GHG emission reduction (%)
100
80 70% 60 50% NG Claus Average Dutch Modern NG Coal Average EU 70% 50%
40
20
0 PFAD
Figure 15: GHG emission reduction of PFAD electricity compared to various fossil reference systems
5.5.
Other Environmental Criteria of the Cramer Commission
The following description of the other environmental aspects is specifically for the plantations visited during the field visit and may not represent the general situation in the Malaysian palm oil industry.
Waste Management Household and office waste is placed in the landfill on the plantation. The location of the landfill was chosen in an old quarry, far away from water catchment area. Plantation managers have organized educating the workers about recycling but no recycling system is in place yet. As previously discussed, when the palm oil mill effluent is treated large CH4 emissions occur. Moreover, after treatment the waste water is discharged into a nearby river despite that it is still rich in nutrients and can cause the available oxygen levels in the water to decrease. A new Malaysian regulation prohibits all mills from discharging the treated POME into water bodies. When visiting the plantation preparations had taken place of how to deal with the slurry instead: the slurry will be used for irrigating the plantation, returning valuable nutrients to the plantation. The POME solids that settle in the treatment ponds are packed in bags every two years (when the ponds are dried out and cleared) and returned to the plantation or to the nursery. The visited plantation had received a permission from the Malaysian Department of Environment to do so.
38
A Greenhouse Gas Balance of Electricity Production from Co-firing Palm Oil Products from Malaysia
Other by-products from the mill are recycled as organic fertilizer (EFB), used for steam and electricity production (fibre and PKS) or as a road cover (PKS) to avoid dust in areas where people work.
Use of Agro-Chemicals Inorganic fertilizer consumption is minimized by applying cut fronds, EFB and trees before replanting as organic fertilizer. In order to avoid fertilizer runoff at steep slopes, holes are drilled and fertilizer is added and covered with dirt. Table 17: Fertilizer and pesticide application at visited plantations (2006) Plantation/ Kieserite Ammonium Urea Potash Borate Rock phosphate Estate (28% sulphate (46% (60% (48% (approx. 30% MgO) (21% N) N) K2O) B2O3) P2O5) Tonnes/ha.yr Plantation 1 0.05 0.332 0.15 0.49 0.006 0.23 Plantation 2 0.104 0.399 0.227 0.643 0.024 0.43 Estate I Plantation 2 0.048 0.271 0.139 0.428 0.22 Estate II
Glyphosate Litre/ha.yr 2.8 3.46 1
At the plantations, the pesticides glyphosphate and glufosanate ammonium are applied; application rates per year can be found in Table 17 below. The visited plantations have an integrated pest management system by which pesticide application is reduced to a minimum. Two main components of the integrated pest management system are the planting of beneficial plants (such as Tunera spp. or Cassia cobanensis) and the biological control of the rhinoceros beetles (Orytes rhinoceros) by the Metharhizium fungus, collection of larvae, and attracting the adult beetles with pheromone. Only if the beetle population still breaks out, will insecticides be applied. The applied inorganic fertilizers are kieserite (MgO), ammonium sulphate (N), urea (N), potash (K2O), borate (B2O3) and rock phosphate (P2O5); application rates are presented in Table 17.
Prevention of Erosion and Soil Exhaustion During establishment of a plantation or at replanting, legume crops are planted immediately in order to avoid soil erosion. The plantations had conducted experiments with different legume cover crops in order to determine which ones are better for preventing soil erosion and also help nitrogen fixation. Mucuna bracteata has roots that penetrate deeply into the soils, increases litter and dead organic matter content on the ground, and improves nutrient content of the top soil. Moreover, Vetiver grass is planted at road sites because of is strong horizontal roots that can help preventing soil erosion or landslides. In steeper areas, silt traps are dug at roadside in order to catch runoff topsoil. At steep slopes (larger than 12 percent or 25 degrees), terracing is applied. An additional measure is taken to avoid water or soil runoff: digging holes at the back side of the terrace. Trenches are dug on terraces to improve collection of runoff water and nutrients.
39
A Greenhouse Gas Balance of Electricity Production from Co-firing Palm Oil Products from Malaysia
Soil exhaustion is attempted to be reduced by covering the soil with the fronds cut during harvest and returning EFB to the plantation. The covering of the ground also helps reducing evaporation.
Active Improvement of Quality and Quantity of Surface and Ground Water The water catchment area, from which the drinking water for plantation worker homes, the offices and the mill is drawn, is surrounded by natural forest; planting of oil palm is not allowed there according to company policy. The catchment area is fenced off; fishing or hunting as well as trespassing are prohibited. The catchment water is analysed quarterly for its drinking quality.
Emissions to Air Besides the GHG emissions from plantation and mill already discussed previously, emissions to the air are caused by diesel and biomass combustion for steam and electricity production at the mill. Besides the greenhouse gases already mentioned, other typical emissions are nitrogen oxides (NOx), carbon monoxide (CO), particulate matter (PM) and sulphur dioxide (SO2).
40
A Greenhouse Gas Balance of Electricity Production from Co-firing Palm Oil Products from Malaysia
6. Discussion In the following, the methodological choices and assumptions and their effects on the GHG emission reductions are discussed. First, this will be done with respect to the general Cramer Commission methodology for GHG emission calculations. Then, those choices and assumptions related to the specific method applied in this study will be examined. Finally, the results of this study are discussed.
6.1.
Cramer Commission Methodology
Within the Cramer Commission methodology there are two main aspects that require further attention: the allocation of land use change emissions over time and the distribution of emissions to by-products. The effects of different methodological choices with respect to these two issues were investigated in this study. The decision of the time period for which land use change emissions are accounted for was shown to be especially significant. Regarding the base case, applying a time period of 13, 25 or 100 years can result in very negative emission reductions (for 13 years), in small but positive emission reductions (for 25 years) and in very high, positive emission reductions (for 100 years). With respect to the allocation of emissions to by-products, the results have shown much less variation. While in the base case system extension was applied, three other cases with allocation by market price, weight and energy are also assessed. For allocation by weight and energy, the GHG emission reductions are only marginally larger than in system extension. Only when allocation by market price was applied could significant differences be seen compared to system extension. Also for PFAD different allocation methods (by market price, weight and energy) were investigated but because GHG emissions of PFAD-based electricity are very small compared to those of the fossil electricity reference systems, the effect of different allocation methods is also very small. For this specific case, the chosen allocation methods did not affect the results significantly.
6.2.
Specific Approach Taken In This Study
The most important methodological issue of the specific approach applied in this study is the calculation of land use change emissions. This aspect was based on Tier 1 of the IPCC guidelines for national GHG inventories. One of the assumptions of Tier 1 is that land use conversion does not cause a carbon stock change in belowground carbon. In order to verify this assumption, the belowground carbon of tropical rain forest is compared to that of grassland and oil palm plantation. The belowground carbon for both tropical rainforest and grassland was determined on the basis of the ratio of belowground biomass to aboveground biomass (from IPCC, 2006) and the carbon fraction of the given biomass (from IPCC, 2006). The belowground carbon at an oil palm plantation is based on the field experiments of Syahrinudin (2005). Belowground carbon was found to be 63.5, 4.9 and 19.2 tonnes C per hectare for tropical rainforest, grassland and oil palm plantation, respectively. This shows that the assumption that land use conversion does not cause a carbon stock change in 41
A Greenhouse Gas Balance of Electricity Production from Co-firing Palm Oil Products from Malaysia
belowground carbon is not valid. However, for the purpose of this analysis, it is not a major problem as the already negative GHG balance for converting tropical rainforest to oil palm is only exacerbated further so that it confirms that converting natural rain forest to oil palm plantations has strong negative GHG emission effects. Similarly, converting grassland to oil palm causes a carbon uptake and improves the already positive GHG balance of CPO produced on grassland. This reinforces the result that CPO production on degraded land can act as a carbon sink. Another aspect that needs further discussion is the emission credit given to by-products. This emission credit is based on the assumption of which product is replaced (i.e. PKE replaces soybean meal) and on the GHG emissions from the alternative product (i.e. GHG emission of soybean meal production). Both of these assumptions can have large impacts on the emission credit and thereby on the overall emissions of the biomass production in question. The sensitivity analysis attempted to find out how sensitive the results are to these assumptions. For the PKE emission credit it was found that when it replaces soybean meal and even if the GHG emission factor of soybean meal is varied by plus/minus 50%, the GHG emissions from CPO production increases or decreases by less than 2 percent. However, when investigating the sensitivity to the PKO emission credit, it can be seen that the results are very sensitive to changes in the GHG emissions from the product that is displaced. Thus, depending on the by-product, the choices and assumptions in calculating emission credits can have large impacts on the overall emissions.
6.3.
Results
Land use change resulted in the largest factor of GHG emissions, not only emitting the most carbon throughout the whole chain but also absorbing a significant amount of carbon at the oil palm plantation. In this study, it was chosen to take the land conversion from logged-over forest to oil palm plantation as the base case because that was found to be a the most common situation in Northeast Borneo. This case cannot reduce GHG emissions by 50 percent unless it is compared to coal power production or the chain is improved. If oil palm is planted on degraded land, then GHG emission reductions of over 100 percent can be achieved. However, this option has not been very popular in the past because of the additional establishment costs and possibly lower production yields. The CPO production on peatland has resulted in much larger GHG emissions than for any other land type. In this study, an average CO2 emission factor from peatland drainage was calculated from the IPCC default value for shallow and deep drainage. While comparable studies have resulted in slightly higher to much higher emissions from peatland drainage (see section 5.1), it should be noted here that even if the emissions from draining peatland are as low as calculated for this study, the GHG balance of CPO production on drained peatland would still be significantly higher than on any other land type and that it cannot fulfil the Cramer Commission criteria. Another possible land use system that has frequently been converted to oil palm plantations in Malaysia is rubber or coconut plantations. The GHG emissions from these land use systems would also have to account for the alternative rubber/coconut production elsewhere, making this a much more complex situation that is beyond the scope of this study. However, analyzing the life-cycle GHG emissions from palm oil bio-diesel (PME), Helms et al. (2006) have shown that if another plantation was converted to oil palm and the production of that previous plantation product takes place elsewhere or is replaced by another product, much 42
A Greenhouse Gas Balance of Electricity Production from Co-firing Palm Oil Products from Malaysia
larger GHG emissions result compared to palm oil produced on previously natural rain forest. As palm oil production on tropical rain forest land is not able to meet the Cramer Commission criteria, production of CPO for electricity purposes also on this land use system (previous rubber or coconut plantation) is unlikely to meet the Cramer Commission criteria for bio-electricity production. While the base case cannot yet meet the Cramer Commission emission reduction targets for bio-electricity production, with the suggested management improvement options the targets can rise well above the given targets. From the four suggested improvement options, the increased yield option and application of more organic fertilizer are already becoming more common in Malaysia because of increased profits (for yield option) and new laws (for applying POME slurry as organic fertilizer). However, as mentioned above, the option of planting oil palm on degraded land is not very common due to the higher establishment costs and possibly reduced yields. In order to make this also a feasible and economic option for plantation owners, incentives are needed. The fourth option of improvement relates to the collection of methane from the POME treatment. Also this option is not commonly found in the Malaysian palm oil industry despite its high cost-effectiveness. Moreover, this option has already been discussed many times in the last two decades and no changes have taken place. Therefore, it is important to work out why this option has not penetrated the palm oil industry and then how to make it happen. Additionally, there are also other improvement options not yet investigated in this study. For example, the efficiency of boilers at the mill can be increased so that less fossil and biomass fuels are required. This would also lead to higher emission credits as more biomass could be used elsewhere. PFAD-based electricity was found to have very small emissions, both compared to fossil reference systems and to CPO-based electricity production. The most important reason for why PFAD has such small emissions and so large GHG emission reduction potentials is that PFAD is treated as by-product so that, according to the Cramer Commission methodology, only those emissions need to be accounted for that are generated in direct connection with PFAD processing and use. Also, if PFAD is treated as a residue (with no other uses), the emissions from the refinery can also be neglected in the PFAD chain and as a result the GHG emissions would be even lower (about one fourth lower than the PFAD base case). While, based on the mass balance of a refinery (where PFAD is a by-product produced at a rate of less than 5 percent by weight), the choice to treat PFAD as a by-product (or as a residue) may be debatable because PFAD is a valuable product for the oleochemical and animal feed production industries. Moreover, one might not want to consider PFAD sustainable just because the GHG balance is positive, especially when it comes from unsustainably produced CPO. It needs to be discussed again when a product is considered only a by-product and how to account for the possibly un-sustainability of the CPO that is used for PFAD production. The comparison of the GHG emissions from both bio-electricity chains to various fossil reference systems has shown only a small effect on the GHG emission reductions. For most cases, it did not make a difference in whether the Cramer Commission criteria are met or not. However, in the cases that were already only marginally above or below the criteria, the fossil reference system could affect whether the criteria are reached or not (as for example in 43
A Greenhouse Gas Balance of Electricity Production from Co-firing Palm Oil Products from Malaysia
the base case without improvements: only compared to coal electricity can a 50 percent emission reduction be achieved. Compared to any of the other fossil reference system the base case can not reach the 50 percent emission reduction mark).
44
A Greenhouse Gas Balance of Electricity Production from Co-firing Palm Oil Products from Malaysia
7. Conclusion and Recommendations To sum up, this study first presented a detailed methodology for calculating the GHG balance of a specific bio-electricity production chain. This methodology was based on the Cramer Commission methodology regarding criteria for sustainable biomass production and was further developed for this specific case. Based on the developed methodology, this studied assessed the sustainability of electricity production from Malaysian CPO and PFAD imported to the Netherlands. The study found that the land use conversion for oil palm plantation makes up a very large share of the overall emissions and, due to this significance, may not be neglected in the overall GHG emission calculations for palm oil-based electricity or, in fact, for any other biomass-based electricity. Investigating the overall emissions for different land types, it can be concluded that CPO production on peatland and natural rain forest are not options for producing sustainable electricity as their emission reduction potential is negative compared to fossil reference systems. Moreover, it was found that CPO production on logged-over forest also does not meet the Cramer Commission criterion of 70 percent emission reduction compared to various fossil reference systems and that the 50 percent emission reduction target can only be reach when compared to electricity production from coal. However, when CPO is produced on degraded land, GHG emission reductions of well over 100 percent may be reached, indicating that oil palm plantations may serve as carbon sinks. With respect to land use change, publicly available information with which the past and current land use change can be better defined and quantified are very limited. Therefore, it is suggested for future studies to further investigate the issue of land use change as result of oil palm expansion. Here it will be important to determine other land use systems that are typical for Southeast Asia and quantify how much land of each system is converted to oil palm plantation. Moreover, the collection of more locally specific values of land use change parameters (e.g. above- and below-ground carbon, DOM and soil carbon) will be valuable for making the GHG emissions from land use change more precise. This study also investigated potential improvement options in the management of the oil palm plantation and the mill and their effect on the GHG emission reductions. This investigation resulted in three options that can have large impacts on the emissions, with the largest effect being caused by planting oil palm on degraded land. Also, a fourth option (applying more organic fertilizer) was examined but it showed only very little effect on the GHG balance. Together the four options cause the overall emissions of the CPO-based electricity chain to become negative so that it can actually serve as a carbon sink. The negative GHG emissions trigger the GHG emission reductions of bio-electricity production to increase to over 100 percent compared to the fossil reference systems. Other improvement options are possible and their effect on the overall GHG balance need to be investigated in future studies. The sensitivity analysis of the GHG emissions from CPO production illustrated how the emissions can vary when different values for CPO production parameters are assumed. This points out that the actual level of emissions depends largely on the local settings, the specific management of the plantation and the particular production methods.
45
A Greenhouse Gas Balance of Electricity Production from Co-firing Palm Oil Products from Malaysia
The second source of bio-electricity that was investigated in this study is palm fatty acid distillate, a by-product of CPO refining. It was found that PFAD has a very positive GHG balance and compared to the fossil reference systems it can reduce GHG emissions by over 70 percent, meeting the Cramer Commission criteria in all cases. However, as discussed above, there are also problematic aspects in treating PFAD only as a by-product and it is recommended to further investigate how to deal with this issue in order to fully account for the sustainability of PFAD-based electricity. The comparison of CPO and PFAD electricity chains to various fossil reference systems results in small effects on the GHG emission reduction but the fossil reference system does not generally affect whether the emission reduction criteria is met or not. Only in those cases that have already borderline emissions can it make a difference. The study has established further that methodological choices can have large impacts on the results and on whether the GHG emission reduction targets of the Cramer Commission, i.e. at least 50 to 70 percent emission reduction in 2007, may or may not be reached. Especially significant is the decision of the time period for which land use change emissions are accounted for. Thus, it is recommended that the Cramer Commission decides on one time period for each energy crop so that the land conversion emissions can be allocated in the same way for each specific crop. Regarding palm oil, it is recommended to take this time period as 25 years as this is the general length of one plantation rotation. With respect to the allocation of emissions to by-products, the results have shown much less variation, even though a difference in results could be found between system extension and market price allocation. Additionally, it was shown that the aspect of how to deal with the emissions credits for byproducts in system extension can have significant effects on the results. Consequently, for the default methodology of the GHG calculations, it is recommended to define for each biomass type the different by-products, the products they replace and their emission factor. Based on the results of the calculation a simple decision tree for determining whether the Cramer Commission criteria on GHG emissions can be reached was made (Figure 16). It must be noted that this decision tree is simple and crude, and that actual compliance with GHG emission criteria depends strongly on the local conditions. Moreover, it should be observed that the decision tree does not account for the effects of different allocation methods. The other environmental criteria of the Cramer Commission and the compliance with these criteria in the case study were described on a qualitative level only. In order to find out whether the oil palm industry or a specific plantation complies with the Cramer Commission criteria (compliance with national and local laws), future studies need to investigate the existing Malaysian (and the Bornean) laws that refer to these environmental impacts and the palm oil industry’s compliance with these laws.
46
A Greenhouse Gas Balance of Electricity Production from Co-firing Palm Oil Products from Malaysia What biomass is used?
70 % GHG emission reductions can be reached*
PFAD
CPO
What is the previous land use type? Logged over forest
Tropical rain forest Or Peatland
Are management improvement options** applied?
Degraded land No
What fossil reference is it compared to? Coal
Yes
70 % GHG emission reductions can be reached
Claus power plant, Modern natural gas Dutch average EU average
70 % GHG emission reductions may be reached
50% GHG emission reductions may be reached
50% GHG emission reductions cannot be reached
Figure 16: A simple decision tree - When can electricity production from palm oil products meet the Cramer Commission criteria? * Assuming that PFAD is treated as a by-product ** The improvement options refer to 1) establishing a new plantation on degraded land, 2) increasing FFB yields, 3) POME is treated in a closed anaerobic digester and CH4 is collected and burned for electricity production and 4) slurry from POME treatment is applied to the plantation as organic fertilizer.
This study demonstrates that it is possible to calculate the GHG emissions of a specific bioelectricity chain with an extended version of the Cramer Commission methodology for GHG emissions. While GHG emissions can vary strongly for different land use changes and methodological approaches, many of the chains studied were found not to be sustainable according to the Cramer Commission GHG emission criteria. However, if CPO production takes place on previously degraded land, the management of the production of CPO is improved, or if the by-product PFAD is used for electricity production, the criteria can be achieved, and palm oil-based electricity can be considered sustainable from a GHG emission point of view. If bioelectricity is to be produced from palm oil and its derivatives, then the sustainable options should be focussed on.
8. Acknowledgements The authors would like to thank all persons who made contributions to this work. Among those, we would like to thank especially Ariane Kaper (Utrecht University) for her help on the land use issue, David Ogg and Johan Maris (both Control Union) for organizing the field visit and the managers from the visited plantations, mills and refinery for their enthusiasm about our work, their patience in providing data and their hospitality.
47
A Greenhouse Gas Balance of Electricity Production from Co-firing Palm Oil Products from Malaysia
9. References Basiron, Y. and C. K. Weng (2004). "The oil palm and its sustainability." Journal of Oil Palm Research 16(1): 1-10. Bauen, A., P. Watson and J. Howes (2006). Methodology for carbon reporting under the renewable transport fuel obligation - Draft. London, UK, E4tech. Bergsma, G., J. Vroonhof and V. Dornburg (2006). The greenhouse gas calculation methodology for biomass-based electricity, heat and fuels - The view of the Cramer Commission. CE Delft. Retrieved 25.05.2007, from http://www.senternovem.nl/mmfiles/The_greenhouse_gas_calculation_methodology_ for_biomass-based_electricity_heat_and_fuels_tcm24-221151.pdf. Blok, K. (2004). Energy analysis - Oktober 2004, Universiteit Utrecht. Bradley, D. (2006). European Market Study for BioOil (Pyrolysis Oil). Climate Change Solutions. Retrieved 15.03.2007, from http://www.bioenergytrade.org/downloads/bradleyeuropeanbiooilmarketstudyfinaldec 15.pdf. Chavalparit, O. (2006). Clean technology for the crude palm oil industry in Thailand. Wageningen, the Netherlands, Wageningen UniversityPhD Dissertation. CIA (2006). CIA World Factbook Malaysia. US Government - Central Intelligence Agency. Retrieved 17.04.2007, from https://www.cia.gov/cia/publications/factbook/geos/my.html. Cramer Commission (2007). Criteria for sustainable biomass production - Final report of the project group ' Sustainable production of biomass' . Retrieved 22/02/2007, from http://www.senternovem.nl/mmfiles/Criteria_voor_duurzame_biomassa_productie_Ei ndrapport_van_de_projectgroep_Duurzame_productie_van_biomassa_tcm24195420.pdf. Damen, K. and A. Faaij (2003). A life cycle inventory of exisiting biomass import chains for "green" electricity production. Utrecht, the Netherlands, NW&S-E-2003-01. Department of Science, Technology and Society, Copernicus Institute for Sustainable Development, Utrecht University. Damen, K. and A. Faaij (2006). "A Greenhouse Gas Balance of two Existing International Biomass Import Chains." Mitigation and Adaptation Strategies for Global Change Volume 11(5): 1023-1050. Dehue, B. (2006). Palm oil and its by-products as a renewable energy source: Potential, sustainability and governance. Environmental Policy Group, Social Science Group. Wageningen, the Netherlands, Wageningen UniversityMSc. Thesis. E4Tech (2007). Joint NL/UK workshop on the methdology of GHG calculations, 15.02.2007, Utrecht, the Netherlands. Erbrink, J. J. (2004). Marktoverzicht bio-olien voor energie toepassing. Kema. Retrieved 09.03.2007, from http://www.tuinbouw.nl/website/ptcontent.nsf/vwAllOnID/E51A66727A11B34EC12 56EBC004B0F51/$File/04-7051.marktrap.PT-LNV.pdf. Essent (2007). Personal and written communication on power production at Claus power plant, Maasbracht, the Netherlands. Paul Romijn, Geert Ardon and Peter Paul Schouwerberg - January to March 2007. Evald, A. (2005). Renewable energy resources. Retrieved 28/03/07, from http://www.eib.org.my/upload/files/Renewable%20Energy%20Resources.pdf.
48
A Greenhouse Gas Balance of Electricity Production from Co-firing Palm Oil Products from Malaysia
FAO (2006). Global forest resources assessment 2005: Progress towards sustainable forest management. FAO Foresty Paper 147. Retrieved 08.03.2007, from ftp://ftp.fao.org/docrep/fao/008/A0400E/A0400E00.pdf. Helms, H., G. A. Reinhardt and N. Rettenmaier (2006). "Bioenergie aus Palmoel: Oekologische Chancen und Risiken." Energiewirtschaftliche Tagesfragen 56(11). Hooijer, A., M. Silvius, H. Woesten and S. Page (2006). Peat-CO2: Assessment of CO2 emissions from drained peatlands in SE Asia, Delft Hydraulics report Q3943. IPCC (2006). 2006 IPCC Guidelines for National Greenhouse Gas Inventories, Institute for Global Environmental Strategies, Hayama, Japan. Junginger, M., M. de Wit and A. P. C. Faaij (2006). IEA Bioenergy task 40 - Country report for the Netherlands - Update 2006. NW&S-E-2006-130. Utrecht, the Netherlands, Department of Science, Technology and Society, Utrecht Universiteit. Lasco, R. D. (2002). "Forest carbon budgets in Southeast Asia following harvesting and land cover change." Science in China (Series C) 45 Supp.(55-64). MPOB (2006). Economics and industry development division - statistics. Malaysian Palm Oil Board. Retrieved 22.03.2007, from http://econ.mpob.gov.my/economy/EID_web.htm. Musa, S., A. R. Kassim, S. M. Yusoff and I. S. (2003). Assessing the status of logged-over production forests: The development of a rapid appraisal technique. FAO. Retrieved 15.03.2007, from http://www.fao.org/docrep/005/AC838E/AC838E00.HTM. Nemecek, T., A. Heil, O. Huguenin, S. Meier, S. Erzinger, S. Blaser, D. Dux and A. Zimmermann (2004). Life cycle inventories of agricultural production systems: Data v1.1 (2004). Ecoinvent report No. 15. Ecoinvent Centre. Duebendorf, Switzerland. Patel (1999). Closing carbon cylces: Carbon use for materials in the context of resource efficiency and climate change. Faculty of Chemistry. Utrecht, the Netherlands, Utrecht UniversityPhD. Postlethwaite, D. (1995). "A Life-Cycle Inventory for the Production of Soap in Europe." Tenside Surfactants Detergents 32(2): 157-170. Reijnders, L. and M. A. J. Huijbregts (2002). "Choices in calculating life cycle emissions of carbon containing gases associated with forest derived biofuels." Journal of Cleaner Production 11: 527-532. Reijnders, L. and M. A. J. Huijbregts (2003). "Choices in calculating life cycle emissions of carbon containing gases associated with forest derived biofuels." Journal of Cleaner Production 11: 527-532. Reijnders, L. and M. A. J. Huijbregts (2006). "Palm oil and the emission of carbon-based greenhouse gases." Journal of Cleaner Production: doi: 10.1016/j.jclepro.2006.07.054. Reinhardt, G. (2006). Biofuels: GHG Calculations: Methodological approaches and perspectives. Methodology of GHG Calculation Workshop. Amsterdam, the Netherlands. 30. October 2006. Rupilius, W. and S. Ahmad (2006). "The changing world of oleochemicals." Palm Oil Developments 44: 15-28. Sabah Forestry Department (2006). Forest reserves. Retrieved 20.04.2007, from http://www.forest.sabah.gov.my/english/portals/0/pdf/chap4/43ForestReserves.pdf. Shirai, Y., M. Wakisaka, S. Yacob, M. A. Hassan and S. Suzuki (2003). "Reduction of methane released from palm oil mill lagoon in Malaysia and its countermeasures." Mitigation and Adaptation Strategies for Global Climate Change 8(3): 237-252. Stalmans, M., H. Berenbold, J. L. Berna, L. Cavalli, A. Dillarstone, M. Franke, F. Hirsinger, D. Janzen, K. Kosswig, D. Postlethwaite, T. Rappert, C. Renta, D. Scharer, K.-P.
49
A Greenhouse Gas Balance of Electricity Production from Co-firing Palm Oil Products from Malaysia
Schick, S. W., H. Thomas and R. Van Sloten (1995). "European Life-Cycle Inventory for Detergent Surfactants Production." Tenside Surfactants Detergents 32(2): 84-109. Syahrinudin (2005). The potential of oil palm and forest plantations for carbon sequestration on degraded land in Indonesia. Center for Development Research - University of Bonn. Retrieved 19/03/2007, from http://www.zef.de/914.0.html. Tang, T. S. and P. K. Teoh (1985). "Palm kernel oil extraction - The Malaysian experience." Journal of the American Oil Chemists'Society 62(2). Teoh, C. H. (2000). Land use and the oil palm industry in Malaysia: Abridged report produced for WWF Forest Information System Database. Retrieved 04.03.2007, from http://assets.panda.org/downloads/oplanduseabridged.pdf. UBA (2006). Prozessorientierte Basisdaten fuer Umweltmanagement-Instrumente. Umweltbundesamt - German Ministry of the Environment. Retrieved 27.03.2007, from http://www.probas.umweltbundesamt.de/php/index.php. UNDP Malaysia (2006). Malaysia' s Peat Swamp Forests: Conservation and Sustainable Use. Retrieved 15.03.2007, from http://www.undp.org.my/uploads/Malaysia%20Peat%20Swamp%20Forest.pdf. Wakker, E. (2004). Greasy Palms: the social and ecological impacts of large-scale oil palm plantation development in Southeast Asia. AIDEnvironment. Retrieved 08.02.2007, from http://www.foe.co.uk/resource/reports/greasy_palms_impacts.pdf.
50
A Greenhouse Gas Balance of Electricity Production from Co-firing Palm Oil Products from Malaysia
10. Appendix Appendix 1: Field Visit.......................................................................................................................................51 Appendix 2: Carbon Stock Changes Due to Land Use Changes ....................................................................52
Appendix 1: Field Visit The field visit of oil palm plantations and mills near Sandakan, Sabah, Malaysia was conducted in connection with the RSPO and Cramer pre-audit by David Ogg (Control Union). Table 18: Timetable and Activities of Field Visit (Sabah, Malaysia) Date Location Activity Sandakan, Sabah, Malaysia • Arriving at plantation 06.02.2007 1. Plantation • Introduction to work 07.02.2007 • Visiting mature area of plantation, harvest, water conservation area, worker housing, health clinic, land fill area • Visiting mill 1. Plantation and Mill • Observing fertilization, pesticide application, mulching 08.02.2007 with EFB, beneficial plants, chemical storage and workshop • Compilation of plantation production data • CPO production data from mill 2. Plantation (Estate I and II) • Visiting plantation, immature area, replanting, nursery, 09.02.2007 and Mill health clinic • Collection of plantation production data (estates I and II) • CPO production data from mill Refinery, Sandakan, Sabah • Visiting refinery and their bio-electricity production 10.02.2007 system • Collecting production data from refinery Sandakan, Sabah, Malaysia • End of visit 11.02.2007
Data and Literature obtained: Data: as presented in tables in Chapter 4. Literature: Basiron, Y., Sukaimi, J. and Darus, A. (1998). Oil palm and the environment. Palm Oil Research Institute of Malaysia, Kuala Lumpur, Malaysia. Malaysian Palm Oil Council (2006). Oil Palm … tree of life. Kuala Lumpur, Malaysia. Malaysian Palm Oil Promotion Council (2000). Malaysian Palm Oil. Palm Oil Information series. Kuala Lumpur, Malaysia. Malaysian Palm Oil Promotion Council (undated). Oil Palm and the Environment: Facts from Fiction. Kuala Lumpur, Malaysia.
51
A Greenhouse Gas Balance of Electricity Production from Co-firing Palm Oil Products from Malaysia
Appendix 2: Carbon Stock Changes Due to Land Use Changes Table 19: Methodology for carbon stock changes for land use change What is calculated? How is it calculated? CARBON STOCK CHANGES FROM LAND USE CONVERSION Carbon stock changes of above- and belowground biomass Carbon stock changes in biomass ∆C = ( B −B ) * CF
Based on IPCC - Vol. 4 equation
2.16
(11)
Carbon stock changes of dead organic matter (DOM) Carbon stock changes in DOM ∆C DOM = C n − C o over plantation lifetime
2.23
(12)
Carbon stock changes in soil Soil carbon stock changes over plantation lifetime
2.25
(13)
2.25
(14)
2.9
(15)
B
Soil organic carbon stock
after
before
∆C soil − Mineral = SOC 0 − SOC 0 −T Where: SOC = c , s ,i
( SOC REFc , s , i • FLU c , s , i •FMG c , s , i • FI c , s , i )
CARBON STOCK CHANGES FROM PLANTATION Carbon stock changes due to ∆CG = Gtotal * CFP biomass growth on oil palm plantation DOM ∆C plant DOM - from field experiments Soil
(Syahrinudin, 2005) ∆C plant min eral - from field experiments
(Syahrinudin, 2005) EMISSIONS FROM LAND USE CHANGE Carbon stock changes – land ∆C Con = ∆C B + ∆C DOM + ∆C min eral conversion Carbon stock changes ∆C Plant = ∆C G + ∆C plant . DOM + ∆C plant , soil plantation Overall stock changes ∆C = ∆C + ∆C con
plant
Annual CO2 emissions per ha
∆C time ∆CO 2 average = ∆C average * ( − 44 12)
Annual CO2 emissions per GJ CPO
∆CO2 =
Average annual carbon stock changes per ha
∆C average =
∆CO2
average
n/a n/a
n/a
(16)
n/a
(17)
n/a
(18)
n/a
(19)
n/a
(20)
n/a
(21)
(CPO energy / ha)
Table 20: Abbreviations used in the land use change emission methodology Abbreviation Explanation of abbreviation Bafter biomass stock immediately after conversion Bbefore biomass stock before conversion Cn carbon stock under new land use category Co carbon stock under old land use category carbon stock change in biomass ∆C B carbon stock changes due to land conversion (including biomass, DOM and soil) ∆C con carbon stock changes at plantation (including biomass, DOM and soil) ∆C plant Carbon stock changes in DOM over plantation lifetime ∆C DOM
52
A Greenhouse Gas Balance of Electricity Production from Co-firing Palm Oil Products from Malaysia
∆C G plantation ∆C Mineral CFP CF FLU FMG FI G total SOCO SOCO-T SOCREF Time
carbon stock change due to CO2 assimilation at oil palm (above and below-ground biomass Soil carbon stock changes over plantation lifetime carbon fraction of dry matter palm tree carbon fraction of dry matter stock change factor for land-use system stock change factor for management regime stock change factor for input of organic matter biomass growth over oil palm over 25 years soil organic carbon stock in last year of inventory time period soil organic carbon stock in first year of inventory time period reference carbon stock time for which carbon stock changes are allocated
53