social linking using an explanation-based similarity measure. ... In this paper, we propose a social networking framework for parents of autistic chil- dren. Autism ...
A Health Social Network Recommender System Insu Song1 , Denise Dillon2 , Tze Jui Goh3 , and Min Sung3 1,2
School of Business Information Technology, and Psychology James Cook University Australia {insu.song,denise.dillon}@jcu.edu.au 3 Institute of Mental Health (IMH), Singapore {Tze Jui Goh,Min SUNG}@imh.com.sg
Abstract. People with chronic health conditions require support beyond normal health care systems. Social networking has shown great potential to provide the needed support. Because of the privacy and security issues of health information systems, it is often difficult to find patients who can support each other in the community. We propose a social-networking framework for patient care, in particular for parents of children with Autism Spectrum Disorders (ASD). In the framework, health service providers facilitate social links between parents using similarities of assessment reports without revealing sensitive information. A machine learning approach was developed to generate explanations of ASD assessments in order to assist clinicians in their assessment. The generated explanations are then used to measure similarities between assessments in order to recommend a community of related parents. For the first time, we report on the accuracy of social linking using an explanation-based similarity measure. Keywords: Social networking, health social network, health informatics, recommender system.
1 Introduction 1.1 Motivation Recently, social networking for health care has shown great potential to empower patient self-care. Examples include PatientsLikeMe1 and the IBM Patient Empowerment System. These newly emerging patient-driven health care services facilitate information exchange and collaboration between patients and between patients and doctors. The services provided by health social networks include (a) emotional support and information sharing, (b) physician Q&As, and (c) self-tracking of a condition, its symptoms, treatment options and other biological information [16]. In this paper, we propose a social networking framework for parents of autistic children. Autism is characterized by a triad of impairments [18] in the areas of reciprocal social interaction, communication and repetitive and stereotyped behaviors. Asperger’s Disorder is similar to Autism, but involves no deviance or delay in language development. Studies have demonstrated that early diagnosis can lead to better prognosis 1
(http://www.patientslikeme.com/all/patients)
D. Kinny et al. (Eds.): PRIMA 2011, LNAI 7047, pp. 361–372, 2011. c Springer-Verlag Berlin Heidelberg 2011 �
362
I. Song et al.
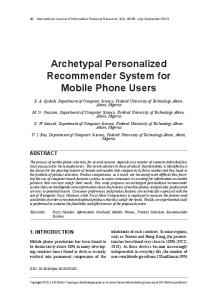
Fig. 1. (a) illustrates the overall process of generating textual explanations to classification results. (b) shows an example use of the explanation method, where a clinician make use of textual explanations to previous or current assessments, such as Autism. Mobile devices such as smart phones can be used to record interview questions and provide on the spot classification and explanations to provide more objective mental health assessments.
for children with Autism Spectrum Disorders (ASD) [1]. However, most children get diagnosed only upon entering the school environment when the behavioral difficulties become more prominent. Hence, the implementation of early surveillance and screening is crucial to identify children at risk for ASD at an earlier stage [8,7,11]. Recently, machine learning techniques such as support vector machines (SVMs) have shown significant potential for supporting the practice of medicine and psychiatric classification [5]. The application of machine learning techniques in ASD diagnosis has significant merits because of the potential to provide early diagnosis and more standardized objective diagnosis. Conventionally, expert psychiatrists consciously and unconsciously analyze the language of their patients to make a clinical diagnosis using diagnostic classification schemas, such as the DSM IV [6] and ICD 10 [9]. Although the DSM-IV and ICD-10 guidelines are helpful to clinicians in the diagnostic process, the effectiveness of their utilization depends on the experience of the clinician [12]. ASD is usually a lifelong condition such that long-term treatment planning and supports from family and communities are essential. Social networking for health care may empower parents of autistic children to share information with other parents and more easily collaborate with doctors. In this paper we develop a method of facilitating social linking of parents by similarities of assessment reports of their children. Explanations of classification results of assessment reports are used to measure similarities of the assessment reports. The experiments describe a first attempt to generate explanations of why practicing psychiatrists would have diagnosed autism cases using a decompositional approach: learned SVM model parameters are analyzed to select informative features, and then sensitivity filtering is used to select some subsets of more relevant features. Figure 1 (a) illustrates an overview of our approach to generating explanations for psychological assessments using Support Vector Machines (SVMs). Explanation terms are extracted from assessment documents using both SVM models and classification results. Figure 1 (b) shows how our method can be used to provide explanation assisted assessment of autism and other mental health issues. For example, the explanations can highlight the main issues that were used to differentiate the particular autism case from normal cases.
A Health Social Network Recommender System
363
1.2 Background This work is based on social networking, text mining, text classification and, in particular, recommendation systems. The following section provides a brief overview of the core techniques, focusing on social networking, recommendation systems, support vector machines (SVMs), and the significance of generating human-comprehensible explanations from SVMs. Social Network and Recommendation System. A health social network is an online information service which facilitates information sharing between closely related members of a community. Also known as social media on the Internet, or Health 2.0, a health social network empowers patients and health service providers by promoting collaboration between patients, their caregivers, and clinicians [14]. At its basic level, a health social network provides emotional support by allowing patients to find others in similar health situations. They can also share information about conditions, symptoms and treatments [16]. Other services include physician Q&A, and self-tracking of condition, symptom, treatment and other biological information [16]. The self-supporting community is particularly important for lifelong conditions like autism. The main means of finding patients with similar health conditions are based on laborintensive methods such as searching the Internet, keywords in community titles and descriptions of other members in communities [15]. Over the years, many recommender systems and similarity measurement methods have been developed [3]. The approaches can be broadly classified into two categories: content matching based on available semantic information and a collaborative filtering approach based on overlapping membership of pairs of communities [15]. Our novel approach is based on semantic information of autism assessment reports. Support Vector Machines. Cortes and Vapnik [2] introduced support vector machines (SVMs) which are a novel approach to machine learning. SVMs are based on the structural risk minimization principle in order to overcome the overfitting problems. Support vector machines find the hypotheses out of the hypothesis space H of a learning system which approximately minimizes the bound on the actual error by controlling the empirical error using training samples and the complexity of the model using the VCdimension of H. SVMs are very universal learning systems [10]. In their basic form, SVMs learn maximal margin hyperplanes (linear threshold functions). A hyperplane can be defined by a weight vector w and a bias b: w·x+b= 0 The corresponding threshold function for an input vector x is then given by: f (x) = sign(w · x + b) However, it is possible learn polynomial classifiers, radial basis function (RBF) networks and three or more layered neural networks by mapping input data x to some other (possibly infinite dimensional) feature space φ (x) and using kernel functions K(xi , x j ) to obtain dot products, φ (xi ) · φ (x j ), of feature data.
364
I. Song et al.
Fig. 2. Parents of autistic children collaborate with hospital and the community to share experiences and learning to address their needs. The hospital engages in the community by providing links between parents having children with similar assessment results. Families are matched based on similarity of their explanation terms.
Generating Explanations from SVMs. Much of the work that aims at providing an explanation capability to SVMs has focused on rule extraction techniques [4] following the footsteps of the earlier effort to obtain human-comprehensible rules from artificial neural networks (ANNs). One approach to classifying rule extraction methods is the translucency dimension which includes decompositional and pedagogical (or learning based) techniques as extremes [13]. The decompositional approach analyzes the internal representation of the ANN. In general, decompositional rule extraction techniques start with analyzing each individual neuron and their weight vectors to generate localized rules. Initially, the inputs and outputs of the neurons form antecedents and consequents of the rules, respectively. On the other hand, the strategy of the pedagogical approaches considers the trained ANN as a “black box” and aims at finding rules that map the ANN inputs directly to outputs [17]. For example, a decision tree can be generated from pairs of input and output values of the trained ANN. 1.3 Overview In the next section, we propose a social networking framework for parents of autistic children that utilizes mobile phone-based ubiquitous computing. The remainder of the paper summarizes experiments and their results: text classification, explanation generation for classification results, statistical analysis on the model parameters that are generated for autism diagnosis reports, and social linking using explanation similarities.
A Health Social Network Recommender System
365
2 Parent Network Framework We propose a parent social-network framework, where health service providers can actively engage in facilitating information sharing and social links between parents. Figure 2 shows how hospitals can interact with communities of parents. Parents who are concerned about their children can obtain preliminary assessment tools from hospitals via their mobile phones. They can fill in a standard assessment questionnaire to get a preliminary diagnosis and to obtain information on how to get help. Upon the first consultation with a clinician, the mobile agent on the parent can provide the clinician’s agent completed questionnaires and other preliminary diagnosis results improving both the effectiveness and the efficiency of the clinician. The clinician can then, via the mobile agent of the parent, provide a treatment plan and tasks that parents can follow. The assessment report is then stored in the data mining server to generate explanations and parent-link information about other parents of children with similar diagnoses. Subsequent visits to the hospital will provide more refined treatment plans and information about communities who can share their experiences and should facilitate learning in order to meet the parents’ needs, such as emotional supports and clinical knowledge.
3 Experimental Evaluation 3.1 Methodology A preliminary study has been undertaken to generate explanations of autism diagnosis reports obtained from IMH (Institute of Mental Health, Singapore). Figure 3 illustrates our method of generating explanations. The autism diagnosis reports were obtained from mental health clinics and comprise of a total of 236 reports: 217 positive cases and 19 negative cases. A small part of the observation section of an autism assessment report is shown below (the sentences are paraphrased to protect the identity of patients): – He had difficulties in responding to questions. – He displayed difficulties in expressing himself and responded with only short incomplete sentences. – He would respond with body gestures or single words when asked to elaborate on his responses. – Often, he responded very slowly taking time to think before responding to questions. The autism text documents are represented as attribute-value vectors (“bag of words” representation) where each distinct word corresponds to a feature whose value is the frequency of the word in the text sample. A text document is represented as a feature vector x = (x1 , ., x j , .., xL ) where x j is the j-th feature. Values were transformed with regard to the length of the sample. Function words were removed and stemming was performed on each extracted text. In summary, input vectors for machine learning consist of attributes (the words used in the sample) and values (the transformed frequency of the words). Outputs are autism versus normal, that is, binary decision tasks were learned. Clearly, the expressive power of the resulting explanations is limited by this “bag of words” representation.
366
I. Song et al.
Fig. 3. Overview of the methodology and experiment of generating explanations to autism diagnosis result
For LOO (leave-one-out) cross validation, 236 SVM models were generated using the linear kernel for the autism assessment data sets. Thus, each model is used to classify one document. An SVM model is defined by support vectors xi and associated parameters. The decision value of a text sample (represented as a feature vector x) is then obtained as follows: d(x) =
∑ αi yi K(xi , x) + b
i∈SV
where xi are support vectors and x is the feature vector, αi are Lagrangian multipliers, and b is the offset. The antecedent of the rule of inference is then this:
∑ αi yi xi · x + b ≥ 0
i∈SV
That is, if d(x) ≥ 0, the feature vector x is positive or else negative. We use this insight into the SVM models to define three types of explanations: 1. Explanation A comprising all the features contributing to the decision value d(x); 2. Explanation B comprising top-N contributing features that are sufficient to classify the features; 3. Explanation C comprising top-N contributing features that also have their sensitivity values ∂ d/∂ x j greater than a set threshold value τ .
A Health Social Network Recommender System
367
Fig. 4. (a) Relationship between contribution (deviation), sensitivity, and word ranks. Each point is a feature component that contributes to the decision of a feature. If a feature is a positive (negative) case, only the feature components having positive (negative) contributions are plotted. Rank 1 represents the most frequent term. (b) True-positive rate vs. false-positive rate of a linear support vector machine.
Technical details on generating each explanation type are described in Section 4. This approach is clearly a decompositional approach: analysis on the model parameters to select informative components and selecting subsets of more relevant components. Figure 4a summarizes the significance of each type of explanations. It plots contribution, sensitivity, and word rank of all features of the autism data set. It shows that sample features with higher ranking orders (more frequent words) and higher sensitivity values tend to have larger contribution values. This suggests that features having higher sensitivity values and higher ranking order provide greater information in decision making than other features. It also shows that most of the large contributions are made by more frequent words (high rank words). 3.2 Results Support vector machines trained on the autism assessment data set achieved an accuracy of 90% and AUC (Area Under the Curve) of 0.95. The corresponding ROC curve is shown in Figure 4 (b). The sensitivity values are adjusted manually to obtain a reasonable amount of terms for Explanation type C. Sample explanations of a positive autism diagnosis case are provided below (Explanation A samples too big to show here): 1. Explanation B: social (94 46), mother (53 18), brother (50 23), old (44 58), interest (39 27), game (28 24), describe (27 24), share (21 41), computer (18 31), family (18 33), resource (17 42), limit (16 36), information (16 62), create (13 28), Strategies (11 36),.., (omitted the rest).
368
I. Song et al.
2. Explanation C: social (94 46), old (44 58), interest (39 27), share (21 41), computer (18 31), family (18 33), resource (17 42), limit (16 36), inform (16 62), create (13 28), strategies (11 36),.., (omitted the rest). The numbers (d(x)i , ∂ d/∂ xi ) indicate relative contribution values d(x)i to the decision value d(x) and sensitivity ∂ d/∂ xi of the i-th term, respectively. Sensitivity-filtering (Explanation C) eliminates some of less sensitive terms (bold-faced terms) from Explanation B. Sample explanations of a negative autism diagnosis case are provided below: 1. Explanation B: average (-190 -41), appropriate (-126 -71), his (-84 -18), attention (-62 -84), during (-41 -29), children (-32 -40), indicated (-20 -51), good (-19 -57), age (-19 -29), reason (-18 -20), attempt (-16 -26), regular (-14 -12), in (-12 -10), apparently (-11 -26), mental (-10 -22), well (-9 -35),.., (omitted the rest). 2. Explanation C: average (-190 -41), appropriate (-126 -71), attention (-62 -84), during (-41 -29), children (-32 -40), indicated (-20 -51), good (-19 -57), age (-19 -29), attempt (-16 -26), apparently (-11 -26), well (-9 -35),.., (omitted the rest). Negative cases have negative contribution and sensitivity values.
4 Generating Explanations from SVM Models In order to calculate the contribution values of each feature of a feature vector x, we use the centroid C of the population, which is estimated using the centroid Csv of the support vectors: 1 Csv = ∑ φ (xi ) Nsv i∈SV where Nsv is the number of support vectors. We can then calculate the deviation of a feature vector x from the estimate population centroid: D(x) = φ (x) − Csv Suppose Csv is on the hyperplane: w · φ (Csv ) ≈ − b. Then, we can obtain the decision value d(x) using the deviation D(x): d(x)≈(w · (φ (x) − Csv )) =
∑ αi yi [K(xi , x)−K(xi , Csv )]
i∈SV
If K is the linear kernel, we can estimate the contribution of each j-th feature x j as follows: Csv, j = d(x) j =
1 ∑ xi, j Nsv i∈SV
∑ αi yi xi, j (x j −Csv, j )
i∈SV
Now, for a feature vector x, we can explain why a sample is positive (negative) by listing the feature elements that contribute to the decision value. That is, we can rank
A Health Social Network Recommender System
369
the features of a feature vector according to the amount of contributions made by the features. This is used as the basis of the explanation type A. We can also calculate the sum of all negative (positive) contributions and choose the top N positive (negative) contributions that are sufficient to push the decision value to positive (negative). This is used as the basis of the explanation type B. It can be shown that Explanation A, B, and C are consistent: the same features are not used to explain an opposite class. Consistency is one of the criteria for evaluating rule quality (Andrew et al. [13]). Other important criteria for evaluating rule quality are accuracy and fidelity. It can be shown that the accuracy of an SVM model is bounded by the accuracy of explanation terms. Furthermore, we can achieve a similar performance using only the explanation-terms as the vocabulary: explanation-terms can mimic the behavior of the SVM model from which the explanation terms are extracted. That is, the explanations display a high level of fidelity. This method can easily be extended to non-linear SVM models with convex decision boundaries. Applying the K-NN algorithm, N number of support vectors can be selected as an explanation reference point forming a centroid and a hyperplane in the input space. This new hyperplane is now a linear SVM model that can be used to generate explanations with regard to the selected support vectors. 4.1 Filtering Explanations with Sensitivity Training a support vector machine for a data set of interest generates a hyperplane, which can be used to obtain the distance of a feature vector to the hyperplane to classify. The distance is normal to the hyperplane and thus the importance of a feature can be measured as the rate of change of the distance with respect to the feature. This can be easily obtained for a linear classifier as follows:
∂ d(x) = ∑ αi yi xi, j ∂xj i∈SV where d(x) is the distance of feature x to the hyperplane, x j is the j-th component of the feature x, and xi, j is the j-th component of a support vector xi . As we can see from the above equation, the importance of the j-th component for the hyperplane is the sum of j-th component of the support vectors multiplied by the class label and the Lagrange multipliers.
5 Social Linking of Parents by Explanation Similarities The explanations generated provide relevancy of each feature to the particular classes. We can use this information to measure the relevancy of each part of the explanations to measure similarities between assessments. We use a semantic similarity measure between two terms based on a common sense database called ConceptNet 2 . This measure then can be used to link parents having children with similar assessment results. 2
Used ConceptNet v2.1 from the Common Sense Computing Initiative at the MIT Media Lab (http://csc.media.mit.edu).
370
I. Song et al.
Fig. 5. Error rates of linking 18 autism assessment reports to top-K most similar assessment reports using top-N most contributing explanation terms
We start with a simple approach to generating similarity measures. The method is scoring each explanation term in one assessment with each explanation term in another assessment. In this approach, the similarity between two assessments is given by determining contributions made by explanations terms and semantic relationships between terms. The similarity between two explanations A and B are defined as follows: si, j =
1 ∑ ∑ u(i, j)|d(A)i ||d(B) j | |A||B| i∈A j∈B−{i}
where u(i, j) is the semantic similarity function that measures how close the term i in explanation A is to the term j in an explanation B where i �= j, d(A)i and d(A) j are the amount of contributions of the features i and j, respectively. ConceptNet analogy space is used as the similarity function. Each semantic similarity between terms is the L1 similarity measure for social networks defined in [15]. That is, dot products of two → − → − vectors i and j in the analogy space, but weighted with contributions of terms. The parent link information is then generated by ranking assessments that are closed to an assessment and selecting N most similar assessments. To test the effectiveness of this method, similarities between 16 assessments were measured: 8 assessments with autism diagnosis and 8 assessments with negative autism diagnosis. The average of the similarity measure between assessments with same diagnosis results was 8.66 and the average of the similarity measures between assessments with different diagnosis results was 6.83. The method of measuring similarities did not have information on class labels, but was able to distinguish positive cases from negative cases only using semantic similarity between the explanation terms. Figure 5 shows the error rates of linking parents to other parents with the same diagnosis results, where the error rate is defined as follows: Error Rate =
Number of Incorrect Recommendations Number of Recommendations
A Health Social Network Recommender System
371
The parents were linked by selecting top-K most similar assessments using top-N most contributing explanation terms. It shows that when one parent was linked to 32% or less proportions of the total community, the error rate is less than 35%, and it consistently gets better as K decreases further. The average error rate matrix in Figure 5 (b) clearly indicates that a small number of key explanation terms can provide good link information and that the relevance information of explanation terms is useful. Using this similarity measure, we can recommend a parent p to a community in a set C of communities by selecting the community with the maximum average-similarity between the parent p and all parents p� in a community c: R(p,C) = argmax c∈C
1 s p,p� |c| p∑ � ∈c
6 Discussions and Future Work This is the first report of a novel approach in providing social network-based health care services to families with ASD children. This is also the first report on the accuracy of social-linking using an explanation-based similarity measure. We showed that a semantic similarity measure between explanations of assessments has great potential for discovering close social communities of parents who can support each other for lifelong conditions like autism. It can also be used to find all potential hidden communities of patients and parents on the Internet. There is massive potential of incorporating these sophisticated information extraction technologies in social networking more generally. Long term disabilities likes ASD pose a significant burden for families, and thus it is essential that health care services actively participate in communities to support patients’ families. The community suggestion method facilitates social linking between parents with similar assessment reports to make information obtained through social networking more relevant and useful. The approach of extracting some piece of knowledge using machine learning in explaining psychiatric assessments has the potential to provide early diagnosis and more standardized assessments, and to improve the usability of machine learning techniques in the medical and security domains. This approach of extracting explanations using some form of analysis on machine learning and associated parameters can be further expanded by using alternative feature representations of text data sets, such as concept terms or semantic terms.
References 1. Charman, T., Baird, G.: Practitioner review: Diagnosis of autism spectrum disorders in 2and 3-year-old children. Journal of Child Psychology and Psychiatry 43(3), 289–305 (2002) 2. Cortes, C., Vapnik, V.: Support-vector networks. Machine Learning 20(3), 273–297 (1995) 3. Deshpande, M., Karypis, G.: Item-based top-N recommendation algorithms. ACM Trans. Inf. Syst. 22(1), 143–177 (2004) 4. Diederich, J.: Rule extraction from support vector machines: An introduction. In: Rule Extraction from Support Vector Machines. SCI, vol. 80, pp. 3–31. Springer, Heidelberg (2008)
372
I. Song et al.
5. Diederich, J., Al-Ajmi, A., Yellowlees, P.: Ex-ray: Data mining and mental health. Applied Soft Computing 7(3), 923–928 (2007) 6. DSMIV: Diagnostic and Statistical Manual of Mental Disorders, Text Revision, 4th edn. American Psychiatric Association (2000) 7. Filipek, P.A., Accardo, P.J., Baranek, G.T., Cook, J.E.H., Dawson, G., Gordon, B., et al.: The screening and diagnosis of autistic spectrum disorders. Journal of Autism and Developmental Disorders 29(6), 439–484 (1999) 8. Filipek, P.A., Accardo, P.J., Ashwal, S., Baranek, G.T., Cook Jr., E.H., Dawson, G., et al.: Practice parameter: Screening and diagnosis of autism. report of the quality standards subcommittee of the american academy of neurology and the child neurology society. Neurology 55(3), 468–479 (2000) 9. ICD10: International Statistical Classification of Disease and Related Health. World Health Organization, Geneva (1992) 10. Joachims, T.: Making large-scale support vector machine learning practical, pp. 169–184 (1999) 11. Johnson, C.P., Myers, S.M.: The Council on Children with Disabilities: Identification and evaluation of children with autism spectrum disorders. Pediatrics 120, 1183–1215 (2007) 12. Klin, A., Lang, J., Cicchetti, D.V., Volkmar, F.: Brief report: Interrater reliability of clinical diagnosis and dsm-iv criteria for autistic disorder: Results of the dsm-iv autism field trial. Journal of Autism and Developmental Disorders 30(2), 163–167 (2000) 13. Robert Andrews, J.D., Tickle, A.B.: Survey and critique of techniques for extracting rules from trained artificial neural networks. Knowledge-Based Systems 8(6), 373–389 (1995) 14. Sarasohn-Kahn, J.: The wisdom of patients: Health care meets online social media. California HealthCare Foundation iHeath Reports (April 2008), http://www.chcf.org/publications/2008/04 15. Spertus, E., Sahami, M., Buyukkokten, O.: Evaluating similarity measures: a large-scale study in the orkut social network. In: Proceedings of the Eleventh ACM SIGKDD International Conference on Knowledge Discovery in Data Mining, KDD 2005, pp. 678–684. ACM, New York (2005) 16. Swan, M.: Emerging patient-driven health care models: an examination of health social networks, consumer personalized medicine and quantified self-tracking. International Journal of Environmental Research and Public Health 6(2), 492–525 (2009) 17. Tickle, A., Andrews, R., Golea, M., Diederich, J.: The truth will come to light: Directions and challenges in extracting the knowledge embedded within trained artificial neural networks. IEEE Transactions on Neural Networks 9(6), 1057–1068 (1998) 18. Wing, L., Gould, J.: Severe impairments of social interaction and associated abnormalities in children: Epidemiology and classification. Journal of Autism and Developmental Disorders. 9(1), 11–29 (1979)