Technological Forecasting & Social Change xxx (xxxx) xxx–xxx
Contents lists available at ScienceDirect
Technological Forecasting & Social Change journal homepage: www.elsevier.com/locate/techfore
A hierarchical framework for assessing corporate sustainability performance using a hybrid fuzzy synthetic method-DEMATEL Ming-Lang Tsenga,b,⁎, Kuo-Jui Wuc, Li Mac, Tsai Chi Kuod, Fuyume Saie a
Department of Business Administration, Lunghwa University of Science and Technology, Taiwan Institute of Innovation and Circular Economy, Asia University, Taiwan c School of Business, Dalian University of Technology, Panjin, China d Department of Industrial Engineering and Systems, Chung Yuan Christian University, Taiwan e Department of Business Management, Faculty of Business Administration, Daito Bunka University, Japan b
A R T I C L E I N F O
A B S T R A C T
Keywords: Corporate sustainability performance Hierarchical framework Fuzzy synthetic method DEMATEL Performance evaluation
This study constructs a valid and reliable hierarchical framework for assessing corporate sustainability performance. The traditional fuzzy synthetic method considers neither the causal interrelationships among criteria nor how to construct the hierarchical framework. In addition, previous studies have lacked a resource-based view, and few studies have discussed how to construct a hierarchical structure. Therefore, this study integrates the decision-making trial and evaluation laboratory method, exploratory factor analysis and the fuzzy synthetic method to assess corporate sustainability performance. The overall corporate sustainability assessment results for the Taiwanese textile industry are low because this industry needs to improve in social responsibility. However, the economic perspective performs well. This industry needs to focus on 1. the firm's economic activities; 2. stakeholder management; and 3. operational control aspects. The major causal effect criteria are listed in the discussion section. The contributions of this study are 1. a theoretical model to assess corporate sustainability performance and 2. the hybrid method proposed for this assessment.
1. Introduction Corporate sustainability (CS) has been studied and defined in previous studies. Traditionally, these studies recommend improving CS performance through efficient use of resources, reduced waste, improved economic performance and promotion of social reputation (triple bottom line, TBL) (Tseng et al., 2008; Shi et al., 2017). Few studies have discussed how to organize a hierarchal structure and even fewer have focused on the resource-based view (RBV) for integrating CS activities. In reality, a firm can further improve customer preferences and generate innovative capabilities to reinforce their CS performance. A firm's activities and CS performance are usually assessed using qualitative preferences and quantitative information. Although many studies have stated that complex interrelationships exist among CS attributes (Dočekalová et al., 2017), these studies have failed to address these interrelationships. Therefore, the CS attributes need to be integrated into a hierarchical framework, and the complex interrelationships among the qualitative preferences and quantitative information need to be addressed in the context of a firm (Epstein and Buhovac, 2010; Klewitz and Hansen, 2014). The literature states that firms need to achieve mutually ⁎
interdependent sets of TBL issues in their business activities (Elkington, 1998). Tseng (2017) studied CS to benchmark the weights of the aspects and attributes as described by qualitative data and to analyze the decision-making process. That study demonstrated that by acquiring benefits from sustainable design, code of conduct and eco-products, firms can increase their exchange across supply chain networks. Wijethilake and Munir (2016) found that enabling management controls had a positive impact on CS, whereas limiting management controls negatively affected stakeholder relationships. Witjes et al. (2017) noted that although firms have shown an increasing awareness of CS, integrating the TBL into their business activities is still problematic. The CS framework is a strategic integration for increasing a firm's effectiveness through accomplishing sustainability goals that enhance a firm's activities, achieve better customer service and increase profitability. Unlike in previous studies, an RBV needs to be addressed to improve the competitive advantage of a firm. In the RBV theoretical approach, the critical success factors can assist a firm in achieving its target or desired performance (Bryson et al., 2007; Fuisz-Kehrbach, 2014; Waligo et al., 2013). Rothaermel (2001) argued that appropriate resources provide more value and that firms perform better if they are connected with partners that have
Corresponding author at: Department of Business Administration, Lunghwa University of Science and Technology, Taiwan. E-mail address:
[email protected] (M.-L. Tseng).
http://dx.doi.org/10.1016/j.techfore.2017.10.014 Received 1 May 2017; Received in revised form 9 September 2017; Accepted 17 October 2017 0040-1625/ © 2017 Elsevier Inc. All rights reserved.
Please cite this article as: Tseng, M.-L., Technological Forecasting & Social Change (2017), http://dx.doi.org/10.1016/j.techfore.2017.10.014
Technological Forecasting & Social Change xxx (xxxx) xxx–xxx
M.-L. Tseng et al.
competitive advantage into a sustainable competitive advantage requires utilizing these resources efficiently and effectively. This transformation of valuable resources is not completely imitation or substitution and requires considerable effort. Furthermore, coherent and sophisticated firm activities with reciprocal reinforcement can further distinguish a firm's capabilities. A firm that utilizes the eco-control package fosters TBL capabilities, such as eco-learning, innovation, stakeholder integration, and shared environmental vision, and in turn improves its economic performance (Barrutia and Echebarria, 2015, Journeault, 2016a, b). Few studies discuss how to integrate CS and RBV, considering their interrelationships, into a properly implemented hierarchical structure under linguistic preferences. Therefore, this study proposes an approach that hybridizes the FSM and DEMATEL method to address this problem. Brockhaus et al. (2017) evaluated the impediments to the design and adoption of CS, and they identified four key motivations for these initiatives. However, the CS hierarchical framework is based on qualitative information and lacks a proper validation method; these issues must be addressed to help theorists and practitioners move towards a more enlightened practice and to unleash the market potential of mainstream sustainability (Rothaermel, 2001). The RBV approach could help explain CS performance.
dissimilar resources. Grewatsch and Kleindienst (2017) showed that the development of firm capabilities is rarely independent of the surrounding context. A firm's capabilities co-evolve as top management implements diverse environmental and organizational attributes that decision-makers focus and act on, depending on the particular context of the firm's RBV (Barrutia and Echebarria, 2015). In addition, previous studies have failed to address how to form the hierarchical framework. Adopting an inward method by assuming complete management control of resources is necessary for achieving a competitive advantage. Therefore, this study proposes a valid and reliable hierarchical framework for analyzing the CS attributes in order to prioritize them. However, the attributes are usually assessed qualitatively. Most previous studies used qualitative assessments (Azapagic, 2003; Lozano, 2012; Witjes et al., 2017), and most of the attributes were assessed using linguistic preferences. The CS attributes of a firm contain multi-level, qualitative information. Fuzzy set theory is used to interpret the human perceptions of the attributes given in linguistic preferences and has been used in many CS studies and applications (Cui et al., 2017; Shi et al., 2017; Vesely et al., 2016). The most important feature of human perceptions is ability to extract data from a large collection of information, which is still not well understood. In previous studies, the fuzzy synthetic method (FSM) was utilized to rank the weights of the attributes and determine the attribute priority from qualitative information. Therefore, this study proposes a hybrid method consisting of 1. exploratory factor analysis to create the hierarchical framework; 2. the decision-making trial and evaluation laboratory (DEMATEL) to reinforce the resources and to understand the causal effects of the attributes and 3. the FSM to establish the hierarchical framework using qualitative information. This study assesses the priority of TBL perspectives in the proposed hierarchical framework. The firm is assumed to recognize the financial and strategic benefits of pursuing CS in their strategic decision-making process. Therefore, the study objectives are the following: (Amini & Bienstock, 2014) to include a set of valid attributes in the hierarchical framework; (Azapagic, 2003) to propose a hybrid method for addressing the hierarchical framework and complex interrelationships among linguistic preferences; (Barrutia & Echebarria, 2015) to present the critical success attributes in terms of both a theoretical discussion and practical implementation; and (Baumgartner & Ebner, 2010) to address the causal effects among attributes. This study offers three main contributions. First, this study establishes and validates the attributes in a hierarchical framework to confirm the TBL perspectives. Second, the assessment combines and improves the FSM and DEMATEL (named FSM-DEMATEL) to improve the CS performance. Finally, the analytical results present the key success attributes. This study uses the RBV of the TBL for a firm's activities by decreasing the environmental impact and ensuring compliance with business goals. Along with pursing these objectives, firms tend to simultaneously improve their economic sustainability. The rest of this study is arranged as follows. Section 2 develops a theoretical approach and presents a literature review of the theoretical background. Section 3 presents the methods and the proposed analytical steps. The results are discussed in detail in Section 4. Section 5 provides the theoretical and managerial implications. The final section presents the conclusions, contributions, and limitations of this study along with possible future studies.
2.2. Corporate sustainability CS aims to ensure that environmental sustainability remains a priority rather than firms adopting a single, short-term emphasis on economic sustainability (Amini & Carol 201). Lozano (2012) defined CS as “corporate activity seeking to achieve sustainability equilibrium, which consists of the economic, environmental, and social responsibility dimensions, for today as well as throughout the time dimension while addressing the firm's systems and its stakeholders”. Vildåsen et al. (2017) stated that CS emphasizes the interactions among the TBL values. The need for considering multiple values has contributed to a conflict in the conceptual framework in terms of the dichotomy of positivism and constructivism. This framework can be applied to increase transparency on epistemological challenges, thus strengthening the construct validity and leading to a trend of clustering theoretical positions and value constructs. Witjes et al. (2017) showed that most firm's CS activities have been developed in isolation and have not yet been completely integrated into the business activities. They aimed to understand how firms have integrated CS into their business activities. In previous studies, the TBL boundary is always presented, and there is a need to readdress the practical aspects based on the TBL perspectives. Additionally, Lozano (2012) explained how firms can address their operations and processes, management and strategy, organizational systems, procurement and marketing, and assessment and communication to enhance the CS TBL. Journeault (2016a, b) suggested that the eco-control program supports the growth of environmental capabilities, such as eco-learning, environmental innovation, stakeholder integration, exchanged environmental vision and improved corporate performance. Wijethilake (2017) indicated that CS only partially mediates the relationship between proactive sustainability strategy and CS performance. Nonetheless, building CS management capability remains a key problem (Tseng et al., 2008; Fuisz-Kehrbach, 2014; Waligo et al., 2013). In addition, previous studies have failed to discuss the trade-off between capability and resources. Therefore, the RBV theory is properly addressed in this study. Finally, from the firms' viewpoint, Van Bommel (2011) argued that reaching competitive advantage through strategic integration with CS relies on the existing initiatives that respect the selected strategic orientation. Hahn (2013) indicated that one reason for lacking a precise strategy is that CS has highly diverse aspects, leading to uncertainty. In other words, the strategic decision processes for considering diverse aspects might increase the complexity and uncertainty. Engert et al. (2016) noted that the attributes most necessary to address are
2. Literature review This section presents a systematic review of the literature, defines the attributes and proposes analytical measures and methods. 2.1. Theoretical background RBV can increase the competitive advantage of a firm, depending on the integration of the firm's capabilities. Transforming a short-run 2
Technological Forecasting & Social Change xxx (xxxx) xxx–xxx
M.-L. Tseng et al.
developing a framework, acquiring the organizational influences and the external and internal drivers, and supporting or obstructing the integration between CS with strategic management. However, to determine the attributes for a firm's strategic decision-making process, several questions about the proper attributes, how to measure the qualitative information or compare this information to the current operational data and what the decision-making priorities are need to be answered. An appropriate assessment method is lacking in previous studies.
Table 1 Proposed CS attributes from 3 perspectives.
2.3. Proposed method Prior studies adopted quantitative information, survey-based approaches, and classical statistical methods in the CS context (Waligo et al., 2013; Witjes et al., 2017). However, few of these studies proposed a valid and reliable method for establishing the multi-level framework and translating the qualitative information. For instance, Lozano (2008) showed the cause-and-effect TBL interrelationships but failed to clarify the complex dynamic interrelations among attributes. However, the TBL is still unfamiliar to or misunderstood in different industrial applications. For an actual application, it is essential to facilitate a set of measures and understanding within and throughout the TBL concept. For instance, the studies of Lozano (2008) (2012) noted that complicated interrelationships exist among attributes and showed a hidden hierarchical framework in a real-world assessment. Joshi and Li (2016) emphasized that the use of sustainability control systems, such as a sustainability balanced scorecard, eco-control or sustainability management control systems, in translating the chosen CS strategy into actual performance must be examined. Tseng (2017) indicated that the TBL hierarchical structure should be considered in the decision-making process for the cost-benefit assessment. Dočekalová et al. (2017) showed that interrelationships exist among the proposed attributes; previous studies applied unsophisticated applications of classical statistical methods using accurate numbers and information. However, CS performance is often highly nonlinear, vague, partially inconsistent and multidimensional (Tseng et al., 2015; Su et al., 2015). Wijethilake (2017) investigated the mediating effect of sustainability control systems on the relationship between a proactive sustainability strategy and CS performance; the survey data were collected and then analyzed using partial least squares modeling. These studies presented the interrelationships among attributes, the uncertain information and a hierarchical framework. However, these studies were unclear on the framework or focused only on the TBL concept. Only a few studies have explained and built a valid and reliable framework for assessing CS performance. The analytical gaps from prior studies support the arguments presented in this study. Various methods can be used to determine the interrelationship among attributes in complex problems with limited historical data, which is often the situation for a firm's management functions. In the proposed model, the exploratory factor analysis groups the direct or indirect interrelationships among attributes and examines the validity and reliability of the attributes (Su et al., 2015; Tseng et al., 2015). In addition, the linguistic preference is uncertain in CS performance. Dočekalová et al. (2017) applied fuzzy similarity graphs to partially eliminate the problems related to a severe shortage of information. They used trends as non-numerical quantifiers, which resulted in the multi-level hierarchical framework. Very few studies traced back to find the causal effects of the attributes. Therefore, this study proposes a hybrid method to address complicated actual situations.
Attributes
References
C1 C2 C3 C4 C5
Synergistic organization Code of conduct Cost reduction Stakeholder's relations Multi-stakeholder engagement
Hart and Dowell, 2010
C6 C7 C8 C9 C10
Environmental performance Environmental policy Environmental reporting Strategic nature Eco-product and service design Eco-operational process Manager attitude and behavior Green manufacturing Human capital development Talent attraction and retention Labor practice indicators Corporate communication Corporate reputation Legal compliance Organization culture Transparency and communication
C11 C12 C13 C14 C15 C16 C17 C18 C19 C20 C21
Waddock and Samuel, 1997; Lozano, 2012
Siebenhüner & Arnold, 2007
Cheng & Shiu, 2012 Lozano, 2015 Handfield et al., 1997 Bonn and Fisher, 2011 Stead & Stead, 2013 Klettner et al., 2014 Stead & Stead, 2013 Bonn, I., Fisher, 2011 Van Bommel, 2011
proposed attributes. For example, multi-stakeholder engagement (C5) is related to several different attributes related to various stakeholder groups, contributes to the creation of shared value, and is connected with the strategic process (Waddock and Samuel, 1997; Lozano, 2012). In particular, synergistic organizations (C4) are more complicated in terms of CS. These organizations progressively build the perception of synergy between innovation and sustainability and then launch integrated innovation and sustainability efforts as part of sustainable design and production management (Hart and Dowell, 2010). Existing studies illustrate that stakeholder satisfaction affects a firm's financial performance and impacts resource generation, reinforcing competitive advantage. For instance, Waddock and Samuel (1997) demonstrated that diverse types of stakeholder engagement contribute to common value. Therefore, stakeholder engagement aligns with a firm's tactics and also affects other values; investor relationships are considered longterm interplay relations between firms and their individual and institutional investors in capital markets (C1). A code of conduct (C2) is an instrument for encouraging economic activities that support fair trade and build trust among producers, buyers and sellers within a market. In addition, cost reduction (C3) always accompanies CS integration: sustainable initiatives are able to reduce costs, develop environmental management systems, implement waste and energy management programs and improve the productivity and efficiency of material utilization (Lozano, 2015; Tseng 2017). From the environmental perspective, most firms are aware of the environmental impacts associated with their operational activities. Environmental performance describes the interaction between firms and the environment and is used to identify the environmental impacts of production and consumption (C6). For instance, a manager's attitude and behavior are usually guided by economic performance, which is related to environmental policy (C7), e.g., emissions charges, licenses and standards may encourage firms to increase their innovation. Thereafter, environmental reporting (C8) helps firms to improve their social responsibility and increase their social image. The strategic nature of an organization's sustainability is inseparability intertwined with corporate communication efforts, both internally and externally. Improving the sustainability of consumption and production aims to change manager attitudes and behaviors in terms of CS integration, thus reducing the organization's shortages and reinforcing the strategic
2.4. Proposed attributes The existing literature has proposed several CS attributes developed from the TBL, and Table 1 presents these twenty-one attributes. From the economic perspective, interrelationships exist among the 3
Technological Forecasting & Social Change xxx (xxxx) xxx–xxx
M.-L. Tseng et al.
of the complex network linking multiple stakeholders. Therefore, firms are facing the challenge of implementing TBL initiatives. Textile firms typically suffer from resource constraints when allocating resources for operational capabilities to improve their competitive advantage. This assessment has been verified by 35 academics and professionals. The respondents have at least 5 years of experience in the industry and a thorough knowledge of CS development. The proposed criteria for addressing CS are pertinent and timely issues that are particularly relevant to the textile industry, which continues to play an important role in this sector. The RBV aims to help firms understand the periodization of their CS attributes. To assist Taiwanese textile firms in improving their CS with limited resources, the complex hierarchical framework and interrelationships in the firm's management functions must first be understood. This study determined the decisive attributes, thus providing important managerial insights for improving performance. This study also applied the proposed method to evaluate the hierarchical framework. Thus, this study not only examined the CS operational processes and controls but also evaluated the attributes and CS performance of this industry. The significance of sustainable operations for the environment, overall business functions, and business profitability deliberations are considered in this study.
nature of sustainability efforts (Baumgartner and Ebner, 2010). Maon et al. (2008) expressed that manager attitudes and perceptions with respect to CS significantly impact the strategic design. Lozano (2015) showed that manager attitudes and behavior related to sustainability integration create the least reduction in internal organizational deficiencies and that leadership is a driver for CS integration. Thus, green manufacturing (C13) is an economically driven, system-wide, combined approach for reducing and eliminating all waste streams as part of the eco-product and service design (C10) and eco-operational process (C11). From the social responsibility perspective, the organizational culture (C20) is related to the sustainable beliefs, values and learning of a firm, which are embodied in arranging the materials and presenting the behavior of its stakeholders. Sustainability initiatives and the strategic nature of a firm's sustainability efforts need to consider the organizational culture. These attributes, such as human capital development (C14), talent attraction and retention (C15) and labor practice indicators (C16), link sustainability initiatives with organizational culture in a proactive way. Human capital development (C14) can be generated from productive consumption through investing in education and health to increase productivity and positively contribute to economic growth. In addition, talent attraction and retention (C15) are essential for supporting global enterprises; thus, a proper policy is needed to retain talented workers and overcome the predicament of labor mobilization. Moreover, labor practice indicators (C16) evaluate the level of labor protection, which allows the public to judge a firm's social accountability related to the environment. Beyond the organizational culture, transparency and communication (C21) reduces complexity, makes fulfilling the firm's strategic objectives manageable, and disseminates the CS culture. Corporate communication (C17) is the sophisticated communication of highly detailed information on CS activities and performance. Corporate reputation (C18) is the existing stakeholder perception of the firm in terms of CS. Finally, legal compliance (C19) is the difficulty of acquiring an overview of myriad industry-specific social and environmental regulations prior to launching activities; ensuring legal compliance is a huge challenge for firms (Tseng et al., 2008; Tseng et al., 2015). Previous studies have resolved the issues related to external communication, primarily using sustainability reports. In contrast, internal communication is discussed only rarely. However, internal communication is also key to the integration process (Klettner et al., 2014; Siebenhüner & Arnold, 2007). In addition, a number studies have argued that integrating CS into strategic management improves a firm's competitive advantage (Lin and Tseng, 2016; Stead & Stead, 2013). Porter and Kramer (2002) stated that the main focus of a firm's sustainability initiatives should be adding value and then creating competitive advantage. However, a framework is required to provide an appropriate strategic link for addressing the social, environmental, and economic aspects of sustainability and to create value for the firm as well as society. This CS framework aims to help a firm achieve their objectives while integrating internal and external activities.
3.2. FSM-DEMATEL A multi-criteria evaluation model is proposed to assess the CS TBL. The series of criteria is a = {a1, a2, a3…, an}, and the evaluation matrix is (mij)m ∗ n, where mij is the degree of performance for a specific criterion. The TBL perspectives (P1, P2, P3) and the 21 criteria were collected through a questionnaire with a 5-point linguistic scale for the performance perceptions. The scale contains five linguistic degrees: very low (VL), low (L), medium (M), high (H) and very high (VH). mij denotes the degree to which the perspectives (P) satisfy criterion i in the evaluation matrix, which can be written in matrix form as follows: p
p
p
p
p
p
(Mi k )1 ∗ 5 = (mi1k , mi2k , mi3k , mi 4k , mi5k )
(1)
The perspective can be calculated using the following equation: 5
Pk =
∑ (rj mijPk ) (2)
j=1
where rj is the rating given to criterion i, namely, rj = 1, 2, 3, 4, 5. The measurement criticality (MC) is typically adopted to measure how the criteria are related to the perspectives. Using the mathematical average to calculate the input value to the matrix and to keep the scale of MC consistent with the 3 perspectives and all the criteria, the following formula is proposed:
MCi =
n
P1∗P 2∗P 3
(3)
The Pk values are used to generate the direct relation matrix (Pk). RPk is an n × n matrix that is generated from the paired comparisons of CS among the criteria after applying the FSM. Thus, RijPk represents the degree to which criterion i affects criterion j.
3. Method
RPk = [Rij Pk ]n ∗ n
This section discusses the case study background, the proposed FSM-DEMATEL and the proposed analytical analysis.
(4)
Adopting the following equation normalizes the direct relation matrix RPk.
3.1. Case study background
D = RPk /
max
The Taiwanese textile industry began in the 1970s and has become a worldwide industry. The required equipment is usually built in automated or semi-automated manufacturing plants owned by textile firms. The textile industry is considered to have great potential for bringing substantial benefits to the countries in which it operates. However, along with the growth of the industry, textile firms follow the TBL to operate their businesses. CS is increasingly required worldwide as part
n
∑ j=1 Rij
1≤i≤n
(5)
Once the normalized direct relation matrix D is obtained, the following equation can be used to generate the total relation matrix TR, where I represents the identity matrix.
TR = D (I –D)−1
(6)
Accumulating the rows (R) and columns (C) separately among the 4
Technological Forecasting & Social Change xxx (xxxx) xxx–xxx
M.-L. Tseng et al.
total relation matrix TR and then applying (C + R, C – R) produces the cause and effect graphic and divides the dataset into four quadrants based on the horizontal axis (C + R) and vertical axis (C – R). The horizontal axis vector (C + R) represents the relative importance of the criteria. The positive portion of the vertical axis (C – R) groups the criteria into causal groups, whereas the negative portion groups the criteria into effect groups.
TR = [dij ]n × n , i, j = 1, 2, …, n
P1 mrAllj =
x
∑i =1
P1 wvAsm x MRjjP1 ∗
P1 P1 P1 (MRAll )1 ∗ 5 = (WVAsm )1 ∗ x (mr Asm ) x∗5 P1 P1 P1 P1 P1 = (mrAll 1 , mr All2 , mr All3 , mr All 4 , mr All5 ) P2 mr Allj
=
x
∑i =1
P2 wvAsm x MRjjP 2 ∗
P2 P2 P2 (MRAll )1 ∗ 5 = (WVAsm )1 ∗ x (mr Asm ) x∗5 P2 P2 P2 P2 P2 = (mrAll 1 , mr All2 , mr All3 , mr All 4 , mr All5 )
(7)
P3 mr Allj
=
x
∑i =1
P3 wvAsm x MRjjP3 ∗
P3 P3 P3 (MRAll )1 ∗ 5 = (WVAsm )1 ∗ x (mrAsm ) x∗5
n
⎡ ⎤ = [dj ]n × 1 C = ⎢∑ dij ⎥ i = 1 ⎣ ⎦n × 1
P3 P3 P3 P3 P3 = (mr All 1 , mr All2 , mr All3 , mr All 4 , mr All5)
(8)
Pi
where (mrAsm )x∗ 5 represents a x 5 matrix. The overall Pi membership functions and MC can be calculated as follows:
n
⎡ ⎤ R = ⎢ ∑ dij ⎥ = [dj ]1 × n ⎣ j = 1 ⎦1 × n
Pi All =
(9)
k
wiP (i) = P/ ∑
Pi
i=1
k
∑i =1
rgjP 2 =
k
∑i =1
1. The CS-related TBL information is gathered from the literature review, and a group of 35 experts are consulted to confirm the criteria. The questionnaire respondents are required to have the professional and academic knowledge needed to achieve the study goal. 2. The linguistic information is translated into FSM scales. Then, the fuzzy numbers are converted into comparable values, and the fuzzy assessments are defuzzified using Eqs. (1)–(3). Exploratory factor analysis is used to group the criteria into a hierarchical framework, and the hierarchical structure has natural interdependent relations within the structure. The decision matrix is composed using Eq. (4). 3. The crisp values are applied to the total DEMATEL relation matrix using Eqs. (5)–(9). The mapping graphic of the causal effect is then presented. 4. The first-level crisp values (perspectives versus criteria) are composed, and the group weights are calculated using Eqs. (10)–(14). 5. The second-level crisp values (perspectives versus aspects) are computed using the CS perspectives and the overall weights. Then, the weights of the aspects are calculated using Eq. (16). The overall perspective weights are computed using Eqs. (17)-(Hart & Dowell, 2010).
wviP1 x emijP1 ∗
(11)
wviP 2 x emijP 2 ∗
(RgP 2 )1 ∗ 5 = (WViP 2 )1 ∗ k (EMiP 2 )k∗5 = (rtP1 2 , rtP22 , rtP32 , rtP42 , rtP52 ) rgjP3 = =
k
∑i =1
wviP3 x emijP3
∗ (WViP3 )1 ∗ k (EMiP3 )k∗5
= (rtP13 , rtP23 , rtP33 , rtP43 , rtP53)
(12)
Based on the perspective (P), the membership functions of the criteria group (t) can generated as follows: 5
PGt =
∑ (rj rtjPk ), k = 1, 2, 3
(13)
1
MCi =
P1∗P 2∗P 3
4. Results This section applies the proposed hybrid method and analytical steps. The exploratory factor analysis groups the criteria and names the clusters.
(14)
Next, the overall aspect weight for the perspective is calculated as WAs = {wAs1, wAs2……, wAsm }, where x is the number of aspects. The weight assigned to perspective j uses the following equation:
wgjPk =
(∑ P ) / ∑ (∑ k
i=1
i
j
x
k
j=1
i=1
Pk
)
j
(P1All∗P 2All∗P 3All ) where rj = 1, 2, 3, 4, 5 (Hart & Dowell,
This study proposes the following steps of the hybrid method for collecting the TBL attributes and conduct the analysis.
(10)
(RgP1 )1 ∗ 5 = (WViP1 )1 ∗ k (EMiP1 )k∗5 = (rtP11 , rtP21 , rtP31 , rtP41 , rtP51)
n
(17)
3.3. Proposed analytical steps
The results of the assessment are presented in terms of the fuzzy composition of the weight vector WV and the assessment matrix EM, namely, R = WV∗ EM. The P1, P2 and P3 membership function groups (g) can be calculated using the following equations:
rgjP1 =
5
Pk ) ∑ j=1 (rj mrAllj
MCAll = 2010).
Next, the weight W = (w1, w2…., wk) of each criterion is determined from the specific TBL perspective, where k is number of criteria. The weights arranged to a specific perspective i can be obtained from the following equation:
(RgP3 )1 ∗ 5
(16)
∗
4.1. Exploratory factor analysis Table 2 presents the factor analysis with the factor loadings, which are greater than 0.7, indicating the validity of the criteria. There are 6 groups in the hierarchical framework. The reliability tests (Amini & Bienstock, 2014) the economic activities of the firm (Cronbach α =0.898); (Azapagic, 2003) stakeholder management (α= 0.856); (Barrutia & Echebarria, 2015) policy and performance (α= 0.849); (Baumgartner & Ebner, 2010) operational control (α= 0.901); (Bonn & Fisher, 2011) corporate culture (α=0.878); and (Brockhaus et al., 2017) social image (α =0.815). The Cronbach α indicates the high reliability of these aspects. The results of criteria 1 under P1 indicates that 20% of the
(15)
where (∑i = 1kPi)j denotes the sum of P for k criteria in group m. The perspective membership functions of the overall weight can be obtained using the following equations:
5
Technological Forecasting & Social Change xxx (xxxx) xxx–xxx
M.-L. Tseng et al.
Table 2 Factor loading- grouping. Aspects
Criteria
As1
Firms' economic activities
As2
Stakeholder management
As3
Policy and Performance
As4
Operational control
As5
Corporate culture
As6
Social image
C1 C2 C3 C4 C5 C6 C7 C8 C9 C10 C11 C12 C13 C14 C15 C16 C17 C18 C19 C20 C21
Synergistic organization Code of conduct Cost reduction Stakeholder's relations Multi-stakeholder engagement Environmental performance Environmental policy Environmental reporting Strategic nature Eco-product and service design Eco-operational process Manager attitude and behavior Green manufacturing Human capital development Talent attraction and retention Labor practice indicators Corporate communication Corporate reputation Legal compliance Organization culture Transparency and communication
3
Factor loading
Reliability
0.856 0.825 0.810 0.789 0.776 0.825 0.817 0.809 0.789 0.778 0.774 0.764 0.758 0.875 0.868 0.851 0.825 0.798 0.778 0.774 0.768
0.898
0.856 0.849
0.901
0.878
0.815
respondents rated P1 as very low, 26% as low, 32% as medium, 19% as high and 0% as very high. Thus, the membership function of P11 is calculated as follows:
MC =
(MiP1 )(1 ∗ 5) = (miP1 1 , miP21 , miP3 1 , miP41 , miP5 1) = (0.20, 0.26, 0.32, 0.19, 0.00)
4.2. FSM-DEMATEL
P1 = 0.20/ very low + 0.26/ low + 0.32/ medium + 0.19/high + 0/very high
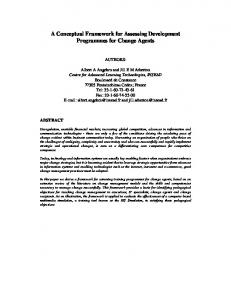
The FSM crisp value is used to compose the total relation matrix of the criteria. This analysis repeats the computational process using Eqs. (1)–(3). Table 4 presents the matrix determined using Eq. (4). Table 5 shows the significant and relation axis for the causal and effect groups. The criteria with positive values are causal criteria (C3, C4, C6, C7, C8, C9, C10, C11, C13, C14, C15, C18), whereas those with negative values are effect criteria (C1, C2, C5, C12, C16, C17, C19, C20, C21). For instance, the crisp value in C2 (P1-P3) versus C2 is calculated as 2.980 + 3.380 + 3.380 = 3.247. 3 Fig. 1 shows that the major causal criteria are cost reduction (C3), stakeholder relations (C4), environmental performance (C6), green manufacturing (C13), and talent attraction and retention (C15). Taking As1 as an example, the P1 membership function was
Table 3 presents the perspectives and criteria. The TBL perspectives are the economic perspective (P1), the environmental perspective (P2) and the social responsibility perspective (P3). For instance, the following equations show the computation for the perspectives relative to C1. The C1 MC value is 2.061, and the top 3 criteria are manager attitude and behavior (C12), eco-operational process (C11) and legal compliance (C19).
P1 = 1∗0.130 + 2∗0.240 + 3∗0.420 + 4∗0.110 + 5∗0.100 = 2.81. P2 = 1∗0.00 + 2∗0.35 + 3∗0.420 + 4∗0.230 + 5∗0.170 = 2.88. P3 = 1∗0.100 + 2∗0.250 + 3∗0.270 + 4∗0.230 + 5∗0.150 = 3.080.
P1∗P 2∗P 3 = 2.061
Table 3 Perspectives and criteria's using FSE. P1
C1 C2 C3 C4 C5 C6 C7 C8 C9 C10 C11 C12 C13 C14 C15 C16 C17 C18 C19 C20 C21
P2
Value
Membership function
2.810 2.980 2.870 2.930 3.360 3.350 3.300 3.570 3.430 3.710 3.560 3.740 3.080 3.040 3.358 3.230 3.510 3.410 3.764 2.900 2.940
0.130 0.100 0.170 0.150 0.000 0.000 0.000 0.000 0.000 0.000 0.000 0.000 0.110 0.130 0.008 0.120 0.110 0.130 0.009 0.150 0.110
0.240 0.170 0.210 0.180 0.240 0.240 0.210 0.170 0.200 0.190 0.210 0.150 0.170 0.160 0.190 0.110 0.100 0.090 0.120 0.210 0.190
0.420 0.450 0.310 0.370 0.350 0.370 0.420 0.350 0.360 0.270 0.350 0.230 0.370 0.350 0.390 0.400 0.320 0.280 0.320 0.330 0.390
0.110 0.210 0.200 0.190 0.220 0.190 0.230 0.220 0.250 0.180 0.110 0.350 0.230 0.260 0.260 0.160 0.110 0.240 0.200 0.210 0.270
0.100 0.070 0.110 0.110 0.190 0.200 0.140 0.260 0.190 0.360 0.330 0.270 0.120 0.100 0.152 0.210 0.360 0.260 0.351 0.100 0.040
P3
Value
Membership function
2.880 3.380 3.550 3.530 3.360 3.350 3.300 3.570 3.430 3.710 3.560 3.740 3.080 3.040 3.358 3.020 2.960 3.390 3.370 3.040 2.960
0.000 0.000 0.000 0.000 0.000 0.000 0.000 0.000 0.000 0.000 0.000 0.000 0.110 0.130 0.008 0.120 0.110 0.000 0.090 0.090 0.160
0.350 0.170 0.210 0.180 0.240 0.240 0.210 0.170 0.200 0.190 0.210 0.150 0.170 0.160 0.190 0.180 0.250 0.270 0.120 0.230 0.190
0.420 0.450 0.310 0.370 0.350 0.370 0.420 0.350 0.360 0.270 0.350 0.230 0.370 0.350 0.390 0.400 0.320 0.280 0.320 0.350 0.280
6
0.230 0.210 0.200 0.190 0.220 0.190 0.230 0.220 0.250 0.180 0.110 0.350 0.230 0.260 0.260 0.160 0.210 0.240 0.270 0.210 0.270
0.000 0.170 0.280 0.260 0.190 0.200 0.140 0.260 0.190 0.360 0.330 0.270 0.120 0.100 0.152 0.140 0.110 0.210 0.200 0.120 0.100
Value
Membership function
3.080 3.380 3.550 3.530 3.320 2.900 3.160 2.970 3.430 2.920 3.390 3.520 3.080 2.744 3.358 3.030 3.000 3.390 3.370 3.040 2.960
0.100 0.150 0.000 0.000 0.020 0.050 0.070 0.150 0.000 0.150 0.000 0.050 0.110 0.150 0.008 0.110 0.100 0.000 0.090 0.090 0.160
0.250 0.170 0.210 0.180 0.240 0.280 0.210 0.170 0.200 0.200 0.210 0.150 0.170 0.232 0.190 0.190 0.250 0.270 0.120 0.230 0.190
0.270 0.400 0.310 0.370 0.330 0.405 0.350 0.350 0.360 0.350 0.350 0.300 0.370 0.350 0.390 0.400 0.320 0.280 0.320 0.350 0.280
0.230 0.210 0.200 0.190 0.220 0.250 0.230 0.220 0.250 0.180 0.280 0.230 0.230 0.260 0.260 0.160 0.210 0.240 0.270 0.210 0.270
0.150 0.170 0.280 0.260 0.190 0.015 0.140 0.110 0.190 0.120 0.160 0.270 0.120 0.008 0.152 0.140 0.120 0.210 0.200 0.120 0.100
MC
Rank
2.061 2.134 2.151 2.152 2.156 2.124 2.135 2.161 2.173 2.177 2.189 2.222 2.097 2.065 2.158 2.100 2.114 2.166 2.188 2.077 2.068
21 13 11 10 9 14 12 7 5 4 2 1 13 20 8 16 15 6 3 18 19
Technological Forecasting & Social Change xxx (xxxx) xxx–xxx
2.838 2.959 3.080 3.486 3.471 3.327 3.450 3.648 2.824 3.326 3.091 3.147 3.494 2.986 3.174 2.770 2.825 3.247 2.776 2.996 0.000 Max
60.930 61.233 64.355 67.290 62.564 67.734 64.222 63.973 59.865 65.483 64.001 56.155 67.143 59.330 63.481 57.542 61.932 63.800 57.563 57.667 54.904 67.734
Table 5 The prominence and relation axis for cause and effect group.
2.882 3.155 3.377 3.473 3.433 3.612 3.259 3.082 3.108 3.306 3.424 3.170 3.587 3.124 3.325 2.893 0.000 3.515 3.301 3.140 2.832
2.721 3.040 3.204 3.343 2.948 3.409 3.175 2.959 2.818 3.187 3.174 2.556 3.311 2.693 3.098 2.667 3.008 0.000 2.606 2.734 2.690
2.835 3.023 3.179 3.289 3.167 3.237 3.135 3.222 2.918 3.071 3.124 2.569 3.589 3.140 3.111 2.871 3.147 3.332 0.000 2.890 2.808
3.303 2.893 3.080 3.236 3.479 3.461 3.180 3.102 2.881 3.507 3.391 2.620 3.233 3.076 3.163 2.993 3.309 3.143 2.645 0.000 2.703
C1 C2 C3 C4 C5 C6 C7 C8 C9 C10 C11 C12 C13 C14 C15 C16 C17 C18 C19 C20 C21 Max Min Average
3.120 3.249 3.394 3.392 3.391 3.390 3.134 3.119 3.056 2.849 2.678 2.345 3.404 2.974 0.000 2.674 2.985 3.172 2.853 2.774 2.587 3.265 3.091 3.299 3.502 3.092 3.039 3.043 2.910 2.505 3.076 2.814 2.428 3.060 0.000 2.868 2.410 2.662 3.460 2.683 2.729 2.570
2.926 3.265 3.626 3.776 3.327 3.536 3.187 3.323 3.183 3.588 3.502 3.039 3.655 3.209 3.542 0.000 3.250 3.217 2.722 2.857 2.767
C15 C14
C16
C17
C18
C19
C20
C21
Row
M.-L. Tseng et al.
C
R
C+R
C-R
9.060 9.594 10.083 10.526 9.694 10.556 9.892 9.877 9.286 10.084 9.909 8.624 10.444 9.234 9.858 8.957 9.618 9.901 8.894 9.041 8.591 10.556 8.591
10.120 10.715 9.981 10.040 10.158 9.558 8.840 9.328 8.891 9.062 8.977 9.062 9.068 9.048 9.435 10.163 10.082 9.247 9.588 9.707 9.770 10.715 8.840
19.179 20.309 20.064 20.566 19.852 20.114 18.732 19.205 18.178 19.146 18.886 17.686 19.512 18.282 19.293 19.119 19.700 19.148 18.482 18.748 18.361 20.566 17.686 19.170
(1.060) (1.122) 0.102 0.486 (0.465) 0.998 1.052 0.549 0.395 1.022 0.931 (0.438) 1.377 0.186 0.423 (1.206) (0.463) 0.654 (0.694) (0.666) (1.179) 1.377 (1.206) 0.042
2.458 2.888 2.730 3.205 2.921 3.033 3.250 3.054 3.138 2.832 3.130 2.889 0.000 2.828 3.093 2.733 2.940 2.962 2.590 2.959 2.601
rgjP1 =
wviP1 x emijP1
(11)
∗
2.737 3.084 3.050 3.199 2.854 3.127 2.923 2.889 2.796 3.309 2.862 0.000 3.224 2.690 2.956 2.880 3.095 2.855 2.631 2.445 2.459 3.005 3.152 3.235 3.515 2.888 3.483 3.056 0.000 2.502 3.302 2.985 2.622 3.036 2.689 2.970 2.939 3.143 2.880 3.179 2.728 2.469
2.705 2.868 3.084 3.106 2.846 3.208 3.004 2.875 0.000 2.954 3.007 2.343 3.078 2.832 2.898 2.585 2.813 2.983 2.528 2.714 2.552
2.920 3.209 3.157 3.439 3.171 3.630 3.241 3.280 2.985 0.000 3.313 2.985 3.472 2.938 3.425 2.936 3.241 3.356 3.190 3.094 3.060
2.773 2.887 3.039 3.162 2.861 3.216 3.038 3.075 2.657 2.950 0.000 2.449 3.295 2.919 2.963 2.613 2.790 2.869 2.581 2.756 2.661
⎡ 0.130 0.240 0.420 0.110 0 .100 ⎤ [0.324, 0.344, 0.331]∗ ⎢ 0.100 0.170 0.450 0.210 0.070 ⎥= ⎣ 0.170 0.210 0.310 0.20 0.110 ⎦ [0.130, 0.240,0.420,0.110, 0.100] Then, the P1 of “firm's economic activities” can be calculated using Eq. (13). The P2 and P3 membership function were calculated following a similar method. Then, the MC was obtained using Eq. (14). The weights of the CS perspectives for the risk groups are shown in Table 6. The perspectives contain 6 aspects weights, which are determined from the exploratory factor analysis. The weights assigned to the “firm's economic activities” perspective were obtained using Eq. (15). wgjP1 = (∑i = 13P1)j/∑j = 16(∑i = 1kP1)j =8.66/68.842 = 0.126 wgjP2 = (∑i = 13P2)j/∑j = 16(∑i = 1kP2)j =9.81/69.578 = 0.141 wgjP3 = (∑i = 13P3)j/∑j = 16(∑i = 1kP3)j =10.010/67.122 = 0.149 Table 7 presents the overall CS perspective weights, which are used to assess the entire CS weight in level 3. The entire P1 membership function is obtained by computing the fuzzy composition of the weight vector and the assessment matrix using Eq. (16). The top 3 aspects are the firm's economic activities (As1), stakeholder management (As2) and operational control (As4)
2.713 2.868 3.005 3.258 2.883 3.172 0.000 2.891 2.625 2.957 2.954 2.427 3.119 2.644 2.944 2.685 2.774 2.866 2.574 2.710 2.522 3.031 3.189 3.193 3.516 2.833 0.000 3.287 3.017 2.689 3.413 3.023 2.711 3.231 2.710 3.164 2.732 3.397 3.187 3.081 2.996 2.965 2.949 3.200 3.259 3.439 0.000 4.122 3.541 3.640 3.700 3.773 3.367 2.685 3.339 3.264 3.413 3.090 3.014 3.109 2.715 3.035 2.882
k
∑i =1
(RgP1 )1 ∗ 5 = (WViP1 )1 ∗ 3 (EMiP1 )3 ∗ 5=
2.973 3.108 3.814 0.000 2.851 3.158 3.445 3.250 3.131 3.398 3.280 3.015 3.741 2.956 3.345 3.258 3.200 3.707 2.977 3.154 2.965
C6 C5
=
x
P1 wvAsm x i=1
∑
2.825 3.124 0.000 3.356 3.196 3.354 3.228 3.538 3.284 3.288 3.400 3.257 3.596 3.440 3.224 3.151 3.294 3.157 2.895 2.963 2.791
P1 mrAllj
MRjjP1
⎡ 2.810 ⎤ ⎢ 1.365 ⎥ 0.822 ⎥ =⎢ x ⎢ 0.937 ⎥ ⎢ 0.777 ⎥ ⎢ 0.894 ⎥ ⎦ ⎣
⎡ 0.130 0.240 0.420 0.110 0.100 ⎢ 0.070 0.084 0.172 0.089 0.051 ⎢ 0.000 0.059 0.091 0.047 0.049 ⎢ 0.000 0.055 0.092 0.029 0.087 ⎢ 0.002 0.044 0.090 0.060 0.035 ⎢ 0.034 0.024 0.073 0.063 0.068 ⎣
⎤ ⎥ ⎥ ⎥ ⎥ ⎥ ⎦
0.000 3.247 2.870 2.930 3.360 3.350 3.300 3.570 3.430 3.710 3.560 3.740 3.080 3.040 3.358 3.230 3.510 3.410 3.764 2.900 2.940
3.141 0.000 3.681 3.669 3.591 3.869 3.346 3.529 3.635 3.687 3.922 3.158 3.600 3.178 3.448 3.431 3.536 3.375 3.273 3.093 3.081
=[0.0365, 0.0674, 1.180, 0.309, 0.281] mrAlljP2 = [1.678, 0.000, 0.204,0.245,0.134] mrAlljP3 = [0.005, 0.011, 0.012,0.011,0.007] Then, the overall perspective values were calculated using Eq. (17) P1 All = 7.896; P2 All = 3.939; P3 All = 0.141 Finally, the overall MC was obtained using Eq. (18)
C1 C2 C3 C4 C5 C6 C7 C8 C9 C10 C11 C12 C13 C14 C15 C16 C17 C18 C19 C20 C21
C4 C3 C2 C1
Table 4 The total DEMATEL relation matrix of criteria.
C7
C8
C9
C10
C11
C12
C13
obtained using Eqs. (11)–(12):
MCAll = 7
n
(P1All∗P 2All∗P 3All ) =
3
7.896∗3.939∗0.141 = 1.637
Technological Forecasting & Social Change xxx (xxxx) xxx–xxx
M.-L. Tseng et al.
Fig. 1. Causal effect on CS.
performance. If a resource exhibits the necessary attributes, then can enable the firm to sustain competitive advantage. However, to determines these key capabilities remains an issue for firms (Barrutia and Echebarria, 2015; Cui et al., 2017; Rothaermel, 2001). In lieu of this theory, this study composed a set of attributes for assessing the CS TBL perspectives. In the CS principle, TBL examines the business functions while addressing the profitability and stakeholder concerns, establishing a closer voluntary deliberation between corporate value creation and environmental concerns (Tseng et al., 2008; Fuisz-Kehrbach, 2014; Waligo et al., 2013). This study agrees with the finding of Tseng (2017) that firms are focused on both economic and environmental activities but that few firms address social responsibility. This result perhaps occurs because manufacturing firms focus on building the manufacturing capabilities and following the customer
The economic perspective (P1) is 7.896, the environmental perspective (P2) is 3.939 and the social responsibility perspective is 0.141. The overall MC of the CS performance in the Taiwanese textile was considered low (1.637). Therefore, there is still room for improvement. 5. Implications This section discusses the theoretical implications of the RBV and the professional and managerial implications of the results for the textile industry. 5.1. Theoretical implications The RBV seeks the resources needed to achieve superior firm Table 6 CS perspectives and aspects weights. P1
As1
As2 As3
As4
As5
As6
C1 C2 C3 C4 C5 C6 C7 C8 C9 C10 C11 C12 C13 C14 C15 C16 C17 C18 C19 C20 C21
P2
P3
Value
Sum
Factor weight
Group weight
Value
Sum
Factor weight
Group weight
Value
Sum
Factor weight
Group weight
2.810 2.980 2.870 2.930 3.360 3.350 3.300 3.570 3.430 3.710 3.560 3.740 3.080 3.040 3.358 3.230 3.510 3.410 3.764 2.900 2.940
8.660
0.324 0.344 0.331 0.466 0.534 0.245 0.242 0.262 0.251 0.263 0.253 0.265 0.219 0.231 0.256 0.246 0.267 0.262 0.289 0.223 0.226
0.126
2.880 3.380 3.550 3.530 3.360 3.350 3.300 3.570 3.430 3.710 3.560 3.740 3.080 3.040 3.358 3.020 2.960 3.390 3.370 3.040 2.960
9.810
0.294 0.345 0.362 0.512 0.488 0.245 0.242 0.262 0.251 0.263 0.253 0.265 0.219 0.246 0.271 0.244 0.239 0.266 0.264 0.238 0.232
0.141
3.080 3.380 3.550 3.530 3.320 2.900 3.160 2.970 3.430 2.920 3.390 3.520 3.080 2.744 3.358 3.030 3.000 3.390 3.370 3.040 2.960
10.010
0.308 0.338 0.355 0.515 0.485 0.233 0.254 0.238 0.275 0.226 0.263 0.273 0.239 0.226 0.277 0.250 0.247 0.266 0.264 0.238 0.232
0.149
6.290 13.650
14.090
13.138
13.014
0.091 0.198
0.205
0.191
0.189
6.890 13.650
14.090
12.378
12.760
Factor weight (P1) times membership function (P1).
8
0.099 0.196
0.203
0.178
0.183
6.850 12.460
12.910
12.132
12.760
0.102 0.186
0.192
0.181
0.190
Technological Forecasting & Social Change xxx (xxxx) xxx–xxx
0.940 0.632 0.501 0.561 0.472 0.535 0.031 0.000 0.012 0.034 0.034 0.000
1 2 5 3 6 4
requirements to produce green products as the retail channels demand more green products. This suggestion is in agreement with the sustainable supply chain management model, which states that the TBL must consider and develop the entire supply chain for sustainable development (Lin and Tseng, 2016; Tseng et al., 2015; Shi et al., 2017). Moreover, textile firms may seek to address environmental health and safety in order to take responsibility for environmental protection, to provide safe working conditions for job-related health and safety, to regulate and identify workplace hazards, and to reduce accidents and exposure to harmful conditions and materials. In addition, the target of RBV can achieve competitive advantage through management capabilities (Shi et al., 2017; Lin et al., 2011). This study determined the causal effect attributes and ranked them based on managerial and professional viewpoints. Furthermore, the results show that the overall CS performance is low. Therefore, the attributes could help the industry to improve their CS performance.
0.077 0.093 0.065 0.045 0.052 0.072
0.083 0.191 0.094 0.079 0.079 0.074
0.071 0.098 0.058 0.041 0.059 0.064
0.046 0.134 0.003 0.027 0.002 0.056
MC Membership function
Rank
M.-L. Tseng et al.
0.149 0.102 0.186 0.192 0.181 0.190
Weight Weight
The CS performance ranking is as follows: 1. economic perspective; 2. environmental perspective; and 3. social responsibility perspective. Moreover, the overall CS industrial assessment is low for this industry. This study also determined the ranking of the aspects and criteria. The top 3 aspects are as follows: 1. firm's economic activities; 2. stakeholder management; and 3. operational control. The top 5 criteria are as follows: 1. manager attitude and behavior; 2. eco-operational process; 3. legal compliance; 4. strategic nature; and 5. eco-product and service design. Additionally, the causal effect criteria are the following: 1. cost reduction; 2. stakeholder relations; 3. environmental performance; 4. green manufacturing; and 5. talent attraction and retention. The attitude and behavior of a well-informed manager can easily and efficiently attract and inspire teams by searching the primary resources for talent attraction and retention in a specific field. A strategic management must prepare to adopt CS. However, this preparation does not mean that the management foresees a future trend; instead, the management is aiming to avoid risks via planning, organizing, managing and controlling. Effective management acquires the necessary strategic abilities that help managers to formulate objectives, set an action plan and direct the team towards business fulfillment. The attitude and behavior of managers also shapes the entrepreneurial attitude for discovering new ideas and processes in the business domain. In summary, the industry is focused on building closer relationships in the supply chain and enhancing their competitive advantage. Specifically, a stakeholder is related to the supply chain network. Therefore, effective stakeholder management generates positive relationships with stakeholders through proper management of their expectations. To integrate these attributes together, a strategic firm needs to be well structured to identify the resources that can help sort out process control, cost reduction, eco-product design and eco-operational processes for current problems and to prevent future problems.
0.103 0.190 0.091 0.071 0.086 0.074 0.000 0.092 0.059 0.050 0.039 0.072 0.846 0.000 0.000 0.000 0.032 0.000 2.810 1.365 0.822 0.937 0.777 0.894 As1 As2 As3 As4 As5 As6
6. Conclusions
Weight value (As) times membership functions (P1).
0.420 0.172 0.091 0.092 0.090 0.073 0.240 0.084 0.059 0.055 0.044 0.024 0.130 0.070 0.000 0.000 0.002 0.034
Membership function Value Weight
P1
Table 7 CS perspectives and aspects overall weights.
0.110 0.089 0.047 0.029 0.060 0.063
0.100 0.051 0.049 0.087 0.035 0.068
1.985 1.809 0.822 0.977 0.747 0.901
Value
Membership function
0.123 0.097 0.047 0.047 0.064 0.064
0.068 0.133 0.049 0.095 0.025 0.056
P3 P2
Value
5.2. Managerial implications
CS has received extensive attention in recent years, but the existing literature lacks a full analysis of the hierarchical framework. In addition to addressing the TBL issues, the causal effects need to be better understood, as previous studies lacked systematic analysis. This study determined the causal criteria that led to a low overall CS weight for the Taiwanese textile industry. In this case, the causal criteria are cost reduction, stakeholder relations, environmental performance, green manufacturing and talent attraction and retention. Thus, this study assists in understanding a firm's CS attributes by constructing an evaluation hierarchical framework and proposing an analysis method based on expert opinions. The contribution of this study is providing a valid and reliable hierarchical framework that can be applied to complex 9
Technological Forecasting & Social Change xxx (xxxx) xxx–xxx
M.-L. Tseng et al.
Epstein, M.J., Buhovac, A.R., 2010. Solving the sustainability implementation challenge. Organ. Dyn. 39, 306–315. Fuisz-Kehrbach, S., 2014. A three-dimensional framework to explore corporate sustainability activities in the mining industry: current status and challenges ahead. Res. Policy (Article in press). Grewatsch, S., Kleindienst, I., 2017. How organizational cognitive frames affect organizational capabilities: The context of corporate sustainability. Long Range Plan (In Press). Hahn, R., 2013. ISO 26000 and the standardization of strategic management processes for sustainability and corporate social responsibility. Bus. Strateg. Environ. 22 (7), 442–455. Handfield, R., Walton, S., Seegers, L., Melnyk, S., 1997. Green value chain practices in the furniture industry. J. Oper. Manag. 12, 38–53. Hart, S.L., Dowell, G., 2010. A natural resource-based view of the firm: fifteen years after. J. Manag. 37, 1464–1479. Joshi, S., Li, Y., 2016. What is corporate sustainability and how do firms practice it? A management accounting research perspective. J. Manag. Account. Res. 28 (2), 1–11. Journeault, M., 2016a. The influence of the eco-control package on environmental and economic performance: a natural resource-based approach. J. Manag. Account. Res. 28 (2), 149–178. Journeault, M., 2016b. The influence of the eco-control package on environmental and economic performance: a natural resource-based approach. J. Manag. Account. Res. 28 (2), 149–178. Klettner, A., Clarke, T., Boersma, T.M., 2014. The governance of corporate sustainability: empirical insights into the development, leadership and implementation of responsible business strategy. J. Bus. Ethics 122, 145–165. Klewitz, J., Hansen, E.G., 2014. Sustainability-oriented innovation of SMEs: a systematic review. J. Clean. Prod. 65, 57–75. Lin, Y.H., Tseng, M.L., 2016. Assessing the competitive priorities within sustainable supply chain management under uncertainty. J. Clean. Prod. 112 (3), 2133–2144. Lin, Y.H., Tseng, M.L., Chen, C.C., Chiu, A.S.F., 2011. Positioning strategic competitiveness of green business innovation capabilities using hybrid method. Expert Syst. Appl. 38 (3), 1839–1849. Lozano, R., 2008. Envisioning sustainability three-dimensionally. J. Clean. Prod. 16, 1838–1846. Lozano, R., 2012. Towards better embedding sustainability into companies systems: an analysis of voluntary corporate initiatives. J. Clean. Prod. 25, 14–26. Lozano, R., 2015. A holistic perspective on corporate sustainability drivers. Corp. Soc. Responsib. Environ. Manag. 22, 32–44. Maon, F., Lindgreen, A., Swaen, V., 2008. Thinking of the organization as a system: the role of managerial perceptions in developing a corporate social responsibility strategic agenda. Syst. Res. Behav. Sci. 25, 413–426. Porter, M.E., Kramer, M.R., 2002. The competitive advantage of corporate philanthropy. Harv. Bus. Rev. 80, 56–69. Rothaermel, F.T., 2001. Incumbent's advantage through exploiting complementary assets via inter firm cooperation. Strateg. Manag. J. 22 (6–7), 687–700. Shi, L., Wu, K.J., Tseng, M.L., 2017. Improving corporate sustainable development: using an interdependence hierarchical model. Resour. Conserv. Recycl. 119, 24–35. Siebenhüner, B., Arnold, M., 2007. Organizational learning to manage sustainable development. Bus. Strateg. Environ. 16, 339–353. Stead, J.G., Stead, W.E., 2013. The coevolution of sustainable strategic management in the global marketplace. Organization Environment 26, 162–183. Su, C.M., Horng, D.J., Tseng, M.L., Chiu, A.S.F., Wu, K.J., Chen, H.P., 2015. Improving sustainable supply chain management using a novel hierarchical Grey-DEMATEL approach. J. Clean. Prod. 134, 469–481. Tseng, M.L., 2017. Using social media and qualitative and quantitative information scales to benchmark corporate sustainability. J. Clean. Prod. 142, 727–738. Tseng, M.L., Wu, W.W., Lin, Y.H., Liao, C.H., 2008. An exploration of relationships between environmental practice and manufacturing performance using the PLS path modeling. WSEAS transactions on environment & development 4 (6), 487–502. Tseng, M.L., Lim, K.M., Wong, W.P., 2015. Sustainable supply chain management: a closed-loop network approach. Ind. Manag. Data Syst. 115 (3), 436–461. Van Bommel, H.W.M., 2011. A conceptual framework for analyzing sustainability strategies in industrial supply networks from an innovation perspective. J. Clean. Prod. 19, 895–904. Vesely, S., Klöckner, C.A., Dohnal, M., 2016. Predicting recycling behaviour: comparison of a linear regression model and a fuzzy logic model. Waste Manag. 49, 530–536. Vildåsen, S.S., Keitsch, M., Fet, A.M., 2017. Clarifying the epistemology of corporate sustainability. Ecol. Econ. 138, 40–46. Waddock, S.A., Samuel, B.G., 1997. The corporate social performance- financial performance link. Strateg. Manag. J. 18, 303–319. Waligo, V.M., Clarke, J., Hawkins, R., 2013. Implementing sustainable tourism: a multistakeholder involvement management framework. Tour. Manag. 36, 342–353. Wijethilake, C., 2017. Proactive sustainability strategy and corporate sustainability performance: the mediating effect of sustainability control systems. J. Environ. Manag. 196, 569–582. Wijethilake, C., Munir, R., Ppuhami, R., 2016. Environmental innovation strategy and organizational performance: enabling and controlling uses of management control systems. J. Bus. Ethics (in press). Witjes, S., Vermeulen, W.J.V.J., Cramer, A.M., 2017. Exploring corporate sustainability integration into business activities. Experiences from 18 small and medium sized enterprises in the Netherlands. J. Clean. Prod. 153, 528–538.
interrelationships. This study improved the traditional FSM and applied the DEMATEL to find the causal attributes that explain the low CS rating in the Taiwanese textile industry. In addition, previous studies were unclear on how to construct the hierarchical framework; therefore, this study uses the RBV theory as the basic foundation for understanding a firm's resources and capability trade off (Lin and Tseng, 2016). This study uses the RBV theory to address the CS, provide valid and reliable measures and propose a hybrid method for complicated situations. In traditional practice, a firm's economic activities, stakeholder management and operational control are prioritized. The results of this study suggest that future research should focus more on the social responsibility issues to better understand how firms can balance all of the proposed aspects. The results show that the overall CS weight for the Taiwanese textile industry is low. Using the TBL, the economic perspective weight is very high, and the environmental perspective weight is medium. Environmental sustainability, which includes eco-friendly materials and energy-saving and recyclable apparel, is a mutual goal in the industry that is common deliberated. When considering the social responsibility of international retail channels, the channels are all moving towards more sustainable textile products. In this industry, internationally esteemed, successful professionals are developing the latest eco-friendly technologies and certification regulations with local manufactures (Tseng et al. 2015; Lin and Tseng, 2016). The likely reason for the low social responsibility perspective is the long working hours in this labor intensive industry. To conclude, a valid and reliable hierarchical framework and limitations are essential for assessing CS. The proposed RBV theory should incorporate resources and consider capability conditions, relevant operation processes, and the desired performance improvement (Tseng et al., 2008). In certain cases, the proposed hierarchical framework should include additional measures. Additionally, this proposed framework should also be tested in empirical studies. Future studies could perform a data-driven analysis to test this hierarchical framework or conduct a longitudinal study on whether CS improves over time. Additionally, future studies could further analyze case studies, which are useful to practitioners. References Amini, M., Bienstock, C.C., 2014. Corporate sustainability: an integrative definition and framework to evaluate corporate practice and guide academic research. J. Clean. Prod. 76, 12–19. Azapagic, A., 2003. Systems approach to corporate sustainability. Process. Saf. Environ. Prot. 81, 303e316. Barrutia, J.M., Echebarria, C., 2015. Resource based view of sustainability engagement. Glob. Environ. Chang. 34, 70–82. Baumgartner, R.J., Ebner, D., 2010. Corporate sustainability strategies: sustainability profiles and maturity levels. Sustain. Dev. 18, 76–89. Bonn, I., Fisher, J., 2011. Sustainability: the missing ingredient in strategy. J. Bus. Strateg. 32, 5–14. Brockhaus, S., Fawcett, S.E., Knemeyer, A.M., Fawcett, A.M., 2017. Motivations for environmental and social consciousness: reevaluating the sustainability based view. J. Clean. Prod. 143, 933–947. Bryson, J.M., Ackermann, F., Eden, C., 2007. Putting the resource-based view of strategy and distinctive competencies to work in public organizations. Public Adm. Rev. 67 (4), 702–717. Cheng, C.C., Shiu, E.C., 2012. Validation of a proposed instrument for measuring ecoinnovation: an implementation perspective. Technovation 32, 329–344. Cui, L., Wu, K.J., Tseng, M.L., 2017. Exploring a novel agricultural subsidy model with sustainable development: a benchmark Chinese agribusiness in Liaoning. Sustain. For. 9 (1), 19. Dočekalová, M.P., Doubravský, K., Dohnal, M., Kocmanová, A., 2017. Evaluations of corporate sustainability indicators based on fuzzy similarity graphs. Ecol. Indic. 78, 108–114. Elkington, J., 1998. Cannibals with Forks: The Triple Bottom Line of 21st Century Business, Conscientious Commerce. New Society Publishers, Gabriola Island (http:// doi.wiley.com/10.1002/tqem.3310080106). Engert, S., Romana Rauter, R., Baumgartner, R.J., 2016. Exploring the integration of corporate sustainability into strategic management: a literature review. J. Clean. Prod. 112, 2833–2850.
10