International Journal of Innovative Computing, Information and Control Volume 8, Number 8, August 2012
c ICIC International 2012 ISSN 1349-4198 pp. 5559–5571
A HYBRID RECURRENT NEURAL NETWORKS MODEL BASED ON SYNTHESIS FEATURES TO FORECAST THE TAIWAN STOCK MARKET Liang-Ying Wei1,∗ and Ching-Hsue Cheng2 1
Department of Information Management Yuanpei University No. 306, Yuanpei Street, Hsin Chu 30015, Taiwan ∗ Corresponding author:
[email protected] 2 National Yunlin University of Science and Technology No. 123, Section 3, University Road, Touliu, Yunlin 640, Taiwan
[email protected]
Received May 2011; revised October 2011 Abstract. Recently, many academy researchers have proposed several forecasting models by technical analysis to forecast stocks, such as (Yamawaki & Tokuoka 2007) [1]. The traditional approach uses a linear time series model for stock forecasting. However, the results would be in doubt when the forecasting problems are nonlinear. Multifeature data from financial statements usually produce high-dimensional data, and therefore, the proposed model utilizes synthesis feature selection for reducing the number of dimensions. The proposed hybrid model utilizes synthesis feature selection to optimize the recurrent network (RNN) for predicting stock price trends. Three refined processes are proposed in the hybrid model for forecasting: (1) select essential technical indicators from popular indicators by a correlation matrix; (2) use stepwise regression and a decision tree to reduce features; and (3) utilize a recurrent neural network (Elman neural network) to build a forecasting model. A six-year period of the Taiwan stock exchange capitalization weighted stock index (TAIEX) is employed as a verification database to evaluate the proposed model under a performance indicator, root mean squared error (RMSE). The results show that the proposed model is superior to the listing models. Keywords: Synthesis feature, Recurrent neural network, Technical indicators
1. Introduction. In the stock market, the technical analysis method has the ability to forecast the future price direction by studying past market data – primarily stock price and volume. The technical analysis method has assumed that stock price and volume are the two most relevant factors in determining the future direction and behavior of a particular stock or market, and the technical indicators, coming from the mathematic formula based on stock price and volume, can be applied to predict the future price fluctuation and also provide for investors to determine the timing of buying or selling the stocks [2]. For stock analysts and fund managers, using technical indicators to analyze the stock market is a practical way. It is hard to apply this technique for common investors, because there are too many technical indicators to be considered as forecasting factors, and most popular indicators are usually not understandable. Therefore, for those stock market investors who utilize technical indicators to predict market fluctuations, how to select useful technical indicators to forecast stock price trends accurately is the key issue to making a profit. 5559
5560
L.-Y. WEI AND C.-H. CHENG
In past research, many time series models were advanced by financial researchers to model stock markets based on historical stock data, such as the autoregressive conditional heteroscedasticity (ARCH) model by (Engle 1982) [3], ARCH (GARCH) model by (Bollerslev 1986) [4], autoregressive moving average (ARMA) model, and the autoregressive integrated moving average model (ARIMA) by (Box and Jenkins 1976) [5]. However, the traditional time series requires more historical data, along with some assumptions, like normality postulates. In the evolution of time series models, many researchers have applied data-mining techniques in financial analysis [6-9]. Zadeh [10] applied soft computing algorithms in time series models for financial forecasting. Kinoto et al. [11] developed a prediction system for stock markets by using neural networks. Huarng and Yu [12] applied a backpropagation neural network to establish fuzzy relationships in fuzzy time series for forecasting stock price. Roh [13] has integrated a neural network and time series model for forecasting the volatility of a stock price index. Further, the multilayer perceptron (MLP) neural network is used widely in forecasting systems. However, MLP neural networks cannot restore the memory of past events, and it takes a long time to train an MLP neural network because of its nonlinear mapping of global approximation. In practice, investors would consider more than one financial attribute to forecast stock price. However, multiattribute data usually produce high-dimensional data and increase computational complexity. After reviewing the past models, three major drawbacks are found: (1) stock market analysts and fund managers apply various technical indicators to forecast stock markets based on personal experience, which might give wrong judgments on market signals; (2) multifeature data from financial statements usually produce high-dimensional data; and (3) for some statistical models, specific assumptions are required for observations, and those models cannot be applied to the datasets that do not follow the statistical assumptions. To improve the past forecasting models, this paper proposes a hybrid forecasting model to refine past models in stock price forecasting. The proposed model utilizes technical indicators as forecasting variables. To overcome the problem, multifeature data usually produce high-dimensional data and increase computational complexity; therefore, stepwise regression and decision trees are utilized by the model proposed in this work to synthesize features to reduce the number of dimensions in the data. Further, recurrent neural networks (Elman neural networks (Elman NN) have time series prediction capabilities, as well as local recurrent connections, which can overcome the limitations of statistical methods. Further, in the case of the comparison with other types of multilayered networks, the most important advantage of Elman’s network is a robust feature extraction ability, which provides feedback connections from the hidden layer to a context layer [14]. Three main processes are provided in the model, as follows: (1) select essential technical indicators from popular indicators with a “correlation matrix”; (2) reduce features by stepwise regression and a decision tree; and (3) utilize a recurrent neural network (Elman NN method) to build a forecasting model by weighted technical indicators. This rest of the paper is organized as follows. Section 2 presents a review of the related studies, while Section 3 introduces the proposed model. Section 4 presents a verification of the model and comparisons with other approaches. Section 5 is the findings from the experimental results. Finally, the conclusions of the study are given in Section 6.
2. Preliminaries. In this section, the related literature on technical analysis, stepwise regression, decision trees, and the Elman network is briefly reviewed.
A HYBRID RECURRENT NEURAL NETWORKS MODEL
5561
2.1. Technical analysis. Technical analysis is an attempt to predict future stock price movements by analyzing the past sequence of stock prices (Pring 1991) [15], and it relies on charts and looks for particular configurations that are supposed to have predictive value. Analysts focus on the investor psychology and investor response to certain price formation and price movements. The price at which investors are willing to buy or sell depends on personal expectation. If investors expect the security price to rise, they will buy it; if investors expect the security price to fall, they will sell it. These simple statements are the cause for a major challenge in setting security prices, because they refer to human expectations and attitudes (Pring 1991) [15]. As some people say, securities never sell for what they are worth but for what people think they are worth. It is very important to understand that market participants anticipate future development and take action now and that their action drives the price movement. Since stock market processes are highly nonlinear, many researchers have been focusing on technical analysis to improve the investment return [16-18]. 2.2. Stepwise regression. Stepwise regression is a popular and extremely effective method for establishing regression models. The most widespread stepwise regression process works as follows. In statistics, stepwise regression includes regression models in which the choice of predictive variables is carried out by an automatic procedure [19]. The user first identifies the response, y, and the set of potentially important independent variables, x1 , x2 , . . ., xk , where k is generally large. The response and independent variables are then entered into the regression process (the stepwise process begins) [20]. The algorithm of stepwise regression constructs the model via a series of iterations. Each iteration involves one of two processes – namely either adding a variable to the model (referred to here as the selection process) or removing a variable from the model (elimination). The process of stepwise regression involves these steps as follows: 1. Consider all possible regressions using one explanatory variable. Select the variable with the largest t-ratio. If the t-ratio is not significant, then do not select any variables, and halt the process. 2. The next variable to enter is the one that makes the most significant contribution. To enter, the t-ratio must exceed a specified t-value. 3. Next, delete the variable that makes the smallest contribution. The deleted t-ratio must be below a specified t-value. 4. Repeat steps 2 and 3 until all possible additions and deletions have been performed. When only one variable is being considered, recall that (t − ratio)2 = F − ratio. 2.3. Decision tree. Artificial intelligence induction methods offer an alternative knowledge acquisition approach for business applications. The simplest one of these is a decision tree, which is based on a collection of rules. A decision tree has both branch and the leaf nodes. Each branch node represents a choice between a number of alternatives, and each leaf node represents a classification or decision [21,22]. At the first step of making a decision tree, an attribute is selected on which to branch; An entropy measure is used to decide on which attributes to branch. The C4.5 approach builds decision trees from a set of training data, using the concept of information entropy. C4.5 uses the fact that each attribute of the data can be used to make a decision that splits the data into smaller subsets. C4.5 examines the normalized information gain (i.e., the difference in entropy) that results from choosing an attribute for splitting the data. The attribute with the highest normalized information gain is the one that is used to make the decision. The algorithm then recurs on the smaller sublist. Entropy(S) can be thought of as a measure of how random the class distribution is in S, while information gain is the gain that comes from entropy. Information gain is then normalized by multiplying
5562
L.-Y. WEI AND C.-H. CHENG
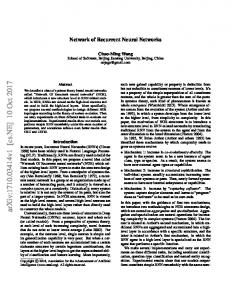
Figure 1. The Elman network the entropy of each attribute choice by the proportion of attribute values that have that choice [23]. 2.4. The Elman network. As is well known, a recurrent network (RNN) has some advantages, such as having time series and nonlinear prediction capabilities, faster convergence, and more accurate mapping ability. The Elman NN is a single recursive network that has a context layer as an inside, self-referenced layer (see Figure 1). Both current input from the input layer and the previous state of the hidden layer that is saved in the context layer activate the hidden layer during operation. There exists an energy function that is associated with the hidden layer, context layer, and input layer [24,25]. In training, the connection weights can load the temporal relations in the training word sequences. The context layer carries the memory. The hidden layer activates the output layer and refreshes the context layer with the current state of the hidden layer. The backpropagation learning algorithm [26] is commonly employed to train the weights in order to reduce the difference between the output of the output layer and its desired output. Let Lo , Lh , Lc , and Li be the number of neurons in the output layer, the hidden layer, the context layer, and the input layer, respectively. In the Elman NN, Lh is equal to Lc , that is, Lh = Lc . In this paper, the number of neurons in the input layer is equal to that in the output layer and is also equal to the number of total features – that is, R = Lo = Li . Let the three weight matrices between layers be Uoh , Uhc , and Uhi , where Uoh is an Lh by Lo matrix, Uhc is an Lc by Lh matrix, and Uhi is an Li by Lh matrix, as shown in Figure 1. The output vector of the hidden layer is denoted as H(w(t)) when w(t) is fed to the input layer. H(w(t)) is an Lh by 1 column vector with Lh elements. Let E(w(t + 1)) be the output vector of the output layer when w(t) is fed to the input layer. E(w(t + 1)) is an Lo by 1 column vector. The function of the network is H(w(t)) = ϕ(Uhi w(t) + Uhc H(w(t − 1)),
(1)
where ϕ is a sigmoid activation function that operates on each element of a vector (Rumelhart & McClelland, 1986) [26]. In Elman’s experiment, the first step is to update the weights Uhi , Uhc and Uoh through training. The second step is to encode words with a tree structure. All the attempts are aimed at minimizing the error between the network outputs and the desired outputs to satisfy the prediction w(t + 1) ≈ E (w(t + 1)) = ϕ (Uoh H(w(t))) .
(2)
3. Proposed Model. In this section, the research procedure and algorithms of the proposed model are described.
A HYBRID RECURRENT NEURAL NETWORKS MODEL
5563
3.1. Proposed concepts. As stated in the introduction section, there were major drawbacks in past forecasting models for stock markets: (1) subjective selection of technical indicators to forecast future stock price based on personal experience and judgment; (2) multifeature data from financial statements usually produce high-dimensional data; and (3) some prerequisite knowledge is needed for conventional statistical forecasting models, such as statistical probability distribution [27]. To reconcile these drawbacks above, feature selection is necessary to evaluate the usefulness of the features, select relevant features, and remove redundant and/or irrelevant features. Then, synthesis feature selection is utilized by the model proposed in this work to reduce data dimensions. Three important main advantages for feature selection are the following: (1) model simplification, (2) ease of interpretation, and (3) faster model induction and structural knowledge. The Elman NN has some advantages, such as time series prediction capabilities because of its memory nodes, as well as local recurrent connections, which can overcome the limitations of statistical methods (the data need to obey some mathematical distribution), faster convergence, and accurate mapping ability. Based on the advantages of feature selection and the Elman NN, this paper proposes a synthesized feature section to adapt the Elman NN, and then the optimal proposed model is built – i.e., there are three facets in the proposed model: (1) use a correlation matrix to filter useful forecasting variables from popular technical indicators; (2) synthesize selected features to reduce data dimensions by stepwise regression and decision tree; and (3) utilize a recurrent neural network (Elman NN method) to build a forecasting model. 3.2. Proposed algorithm. To enhance forecasting performance, this paper applies a correlation matrix to select forecasting factors (named “conditional features” in the proposed model), synthesize selected features by stepwise regression and decision tree as input features, and uses the Elman NN to optimize the forecast method to forecast the stock market. In practical operations, the procedure of the proposed model, as shown in Figure 2, can be briefly described in three parts, as follows: (1) Data preprocessing: The data are collected from the Taiwan Stock Exchange Corporation. Several popular technical indicators are generated from five fundamental quantities (opening price, the highest price, the lowest price, closing price, and trading volume). Then, a correlation matrix is employed to select the essential technical indicators. (2) Synthesize selected features and construct the Elman NN model: This block synthesizes selected features by stepwise regression and decision tree. The synthesized features are used for the inputs of the Elman NN model. To construct the model, we set the type of transfer function for the hidden layer and output layer and the number of neurons. We then use the Elman NN to forecast the TAIEX, and the parameters of Elman NN from the training dataset are tuned by a recursive network. (3) Forecast and evaluate performance: The Elman NN parameters of the forecasting model are determined when the stopping criterion is reached, and then the training forecasting model is used to forecast the TAIEX in the testing datasets. Finally, we use RMSE to evaluate the performance of the proposed model. The procedure of the proposed model is illustrated in Figure 2. To detail the proposed model, each step of the proposed algorithm is described as follows. Step 1: Collect experimental datasets In this step, a specific period of stock data including five daily fundamental variables (maximum price, minimum price, opening price, closing price, and stock trading volume), should be collected as experimental datasets. Each year, stock data are defined as subdatasets, the training data are from January to October, and the remaining period data is the testing data.
5564
L.-Y. WEI AND C.-H. CHENG
Figure 2. The procedure of proposed model Step 2: Transform data and select essential technical indicators From Kim et al. [28] and Richard and Julie [23], several popular technical indicators (moving average (MA), momentum (MTM), stochastic %K (%K), stochastic %D (%D), relative strength index (RSI), psychology line (PSY), Williams’ percent range (%R), volume ratio (VR), volume (Volume), and accumulative ratio (AR)) are generated from five fundamental quantities (opening price, the highest price, the lowest price, closing price, and trading volume). In the proposed model, the technical indicators are used as conditional variables, and the future stock index is used as the decision variable. In order to select the useful technical indicators that are highly related to the future stock index (defined as the price fluctuation at next day), a “correlation matrix” is employed as the feature selection method. The selection method employs Pearson correlation [29] with two-tailed tests to select useful technical analysis indicators from popular indicators. The
A HYBRID RECURRENT NEURAL NETWORKS MODEL
5565
Pearson’s correlation coefficient is usually signified by the symbol “r”. The statistical significance of “r” is tested with t-test. The hypotheses for the t-test are described as H0: r = 0 and H1: r 6= 0. If a lower p-value for the test (i.e., p 5 0.05) is generated, it means that there is confident evidence to reject the null hypothesis (H0) and accept the alternative hypothesis (H1). Step 3: Synthesize selected features by stepwise regression and decision tree A number of earlier studies suggested that fewer than six attributes can produce an efficient forecasting model [30-32]. In addition, since irrelevant and redundant features may degrade the performance of data-mining algorithms, this approach takes advantage of feature selection methods to evaluate the usefulness of features and eliminate irrelevant ones to simplify the proposed model. To remove most of these from the data, this step intersects the selected features by stepwise regression and decision tree to get the synthesized features. The independent features are TAIEX-related features (t), and the dependent feature (or class) is TAIEX (t + 1). Step 4: Train Elman NN forecast model In this step, the features that are selected by stepwise regression and decision tree from Step 3 are used as the input features to forecast TAIEX (t + 1). Then, we use one hidden layer hyperbolic tangent sigmoid transfer function (tansig) and set number of neurons from 1 to 30 and a single log sigmoid transfer function (logsig) output layer for the Elman NN model. For each training step, the error is backpropagated to find gradients of errors for each weight and bias. Step 5: Generate forecasts from the Elman NN forecast model The parameters for the Elman NN model are determined when the stopping criterion is reached from Step 4, and then the generated models are used to forecast the corresponding testing dataset. With the determined parameters, the forecast for the future stock index at time, t + 1, can be obtained by the forecasting model. Step 6: Performance evaluation Root mean square error (RMSE) is employed as a performance indicator for the proposed model, which is defined by Equation (3). v u∑ n u | actual stock index (t + 1) − forecast (t + 1)|2 t RMSE = t=1 (3) n where actual stock index (t + 1) denotes actual stock index at time t + 1, forecast (t + 1) denotes the prediction for the future stock index at time t + 1, and n denotes the total amount of forecasts. 4. Verification and Comparison. An empirical case study is provided in this section to illustrate the proposed model, and collected data are used as the experimental dataset to demonstrate the practicability of the proposed model. 4.1. Empirical case study. The steps of the TAIEX forecasting processes (such as transforming data, selecting essential technical indicators, calculating the aggregated value, training the Elman NN forecast model, and performance evaluation) by using a practical example (practical collected TAIEX dataset) are as follows: Step 1: Collect experimental datasets
5566
L.-Y. WEI AND C.-H. CHENG
In this step, experimental datasets are collected from 2000 to 2005, including five daily fundamental variables (maximum price, minimum price, opening price, closing price, and stock trading volume). Each year, stock data are defined as a subdataset; a 10-month period of the stock data, from January to October, is defined as training data, and the remaining period, from November and December, is used for testing. Step 2: Transform data and select essential technical indicators Ten popular technical indicators, MA, MTM, %K, %D, RSI, PSY, %R, VR, Volume, and AR, are generated from five fundamental quantities (opening price, the highest price, the lowest price, closing price, and trading volume). Table 1 lists the partial five fundamental quantities of the TAIEX, and Table 2 shows partial instances of technical indicators transformed from five fundamental quantities. In the proposed model, the technical indicators are used as conditional variables, and the future stock index is used as a decision variable. A “correlation matrix” is employed as a feature selection method in order to select the useful technical indicators that are highly related to the future stock index (defined as the price fluctuation at next day). For example, the future stock index is related with MA-5, MTM-5, %K-5, %D-5, RSI-5, PSY-5, %R-5, VR-5, volume, and AR-5 significantly (where “-5” denotes the aggregated value in 5 days) (the marker “∗∗ ” in the last column in Table 5) [33]. Table 1. The five partial fundamental quantities for the TAIEX of the year 2000 Date Opening Price Highest Price Lowest Price Closing Price 2000/01/04 8,644.91 8,803.61 8,642.50 8,756.55 2000/01/05 8,690.60 8,867.68 8,668.02 8,849.87 2000/01/06 8,876.59 9,023.99 8,863.91 8,922.03 .. .. .. .. .. . . . . . 2000/10/27 5,991.83 6,003.38 5,805.17 5,805.17 2000/10/30 5,644.26 5,666.96 5,615.90 5,659.08 2000/10/31 5,530.80 5,626.03 5,502.67 5,544.18
Volume 3,902,921 4,602,396 4,811,126 .. . 2,068,108 566,113 1,837,995
Table 2. The partial instances of technical indicators transformed from fundamental quantities Date 2000/01/04 2000/01/05 2000/01/06 .. . 2000/10/27 2000/10/30 2000/10/31
MA-5(t) RSI-5(t) K-5(t) D-5(t) R-5(t) PSY-5(t) AR-5(t) 8384.68 8537.95 8678.47 .. . 5874.07 5869.70 5794.81
100 100 100 .. . 65.98 48.45 17.98
96.46 97.64 98.42 .. . 66.88 44.58 29.72
88.16 91.32 93.68 .. . 67.65 59.96 49.88
0 0 0 .. . 63.76 100 100
1 1 1 .. . 0.6 0.4 0.2
3.72 4.81 4.86 .. . 1.30 1.46 1.13
TAIEX (t+1) 8,849.87 8,922.03 8,845.47 .. . 5,659.08 5,544.18 5,425.02
Step 3: Synthesize selected features by stepwise regression and decision tree In this step, the features collected from Step 2 are reduced by feature selection methods (stepwise regression and decision tree); then, the synthesized features are obtained from
A HYBRID RECURRENT NEURAL NETWORKS MODEL
5567
Table 3. The synthesized features by two feature selection methods Method Stepwise regression Decision tree
Selected features MA-5 , RSI-5 , %R-5 , AR-5 MA-5 , RSI-5 , %K-5, %D-5, %R-5 , PSY-5
intersecting the selected features by stepwise regression and decision tree. The synthesized features are shown in Table 3. According to Table 3, the three key features (MA-5, RSI-5, %R-5) are selected only as input features. Step 4: Train the Elman NN forecast model In this step, this paper sets epoch as 10,000, and error converges is 0.00001 for the training stopping criterion (the training model is executed for the predetermined fixed number (10,000) of iterations unless it terminates while the training error converges). We set one hidden layer hyperbolic tangent sigmoid transfer function (tansig), and the numbers of neurons are 1 to 30 and a single log sigmoid transfer function (logsig) output layer. For each training step, the error is backpropagated to find gradients of errors for each weight and bias. Step 5: Generate forecasts from the Elman NN forecast model When the stopping criterion is reach from Step 4, the parameters for the Elman NN model are determined. Then, we use the generated models to forecast the corresponding testing dataset. The forecast for the future stock index at time t + 1 can be obtained by the forecasting model with determined parameters. Step 6: Performance evaluation The RMSE calculation is undertaken using Equation (3); the calculated RMSE for the year 2000 is 98. Then, the model’s performance is examined using the RMSE criterion to compare it with those of other models. 4.2. Model verification. To verify proposed model, a 6-year period of the Taiwan Stock Exchange Capitalization Weighted Stock Index (TAIEX), from 2000 to 2005, is selected from Taiwan Stock Exchange Corporation (TWSE) (http://www.twse.com.tw/) [36]. A 1-year period of stock data is defined as one unit of the experimental dataset. A 10month period of the stock data, from January to October, is defined as training data, and the remaining period, from November and December, is used for testing (Chen 1996, Yu 2005). To examine the superiority of the proposed model, two fuzzy time series models, Chen’s (1996) [34] and Yu’s (2005) [35] models, are used as comparison models, and one conventional time series model is used (AR (1)) [3]. Furthermore, for judging whether the proposed model with synthesized features is superior to the Elman NN model (without feature selection), the performances of the Elman NN model (7 features) are compared with the proposed model (three features: MA-5, RSI-5, %R-5). The experimental results are listed in Table 4. From Table 4, it is shown that proposed model outperforms the listing models in RMSE. 5. Findings. From the results of the empirical case study, this study has yielded the following two findings: (1) Technical indicator as input feature According to Table 4, it is evidenced that the proposed model and Elman NN model, which uses technical indicators as input features, are superior to the fuzzy time series methods (Chen’s and Yu’s) and the AR (1) method in terms of RMSE. The main reason
5568
L.-Y. WEI AND C.-H. CHENG
Table 4. The performance comparisons for four forecasting models (TAIEX) Year 2000 2001 2002 2003 2004 2005 Chen’s model (1996) 176 148 101 74 83 66 Yu’s model (2005) 191 167 75 66 79 69 AR (1) 130 115 66 54 55 54 Elman NN model without feature 114 73 56∗ 51 57 57 selection (7 input features) Proposed model with feature 98∗ 72∗ 56∗ 45∗ 43∗ 32∗ selection (3 input features) Model
* The best performance among the five models
is that the two superior models take into account technical indicators as input features with recurrent network learning for TAIEX forecasting. (2) Synthesized features are key factors for forecasting stock From Table 4, it is shown that the performance of the proposed model is better than the Elman NN model without feature selection. It is evident that feature selection methods could select important features and reduce forecasting errors more effectively. 6. Conclusion. In the stock market, common investors use technical analysis to forecast the future price direction. There are too many technical indicators to be considered as forecasting factors, and most popular indicators are usually not understandable. Therefore, how to select useful technical indicators to forecast stock price trends accurately is the key issue to making a profit. Nevertheless, multifeature data usually produce high-dimensional data and increase computational complexity. In past research, many time series models have been applied to model stock markets based on historical stock data. However, the traditional time series require more historical data, along with some assumptions, like normality postulates. This paper has proposed a novel hybrid model, which employs technical indicators as forecasting factors and four methods (correlation matrix, stepwise regression, decision tree, and Elman NN) in forecasting processes, to promote prediction performance in the stock market. From the experimentation and forecasting results (Table 4), we can see that the proposed model outperforms the listing models numerically in RMSE. It can be explained that the technical indicators that are selected by the correlation matrix as forecasting features, which are highly related to the future stock index, can promote forecasting accuracy. Beside, feature selection methods (stepwise regression and decision tree) can efficiently reduce the number of data dimensions. By the recurrent network method (Elman NN), the proposed model has the main advantages, such as having time series and nonlinear prediction capabilities, faster convergence, and more accurate mapping ability. There are two suggested approaches to make further improvements to make your results less conservative and refine the proposed model to improve forecasting performance: (1) other technical indicator selection methods can be applied in he preprocessing phase to evaluate the performance variation; and (2) more data-mining methods, such as genetic algorithms, could be utilized to contrast their results with those from the proposed model.
MA-5
MA-5 MTM-5 %K-5 %D-5 RSI-5 PSY-5 %R-5 VR-5 Volume AR-5 Price fluctuation Pearson Correlation 1 .741(***) .753(***) .472(***) .797(***) .818(***) –.835(***) .676(***) 1.000(***) .251(***) .169(***) Sig. (2-tailed) .000 .000 .000 .000 .000 .000 .000 .000 .000 .009 MTM-5 Pearson Correlation .741(***) 1 .903(***) .714(***) .880(***) .889(***) –.713(***) .861(***) .741(***) .299(***) .112 Sig. (2-tailed) .000 .000 .000 .000 .000 .000 .000 .000 .000 .088 %K-5 Pearson Correlation .753(***) .903(***) 1 .860(***) .835(***) .836(***) –.781(***) .768(***) .753(***) .223(***) .133(**) Sig. (2-tailed) .000 .000 .000 .000 .000 .000 .000 .000 .001 .042 %D-5 Pearson Correlation .472(***) .714(***) .860(***) 1 .713(***) .705(***) –.424(***) .585(***) .472(***) .074 .134(**) Sig. (2-tailed) .000 .000 .000 .000 .000 .000 .000 .000 .260 .041 RSI-5 Pearson Correlation .797(***) .880(***) .835(***) .713(***) 1 .973(***) –.619(***) .791(***) .797(***) .232(***) .152(**) Sig. (2-tailed) .000 .000 .000 .000 .000 .000 .000 .000 .000 .020 PSY-5 Pearson Correlation .818(***) .889(***) .836(***) .705(***) .973(***) 1 –.627(***) .796(***) .818(***) .269(***) .128(**) Sig. (2-tailed) .000 .000 .000 .000 .000 .000 .000 .000 .000 .047 %R-5 Pearson Correlation –.835(***) –.713(***) –.781(***) –.424(***) –.619(***) –.627(***) 1 –.594(***) –.835(***) –.232(***) –.126(**) Sig. (2-tailed) .000 .000 .000 .000 .000 .000 .000 .000 .000 .049 VR-5 Pearson Correlation .676(***) .861(***) .768(***) .585(***) .791(***) .796(***) –.594(***) 1 .676(***) .367(***) .109 Sig. (2-tailed) .000 .000 .000 .000 .000 .000 .000 .000 .000 .097 Volume Pearson Correlation 1.000(***) .741(***) .753(***) .472(***) .797(***) .818(***) –.835(***) .676(***) 1 .251(***) .169(***) Sig. (2-tailed) .000 .000 .000 .000 .000 .000 .000 .000 .000 .009 AR-5 Pearson Correlation .251(***) .299(***) .223(***) .074 .232(***) .269(***) –.232(***) .367(***) .251(***) 1 .137(**) Sig. (2-tailed) .000 .000 .001 .260 .000 .000 .000 .000 .000 .035 Price fluctuation Pearson Correlation .169(***) .112 .133(**) .134(**) .152(**) .128(**) –.126(**) .109 .169(***) .137(**) 1 Sig. (2-tailed) .009 .088 .042 .041 .020 .047 .049 .097 .009 .035 Note 1: “**” denotes that correlation is significant at the 0.05 level using 2-tailed test and “***” denotes that correlation is significant at the 0.01 level. Note 2: MA-5 denotes that the value of the indicator is calculated using 5 periods of fundamental stock quantities (maximum price, minimum price, opening price, closing price, and stock trading volume) from present day to previous 4 day; and the values of other indicators (MTM-5, %K-5, %D-5, RSI-5, PSY-5, %R-5, VR-5 and AR-5) are produced in the same way.
Table 5. Correlations of technical indicators for TAIEX A HYBRID RECURRENT NEURAL NETWORKS MODEL 5569
5570
L.-Y. WEI AND C.-H. CHENG
REFERENCES
[1] M. Tanaka-Yamawaki and S. Tokuoka, Adaptive use of technical indicators for the prediction of intraday stock prices, Physica A: Statistical Mechanics and Its Applications, vol.383, no.1, pp.125-133, 2007. [2] S.-C. Chi, W.-L. Peng, P.-T. Wu and M.-W. Yu, The study on the relationship among technical indicators and the development of stock index prediction system, Proc. of the 22nd International Conference on Fuzzy Information Processing Society of the North American, pp.291-296, 2003. [3] R. F. Engle, Autoregressive conditional heteroscedasticity with estimator of the variance of United Kingdom inflation, Econometrica, vol.50, no.4, pp.987-1008, 1982. [4] T. Bollerslev, Generalized autoregressive conditional heteroscedasticity, Journal of Econometrics, vol.31, pp.307-327, 1986. [5] G. Box and G. Jenkins, Time Series Analysis: Forecasting and Control, Holden-Day, San Francisco, 1976. [6] S. I. Aihara, A. Bagchi and S. Saha, On parameter estimation of stochastic volatility models from stock data using particle filter-application to AEX index, International Journal of Innovative Computing, Information and Control, vol.5, no.1, pp.17-28, 2009. [7] J.-F. Chang and K.-L. Chen, Applying new investment satisfied capability index and particle swarm optimization to stock portfolio selection, ICIC Express Letters, vol.3, no.3(A), pp.349-354, 2009. [8] T. Takahama, S. Sakai, A. Hara and I. Noriyuki, Predicting stock price using neural networks optimized by differential evolution with degeneration, International Journal of Innovative Computing, Information and Control, vol.5, no.12(B), pp.5021-5032, 2009. [9] Y. Zhang and Y. Chen, Understanding the price fluctuations of stock markets through cellular automata, ICIC Express Letters, vol.3, no.3(A), pp.307-312, 2009. [10] L. A. Zadeh, Fuzzy logic, neural networks, and soft computing, Communications of the ACM, vol.37, no.3, pp.77-84, 1994. [11] T. Kimoto, K. Asakawa, M. Yoda and M. Takeoka, Stock market prediction system with modular neural network, Proc. of the International Joint Conference on Neural Networks, San Diego, CA, pp.1-6, 1990. [12] K. Huarng and H.-K. Yu, The application of neural networks to forecast fuzzy time series, Physica A, vol.363, pp.481-491, 2006. [13] T. H. Roh, Forecasting the volatility of stock price index, Expert Systems with Applications, vol.33, pp.916-922, 2007. [14] S. Seker, E. Ayaz and E. Turkcan, Elman’s recurrent neural network applications to condition monitoring in nuclear power plant and rotating machinery, Engineering Applications of Artificial Intelligence, vol.16, pp.647-656, 2003. [15] M. J. Pring, Technical Analysis, New York, 1991. [16] F. Allen and R. Karalainen, Using genetic algorithms to find technical trading rules, Journal of Financial Economics, vol.51, pp.245-271, 1999. [17] M. E. Azo, Neural Network Time Series Forecasting of Financial Markets, Wiley, New York, 1994. [18] L. William, P. Russell and M. R. James, Forecasting the NYSE composite index with technical analysis, pattern recognizer, neural network, and genetic algorithm: A case study in romantic decision support, Decision Support Systems, vol.32, pp.361-377, 2002. [19] N. R. Draper and H. Smith, Applied Regression Analysis, 2nd Edition, John Wiley & Sons, New York, 1981. [20] J. T. McClave, P. G. Benson and T. Sincich, Statistics for Business and Economics, 9th Edition, Prentice Hall, 2005. [21] J. R. Quinlan, Programs for Machine Learning, Morgan Kaufmann, 1993. [22] J. R. Quinlan, Improved use of continuous attributes in C4.5, Arxiv preprint cs.AI/9603103, 1996. [23] J. B. Richard and R. D. Julie, Technical Market Indicators: Analysis & Performance, John Wiley, New York, 1999. [24] C.-Y. Liou, Backbone structure of hairy memory, Proc. of the 16th International Conference on Artificial Neural Networks, LNCS, vol.4131, pp.688-697, 2006. [25] C.-Y. Liou and S.-L. Lin, Finite memory loading in hairy neurons, Natural Computing, vol.5, no.1, pp.15-42, 2006. [26] D. E. Rumelhart and J. L. McClelland, Parallel Distributed Processing: Explorations in the Microstructure of Cognition: Foundations, MIT Press, Cambridge, MA, 1986.
A HYBRID RECURRENT NEURAL NETWORKS MODEL
5571
[27] A.-P. Chen, Y.-C. Chen and W.-C. Tseng, Applying extending classifier system to develop an optionoperation suggestion model of intraday trading-an example of Taiwan index option, Lecture Notes in AI, pp.27-33, 2005. [28] M.-J. Kim, S.-H. Min and I. Han, An evolutionary approach to the combination of multiple classifiers to predict a stock price index, Expert Systems with Applications, vol.31, pp.241-247, 2006. [29] F. E. Croxton, D. J. Cowden and S. Klein, Applied General Statistics, 1899. [30] N. Jegadeesh and S. Titman, Returns to buying winners and selling losers: Implications for stock market efficiency, Journal of Finance, pp.65-91, 1993. [31] R. Schapire and Y. Freund, A decision theoretic generalization of on-line learning and an application to boosting, J Comput. Syst. Sci., vol.55, pp.119-139, 1997. [32] Z.-L. Sun, K.-F. Au and T.-M. Choi, A neuro-fuzzy inference system through integration of fuzzy logic and extreme learning machines, IEEE Trans. on Systems, Men, and Cybernetices, vol.37, pp.1321-1331, 2007. [33] C.-H. Cheng, T.-L. Chen and L.-Y. Wei, A hybrid model based on rough sets theory and genetic algorithms for stock price forecasting, Information Science, vol.180, no.9, pp.1610-1629, 2010. [34] S.-M. Chen, Forecasting enrollments based on fuzzy time-series, Fuzzy Sets Systems, vol.81, pp.311319, 1996. [35] H. K. Yu, Weighted fuzzy time-series models for TAIEX forecasting, Physica A, vol.349, pp.609-624, 2005. [36] http://www.twse.com.tw/.