branched n-met oligosaccharide concentra- tion initial starch concentration starch concentration total sugar concentration maximum digestion rate of n-met ...
Bioprocess Engineering 7 (1992) 335-343[
Bi0processEngineering 9 Springer-Verlag 1992
A kinetic model and simulation of starch saccharification and simultaneous ethanol fermentation by amyloglucosidase and Zymomonas mobilis C.-G. Lee, C . H . Kim and S.K. Rhee, Taejon, Korea
Abstract. A mathematical model is described for the simultaneous saccharification and ethanol fermentation (SSF) of sago starch using amyloglucosidase (AMG) and Zymomonas mobilis. By introducing the degree of polymerization (DP) of oligosaccharides produced from sago starch treated with c~-amylase, a series of MichaelisMenten equations were obtained. After determining kinetic parameters from the results of simple experiments carried out at various substrate and enzyme concentrations and from the subsite mapping theory, this model was adapted to simulate the SSF process. The results of simulation for SSF are in good agreement with experimental results. List of symbols
g/g #max
l/h
E G1 Gc GI G, K~
%, v/w mmol/1 mmol/1 mmol/1 mmol/1 g/1
g o
mmol/]
Kp
mmol/1
K~
Kin, n
mmol/1 mmol/1
ke
%, v/w
kes
k .....
1/s
k~ m, MW,,, P Po n~ Qp,, S,,
g/1 g/g g/tool g/1 g~ g/1 g/(g" h) mmol/h
So
g/1
S,o,
g/~
Vm....
l/h
Vo
g/(1 9h)
rate coefficient of production maximum specific growth rate AMG concentration glucose concentration glucose concentration consumed glucose concentration formed n-met maltooligosaccharide concentration ethanol inhibition constant for ethanol production glucose inhibition constant for glucose production glucose limitation constant for ethanol production glucose limitation constant for cell growth Michaelis-Menten constant for n-mer oligosaccharide enzyme limitation constant proportional constant maximal velocity for n-mer digestion substrate limitation constant maintenance energy molecular weight of n-mer oligosaccharide ethanol concentration initial ethanol concentration maximal ethanol concentration maximum specific ethanol production rate branched n-met oligosaccharide concentration initial starch concentration starch concentration total sugar concentration maximum digestion rate of n-met oligosaccharide initial glucose formation rate
X X0
Yp/~ Y~/~
g/1 g/1 g/g g/g
cell mass initial cell mass ethanol yield cell mass yield
1 Introduction
For industrial ethanol fermentation, starch is being used as a main substrate due to its global abundance and comparatively low price [1-3]. In order to be utilized by ethanologenic microorganisms such as yeasts or a bacterium Zym o m o n a s mobilis, however, starch must be hydrolyzed into glucose units prior to alcohol fermentation. This can be achieved by use of two enzymes, namely, e-amylase and amyloglucosidase (AMG). The former reacts endogenously with e-(1--*4) glucosidic linkages of polysaccharides to produce oligosaccharides and the latter hydrolyzes exogenously the nonreducing end ~-(1 ~4), a-(1-~6) and ~-(l ~ 3 ) glucosidic linkages of oligosacchafides to produce glucose [4]. The reaction rate of each enzyme depends on the chain length of the oligosacchafides [5]. The conventional ethanol fermentation processes using liquefied starch as substrate comprise two separate operations which have significant consequences viz. costs; the presaccharification of starch and ethanol fermentation. In contrast, the simultaneous saccharification and fermentation (SSF) process combines these two steps into one to offer the potential of an increased rate of hydrolysis. In this cost-effective alternative process, the product inhibition on saccharification by glucose can be diminished since the glucose produced from oligosacchafides is consumed immediately by the cells and converted into ethanol [1]. Although considerable attention has been paid to SSF itself, there are few studies reporting practical kinetic models for SSF process [6-8]. Especially for glucose production by exo-cleavage of starch, no adaptable models have been reported. Concentrated on this fact, attempts were made to propose a reliable kinetic model for this single step process, which can be used to develop or optimize SSF processes using Z. mobilis cells and sago starch as substrate.
336
Bioprocess Engineering 7 (1992)
2 Model system
#
#
#
GT~G~-'~G~
##
#1
" G.'---~G3"-'-~G2"-'~G~
2.1 Assumptions for kinetic studies (1.) After liquefaction by a-amylase, oligosaccharides with the degree of polymerization (DP) below 7 are main products of a-amylase from Bacillus licheniformis [5]. Among them, only residual maltose, maltotriose and maltopentaose are major products of liquefaction. Consequently, the e(1 ~6) and e-(l ~3) terminal bonds are taken into consideration only in the oligosaccharides of DP 2, DP 3 and DP 5. (2.) The rates of hydrolysis of e-(l~6) and e-(l~3) bonds by AMG are approximately one-twentieth of the rate of corresponding e-(l~4) bond [9]. (3.) Kinetic parameters, Michaelis-Menten constant (Kin) and molecular activity (km,~) for the hydrolysis of oligosaccharides (from DP 2 to DP 7) were determined by the subsite mapping theory [1012]. (4.) There is no change in enzymatic activity during fermentation period [1, 13]. Thus, the enzyme affinities to each oligosaccharide are irrelevant to enzyme and substrate concentrations.
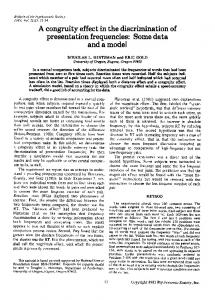
2.2 Models for glucose production by AMG According to the subsite mapping theory, AMG has 7 subsites which can produce enzyme-oligosaeeharide complexes and their affinities to oligosaccharides are closely related to the chain length of oligosaccharides [14-18]. Thus, in AMG-catalyzed saccharification of oligosaccharides, the increase in the degree of polymerization of substrates results in the increase of reaction velocity (V) and concomitant decrease of Michaelis-Menten constant (Kin) [I 1, J 2]. Based on the assumptions made previously, the reaction rate of releasing free glucose units from oligosaccharides can be expresed by a series of Michaelis-Menten equations as follows:
Fig. 1. The schematic diagram for glucose production by AMG. G, and S, denote linear and branched n-mer oligosaccharides, respectively
Table 1. Theoretically obtained parameters for AMG-catalyzed hydrolysis of oligosaccharides Substrate
DP (n)
K,,, ( x io ~, M)
km,xn O/si
Maltose Maltotriose Maltotetraose Maltopentaose Maltohexaose Maltoheptaose
2 3 4 5 6 7
1.20 0.402 0.273 0.204 0.100 0.121
3.01 9.97 16.7 21.1 16.0 20.3
sents the total formation rate of glucose without any consumption. Kin,, and Vm.... are Michaelis-Menten constants and the maximum cleavage velocities for given n-mer substrates, respectively. Table 1 represents the parameters obtained by the subsite mapping theory for the above equations. The Vmax values, however, must be calibrated from the maximum molecular activity, K . . . . by considering both enzyme and initial substrate concentrations before introducing the above model equations. From the assumption (4), this correction can be made by the fact that the initial glucose formation rate, Vo, must equal to the sum of all components as in Eqs. (6) and (7): 7
dG,* _
dt
Vm. . . .
"Gn
Km,n+G .
Kg
(n=2 to 7),
(1)
Vo (E, So) = •
Vm.... (E, So),
(6)
n=l
Ko+G 1
E dS, = _ (Vmax,n/20)Sn.
dt
K,,,,+S,
Ko Ko+G 1
(n = 2, 3, 5),
(2)
dG, dG* dt dt
dG,+l dt
(n = 3, 5, 6),
(3)
dG. dt
* dS.+ 1 dG.+l ~-dt dt
(n--2, and 4),
(4)
dGf
dG* dt
IV/v--laG"\
dt = - - \ , ~ 3
dt j - 2 \
(dG 2 + dS2~
dt
dt J '
(5)
where G, is the molar concentration of n-mer maltooligosaccharides, dG*/dt is the pure cleavage rate of those n-mer oligosaccharides, dG,/dt is the net change rate including the formation rate from (n + 1)-met digestion and S. is the molar concentration of e-(l--.6) and c~-(1~3) branched n-mer oligosaccharides. The schematic diagram of this reaction series is shown in Fig. 1. Thus, the resulting Eq. (5) repre-
Vm . . . .
(E,
S0) = ]s . . . . .
So
" k e s " E -~ k e
S O -[- k s '
(7)
where E and So are AMG and the initial starch concentrations in the fermentation broth, respectively, and ke~, k e and k~ are constants. In this summation, the portions attributed from e-(1 ~ 6) and e-(1 ~ 3) branched n-mer oligosaccharides can be neglected by using the assumption (2). Simultaneous integration of Eqs. (1) through (5) by the fourth order Runge-Kutta-Gill method [19] gives the glucose (Gt) profile. Total sugar concentration (Stot) and starch (oligosaccharides) concentration (Ss,,) are expressed as in equations (8) and (9), respectively: 7
S,ot= Z (G," M W , ) + n=l
S.,. = S,o, - G1
Z
(S,. M W , ) ,
(8)
n=2,3,5
" M W1 ,
M W . = 180 n - 18 ( n - l ) ,
(9)
(lo)
C.-G. Lee et al.: Kinetic model and simulation of SSF process
337
where MW, is the molecular weight of the n-mer oligosaccharide.
2.3 Models for other fermentation variables For cell growth, the following model is used by modifying the growth kinetic models proposed by Levenspiel [20], Ghose et al. [21] and Bazua and Wilke [22] which take the dependence of cell growth on the concentration of glucose and ethanol present in the fermentation broth into account: ~-=#max
i
GI+Kx
1-~
X.
(11)
where Pm is the maximal ethanol concentration for cell growth and can be determined easily by a simple experiment. The substrate inhibition by the high concentration of glucose has been neglected in this model equation since glucose does not accumulate in SSF process. For ethanol production, a modified partially growth-associated Ludeking-Piret model [23] is introduced by taking the ethanol inhibition and glucose limitation terms into account:
F
Metroxylon sagu and a mixture of 27% (w/w) amylose and 73% (w/w) amylopectin [25] was used as substrate. This starch has been assessed as substrate for ethanol production and proven to be an effective substitute for glucose [26]. The total sugar concentration estimated by measuring the dextrose equivalent (DE) produced by hydrolysis with 1 N HC1 for 2 h at 100 ~ was 0.93 g/g of sago starch. The fermentation medium consisted of 50-250 g sago starch and 10 g yeast extract (Difco, USA) per liter of tap water and was sterilized by autoclaving for 15 rain at 121 ~ after e-amylase treatment.
ll-[_K~+PJ ' 1 x+ e d~
3.2 Enzymes used for liquefaction and saccharification of starch Two enzymes, thermostable e-amylase (Thermamyl-60) of Bacillus licheniformis origin, and amyloglucosidase (AMG 2001) from Aspergillus niger, were employed. The enzymatic activites of these enzymes were 60 KNU/g and 200 AGU/ml, respectively, as defined by Novo Industri [27]. 1 K N U is defined as the amount of enzyme that can hydrolyze 5.26 g soluble starch per hour at pH 5.6 and 37 ~ and 1 AGU is the amount of enzyme which cleaves 1 gmole of maltose per rain at pH 4.3 and 25 ~
d~ : Qpm [_G,+K,J
3.3 Experimental conditions The rate of glucose consumption can be calculated by using product yield coefficient (Yp/s) calculated from the basis of total substrate consumed as follows: dG c 1 dP 1 = M--~l " d~ " yp/~ d~
(13)
Finally, the rate equation for glucose accumulation in the fermentation broth can be obtained by the summation of Eqs. (5) and (13):
dG 1 dGy dGc = + -dt dt dt
(14)
Simultaneous numerical integration of Eqs. (11), (12) and (14) gives the most important fermentation variables such as cell mass, ethanol and glucose concentrations. Eqs. (8) and (9) also can be used to calculate starch and total sugar concentrations during the fermentation processes.
A slurry of sago starch powder in tap water (50-250 g/l) was adjusted to pH 6.5 by the addition of 1 N NaOH. Liquefaction of starch was carried out by adding 0.2% (v/w) Termamyl to the slurry and incubating at 95 ~ for 1 h. A 250 ml flask was used as the reactor for the starch digestion experiment to calculate the initial glucose formation rate. The flask containing desired amount of initial starch was incubated at pH 5.0 and 35 ~ in a shaking water bath after proper amount of AMG was loaded. At regular intervals, 1 ml of sample was collected to measure the glucose concentration. SSF was carried out in a 21 fermentor (New Brunswick Chemostat, Model C-32) under non-aerated conditions at desired temperatures with mild agitation. The initial pH was adjusted to 5.0 using 1 N HC1. Inocula (50 ml) were grown in 250 ml flasks at 35 ~ for 20 hours and added to the fermentation medium (t 1). The AMG dosage was 0.2-1.0% (v/w).
3.4 Analytical methods 3 Materials and methods
3.1 Strains and media The strain used for this study was Z. mobilis ZM4 (ATCC 31821). It was maintained and grown in a liquid medium containing 100g/1 glucose, 10g/1 yeast extract, l g/1 KHzPO4, 1 g/l (NH4)2SO 4 and 0.5 g/1 MgSO 4 97HzO [24]. This medium was also used to prepare an inoculum. For fermentation, sago starch which is a product extracted from the seed or tuberous stems of palms and cycads such as
Ethanol, dry cell weight, total sugar and reducing sugar were determined as described previously [26]. Glucose was determined by the glucose oxidase/peroxidase method using Sigma diagnostic kits (Glucose No. 510).
4 Results and discussion
Measurements of initial reaction rate for the calculation of parameters corresponding to initial glucose formation rate
338
Bioprocess Engineering 7 (1992)
(Vo) were carried out at various A M G and starch concentrations at p H 5.0 and 35 ~ Typical trends of Vo with various concentrations of A M G loaded and initial starch concentrations are shown in Fig. 2. F r o m the experimental data, three constants (k~, k~ and k~) in Eq. (7) were evaluated to obtain V0 as a function of A M G concentration (E) and initial starch concentration (So). The resulting values are listed in Table 2. By use of these values as correction factors, Vmax values for each substrate concentration were calculated at various concentrations of A M G and SO from Eqs. (6) and (7). Simultaneous numerical integration of Eqs. (1) through (5) using the values derived from Eq. (7) and initial concentrations of each oligosaccharide at initial starch concentration of 150 g/1 and enzyme concentration of 1.0% (v/w) enabled us to predict the actual concentrations of glucose and other oligosaccharides with D P 2 to D P 7 excellently. The initial values used in the numerical integration are shown in Table 3. The comparison of calculated and experimental profiles of glucose together with the estimated concentrations of oligosaccharides is demonstrated in Fig. 3. F r o m these results, it can be seen that the hydrolysis of oligosaccharides with D P 2, D P 3 and D P 5 in which there are c~-(1--.6) and/or ~-(1 ~ 3 ) linkages besides ~-(1 ~ 4 ) is slower than that of the others which contain only c~-(1--*4) linkages. The reaction rate differences between these oligosaccharides are due to the fact that A M G has higher affinity for longer chains [14]. Comparisons of the model predictions for the glucose production with experimental data were made at various concentrations of initial starch and/or AMG. As can be seen in Fig. 4, the rate of saccharification in the model predictions
Table 2. Values of constants used in the model equations Constant
Value
Reference
ke~ ke
0.369 0.462% (v/w) 32.4 g/1 0.487 g/g 0.0146 g/g 3.o g ; 90.0 g/1 5.1 g/g/h 0.18 g/l 0.303 1/tl 11.0 g/g 1.0 mmol/l 55.0 g/1 7.0 mmol/1 2.0 mmol/l 0.02 g/g
calculated calculated calculated ex )erimental ex ~erimental ex ~erimental ex ~erimental ex ~erimental ex ~erimental ex )erimental simulated simulated simulated simulated simulated simulated
k~
Yp/s Yx/~
P0 P,, Qpm Xo #~.~ c~ Ka
K~ Kv Kx
m~
Table 3. Initial values used in numerical integrations D P (n)
G,/So (fraction)
(S,/So) (fraction)
V~axn ( x 10 -4, i/h)
1 2 3 4 5 6 7
0.0077 0.0734 0.1328 0.0975 0.2244 0.2683 0.0723
0.0313 0.0432 0.0493 -
1.0836 3.5892 6.0120 7.5960 5.7600 7.3080
1/,0 g/I
120 ~20
~ o
'6 .~ 80 {3
E 2 -10
tO
"5 60
...........
L.0
."2_
~ -- . . . . . . ' ~'..~ / . / "
5 o
r
I
I
I
50
100
150
lnitiat
I
200
r
20
[
9/[
\
x
~ \ ~ ~. % x,
starch c o n c e n t r a t i o n So
Fig. 2. Effect of AMG concentration E on initial saccharification rate of starch. Lines represent predicted values and symbols experimental values. (e) 0.2%; (A) 0.6%; (u) 1.0%
0
"- "%.
7 ........
~x
..........
%. "~ %~
0%
300
.
/ ~-...
"~..
5
"-..
10
"'..~ ..
- . . . . . . . . . . . . . . . . .
15 Time
20
25 h
j 30
Fig. 3. Calculated profiles (lines) of glucose and other oligosaccharides with DP 2 to DP 7 compared with experimental glucose concentration (*). (----) Gt; (-. -) G2; (. - -) G3; (-.. -) G4; ( - - - ) Gs; (ooo) G6; (~-,.,.) G~
C.-G. Lee et al.: Kinetic model and simulation of SSF process ~6o I
gIt / L
lZ'OI 1401/"
S o= loo
/~ ~
~
.....
80
O
;r
60 ,2 ~
.....
I .; / .~ ........ ~/~/~"., ....... .q" ......
40
, -e
9"""
2oi C)
0
i
I
5
10
I
I
i
15 20 Time
i
25
30 h 35
Fig.4. Profiles of pedicted (lines) and experimental (symbols) glucose concentration GI at various initial starch and AMG concentrations, So and E. Initial starch concentration So: (-.-) 100 g/l; ( ) 150g/l; ( - - - ) 200g/1. AMG concentration E: (e) 0.2%; (A) 0.6%; (,,) 1.0%
3,5
g/[ 3.0
2.5 X
i
2.0 E -~ 1,5 C)
1,0 0.5 O
0
I
I
I
I
5
10
15 Time
20
I
25 h 30
Fig. 5. Effect of initial starch concentration SO on growth (X) of Zymomonas mobilis. Comparison of calculated curves (lines) from Eq. (11) with experimental data (symbols). So: (e) 100 g/l; (A) 150 gfl; (=) 200 g/1
also fits well with experimental data. It was clear that the increased initial starch and/or A M G concentrations resulted in an increased initial rate of saccharification over the ranges tested. SSF was undertaken with various initial sago starch and A M G concentrations at pH 5.0 and 35~ In most rood-
339 elling studies for Z. mobilis ethanol inhibition kinetics are of a linear type with a threshold ethanol concentrations [28-31]. For the adaptation of models in the fermentation process, the threshold ethanol concentrations for cell growth (Pro) are to be measured and taken into consideration in the model equations. In this study, the value of P,~ was 90 g/1. The cell mass profiles could be obtained easily from the integration of Eq. (11). Fig. 5 shows the resulting growth curves of simulation compared with the measured data points of dry cell weight with an inoculum amount of 0.18 g/1 and the A M G concentration of 1.0% (w/v). The difference in the initial growth rates at different starch concentration seems to be affected by glucose. At higher initial concentration of starch, higher glucose concentration will be generated so as to inhibit cell growth. A slight decay of cell mass in a stationary phase at the initial starch concentration of 200 g/1 is due to cell death caused by high ethanol concentration in the fermentation broth. To obtain ethanol and glucose concentration profiles in SSF system, parameters in Eq. (12) were determined first. Because the fermentation variables, e.g. X, P and G, are mutually related to each other, iteration of simultaneous numerical integration of Eqs. (11), (12) and (14) was performed to estimate the parameters of Kp, Ki, Kx and a. This iteration was done until the mean square errors converged to a minimum value using the fourth order Runge-Kutta-Gill method. Other constants such as Yp/~ and Qpm were calculated from the experimental data. Table 2 lists the values of these constants. Figs. 6 and 7 show the calculated profiles of progress curves of ethanol and glucose concentrations in SSF process. To test the validity of this model system, simulation of whole SSF system was performed at various concentrations of A M G and initial starch. The results predicted were in good agreement with the experimental values. Fig. 8 shows the comparison of calculated profiles of cell growth, ethanol and glucose concentrations with experimental data at 200 g/1 of initial starch concentration with 1.0% (v/w) AMG. The predicted values of ethanol are slightly higher than experimental data during exponential phase. For glucose, this system seems to fail to follow up the rapid increase of glucose ,concentration observed in the early stage of SSE This phenomenon is probably due to the over-estimation of ethanol concentration in the early stage. As the predicted profile of glucose in the later stage is close to experimental ones, however, this over-estimation in the early production phase is not so significant in this system to develop and optimize SSF process. In conclusion, a mathematical model should be able to estimate the variations of important fermentation variables such as glucose, starch, total sugar, ethanol and cell mass. The kinetic model proposed in this study could clearly simulate the experimental data of cell growth, glucose concentration, and production of ethanol in SSF process. However, simulations would also be needed to check directly whether suboptimal conditions exist in any operation or not, albeit
340
Bioprocess Engineering 7 (1992) 200
5.0q gl[ /-*.5~
100
glt
m
75B
g,
4.0
BO
X
~3.5
n
~ o
.E60
-~
~ 3.0
_
125 -5
o
o u
-~4o
=o2.5 o
10() N
~2.0
7S ~o
ILl
so ~ 1.0
20
2s
0.5 I
0
I
I
I
i
5
10
15 Time
20
I
25 h 30
Fig. 6. Effect of initial starch concentration SOon simulated (lines) and experimental (symbols) ethanol production Po. So: (Q) 100 g/I; (A) 150 g/l; (-) 200 g/1 70 g/I 60
c o
50 40
83O ~ 20 101 0
~AN
0
10
15 Time
20
25 h 30
Fig. 7. Effect of initial starch concentration SOon simulated (lines) and experimental (symbols)glucose concentration G 1. So: (o) 100 g/1; (A) 150 g/l; (m) 200 g/1
this preexamination does not always fit directly in the determination of optimal conditions for the process as a whole. Consequently, the model equations should be assessed in the other systems, e.g. semi-batch SSF with cell recycle or continuous SSF with immobilized biocatalysts to verify a generality of the proposed model for its further application. References
1. Lee, J. H.; Pagan, R. J.; Rogers, P. L.: Continuous simultaneous saccharification and fermentation of starch using Zymomonas mobilis. Biotechnol. Bioeng. 25 (1983) 659-669
~
0 0
5
10
15 20 25 h 30 Time Fig. 8. Comparison of fermentation variables between predicted (lines) and experimental (symbols) SSF process. (A) ethanol; (o) cell mass; (m) glucose; (e) total sugar; (~)
2. de Menezes, T. J. B.: Starchy materials for alcohol fuel production. Process Biochem. 17 (1982) 32-35 3. Poosaran, N.; Heyes, R. H.; Rogers, P. L.: Ethanol production from cassava starch using a highly productive strain of Zymomonas mobilis and Saccharomyces uvarum ATCC 26602. Biomass. 7 (1985) 171-183 4. Pazur, J. H.; Ando, T.: The hydrolysis of glucosyl oligosaccharides with c~-D-(144) and c~-D-(l46) bonds by fungal amyloglucosidase. J. Biol. Chem. 235 (1960) 297-302 5. Norman, B. E.: The application of polysaccharide degrading enzymes in the starch industry. In: Berkeley, R. C. W.; Gooday, G. W.; Ellwood, D. C. (Eds.): Microbial Polysaccharides and Polysaccharases, pp. 339-376. New York: Academic Press 1979 6. Ghosh, P.; Pamment, N. B.; Martin, W. R. B.: Simultaneous saccharification and fermentation of cellulose: Effect of/?-D-glucosidase activity and ethanol inhibition of cellulases. Enzyme Microb. Technol. 4 (1982) 425-430 7. Asenjo, J. A.: Modelling the bioconversion of cellulose into microbial products: Rate limitations. Process Biochem. 19 (1984) 217-224 8. Lee, G. M.; Kim, C. H.; Zainal, A.; Han, M. H.; Rhee, S. K.: Sago starch saccharification and simultaneous ethanol fermentation by amyloglucosidase and Zymomonas mobilis. J. Chem. Tech. Biotechnol. 38 (1987) 235-242 9. Pazur, J. H.; Kleppe, K.: The hydrolysis of c~-D-glucosides by amyloglucosidase from Aspergillus niger. J, Biol. Chem. 237 (1984) 1002-1006 10. Hiromi, K.: Interpretation of dependency of rate parameters on the degree of polymerization of substrate in enzyme-catalyzed reactions: Evaluation of subsite affinities of exo-enzyme. Biochem. Biophys. Res. Commun. 40 (1970) 1-6 11. Hiromi, K.; Nitta, Y.; Numata, C.; Ono, S.: Subsite affinities of glucoamylase: Examination of the validity of the subsite theory. Biochim. Biophys. Acta 302 (1973) 362-375 12, Tanaka, A.; Fukuchi, Y.; Ohnishi, M.; Hiromi, K.; Aibara, S.; Morita, Y.: Fractionation of isozymes and determination of the subsite structure of glucoamylase from Rhizopus niveus. Agr. Biol. Chem. 47 (1983) 573-580 13. Kim, C. H.; Lee, G. M.; Zainal, A.; Han, M. H.; Rhee, S. K.: Immobilization of Zymomonas mobilis and amyloglueosidase
C.-G. Lee et al.: Kinetic model and simulation of SSF process
14. 15.
16. 17. 18. 19. 20. 21.
22. 23. 24. 25.
for ethanol production from sago starch. Enzyme Microb. Technol. 10 (1988) 426-430 Ono, S.; Hiromi, K.; Zinbo, M.: Kinetic studies on gluc-amylase. I. The influence of chain length of linear substrates on the rate parameters. J. Biochem. 55 (1964) 315-320 Hiromi, K.; Hamauzu, Z.; Takahashi, K.; Ono, S.: Kinetic studies on gluc-amylase. II. Competition between two types of substrate having c~-1,4and e-l,6 glucosidic linkage. J. Biochem. 59 (1966) 411-418 Hiromi, K.; Takahashi, K.; Hamauzu, Z.; Ono, S.: Kinetic studies on gluc-amylase. III. The influence of pH on the rates of hydrolysis of maltose and panose. J. Biochem. 59 (1966) 469-475 Hiromi, K.; Kawai, M.; Ono, S.: Kinetic studies on gluc-amylase. IV. Hydrolysis of isomaltose. J. Biochem. 59 (1966) 476-480 Abduliah, M.; Fleming, I. D.; Taylor, P. M.; Whelan, W. J.: Substrate specificity of the amyloglucosidase of Aspergillus niger. Biochem. J. 89 (1963) 359-369 Kuo, S. S.: In: Computer applications of numerical methods. Massachusetts: Addison-Wesley Publishing Company, Inc. 1972 Levenspiel, O.: The Monod equation: A revisity and a generalization to product inhibition situations. Biotechnol. Bioeng. 22 (1980) 1671-1687 Ghose, T. K.; Tyagi, R. D.: Rapid ethanol fermentation of cellulose hydrolysate, II. Product and substrate inhibition and optimization of fermentor design. Biotechnol. Bioeng. 21 (1979) 1401-1420 Bazua, C. D.; Wilke, C. R. P.: Ethanol effects on the kinetics of a continuous fermentation with Saccharomyces cerevisiae. Biotechnol. Bioeng. Syrup. No. 7 (1977) 105-118 Leudeking, R.; Piret, E. L.: A kinetic study of the lactic acid fermentation: Batch process at controlled pH. J. Biochem. Microbiol. Technol. Eng. 1 (1959) 393 412 Rogers, P. L.; Lee, K. J.; Tribe, D. E.: Kinetics of alcohol production by Zymomonas mobilis at high sugar concentrations. Biotechnol. Lett. 1 (1979) 165-170 Tan, K.: Sago production in southwest peninsular Malaysia. In: Stanton, W. R.; Flach, M. (Eds.): Proceedings of the Second International Sago Symposium, pp. 56 83. The Hague/Boston/ London: Martinus Nijhoff Publishers 1980
341 26. Rhee, S. K.; Lee, G. M.; Han, Y. T.; Zainal, A.; Han, M. H.; Lee, K. J.: Ethanol production from cassava and sago starch using Zymomonas mobilis. Biotechnol. Lett. 6 (1984) 615-620 27. Novo Industri Enzyme Information. File Number A5170-GB (1972) 28. Lee, K. J.; Rogers, P. L.: The fermentation kinetics of ethanol production by Zymomonas mobilis. Chem. Eng. J. 27 (1983) 831-838 29. Hyung, S. Y.; Chen, J. C.: Analysis of the kinetics of ethanol fermentation with Zymomonas mobilis considering temperature effect. Enzyme Microb. Technol. 10 (1988) 431-439 30. Jobses, I. M. L.; Roels, J. A.: The inhibition of the maximum specific growth and fermentation rate of Zymomonas mobilis by ethanol. Biotechnol. Bioeng. 28 (1986) 554-563 31. Jobses, I. M. L.; Egberts, G. T. C., Luyben, K. C. A. M.; Roels, J. A.: Fermentation kinetics of Zymomonas mobilis at high ethanol concentrations: Oscillations in continuous cultures. Biotechnol. Bioeng. 28 (1986) 868-877
Received June 18, 1991 C.-G. Lee Department of Chemical Engineering University of Michigan Ann Arbor, Michigan 48109-2136 USA C. H. Kim S. K. Rhee (corresponding author) Laboratory of Metabolic Engineering Genetic Engineering Research Institute Korea Institute of Science and Technology P.O. Box 17 Taedok Science Town Taej on, 305-606 Korea