A Mathematical Model for Evaluating the Perceptual Quality of Video Jose Joskowicz, José-Carlos López-Ardao, Miguel A. González Ortega, and Cándido López García ETSE Telecomunicación, Campus Universitario, 36310 Vigo, Spain Ph.: +598 99 261323, +34 986 8212176
[email protected],
[email protected],
[email protected],
[email protected]
Abstract. In this paper, a simple mathematical formula is proposed which provides estimation for the perceived video quality, based solely in the codec used, the display format, the bit rate and the movement content in the original video. The quality metric used is one of the recently standardized in Recommendations ITU-T J.144 and ITU-R BT.1683, and developed by NTIA. The error obtained with the proposed formula, regarding to the ITU models, is between the ITU algorithms error margins, according to the subjective tests developed by the VQEG. Studies were made for more than 1500 processed video clips, coded in MPEG-2 and H.264/AVC, in bit rate ranges from 50 kb/s to 12 Mb/s, in SD, VGA, CIF and QCIF display formats. Keywords: Video perceptual quality, Video codecs, Video signal processing.
1 Introduction This paper presents a simple formula for estimating the perceptual quality of video encoded in MPEG-2 [1] and H.264 [2], in function of the bit rate. The main objective is to find a simple mathematical model that allows predicting, within certain error margins, the perceived quality of video encoded with different codecs (MPEG-2 and H.264/AVC) at different bit rates, and in different display formats, including SD (Standard Definition, 720 × 576 pixels), VGA (Video Graphics Array, 640 x 480 pixels), CIF (Common Intermediate Format, 352 × 288 pixels) and QCIF (Quarter Common Intermediate Format, 176 × 144 pixels). MPEG-2 is widely used in commercial applications for digital TV distribution. It is also used to encode movies and other programs that are distributed on DVD. For these reasons, most of the digital video receivers support it. H.264/AVC is the natural successor to MPEG-2. There is now a very high interest in this new codec, promising better quality at lower bit rates [3]. Several comparisons and characterizations of these codecs have been made, contrasting the image quality obtained regarding to the original image (full reference models), or predicting the image quality based only in the degraded image (no reference models) [4][5][6][7][8][9]. However, most of these comparisons have been A. Mauthe et al. (Eds.): FMN 2009, LNCS 5630, pp. 164–175, 2009. © Springer-Verlag Berlin Heidelberg 2009
A Mathematical Model for Evaluating the Perceptual Quality of Video
165
made using non-perceptual metrics such as PSNR (Peak Signal to Noise Ratio). It is accepted that such quality measures does not match the "perceived" quality [10]. Recently, based on VQEG (Video Quality Expert Group) work, ITU (International Telecommunication Union) has standardized the recommendations ITU-T J.144 [11] and ITU-R BT.1683 [12] for estimation of the perceived video quality in digital TV applications when the original signal reference is available (Full Reference models). Also, the standardization for the estimation of the perceived video quality in multimedia applications is in process, based on the VQEG Multimedia Reports [13]. This paper presents a MPEG-2 and H.264 codec characterization, using one of the standardized algorithms in the recommendation ITU-T J.144, and developed by the NTIA (National Telecommunications and Information Administration) [14], based on the evaluation of an important number of video clips in bit rate ranges from 50 kb/s to 12 Mb/s. Sixteen video sources were used, coded in 96 different formats, varying the codec (MPEG-2 and H.264), the bit rate and the display format. In total more than 1500 processed video sequences were analyzed to derive the proposed formula. As part of this work, the perceived quality performance of the H.264 codec was compared against MPEG-2, using one of the ITU standardized perceptual methods. Based on the analysis, a simple mathematical formula is proposed, which provides an estimation for the perceived quality, based solely in the codec used, the display format, the bit rate and the movement content in the original video. No comparison to the degraded signal is needed in the proposed method. Many MPEG-2 encoders use the TM5 (Test Model 5) rate control algorithm, which does not take into account any perceptual standardized model. Other encoders use complex algorithms, generally based on non-perceptual models [15][16]. With the proposed method, new rate control algorithms can be developed, based on standardized perceptual quality models, with very simple processing requirements. Using this simple method has two main advantages. First, the perceived quality can be easily estimated by the encoder, allowing to dynamically change the bit rate in order to adjust the perceived quality, depending on the video content, without any feedback from the receiver. Second, it serves as a basis for future studies. The estimated perceived quality sets a maximum threshold of quality, achievable only if there are no other distortions to the signal. Any other distortion (e.g. packet loss in IP transmission) will result in further degradation in the perceived quality. The paper is organized as follows: Section 2 describes a summary of the perceived quality estimation models standardized in recommendation ITU-T J.144. Section 3 details the procedures employed to generate the processed video clips. Section 4 discusses how the perceived quality of video clips encoded with MPEG-2 and H.264 varies depending on the display format, the bit rate and the movement content, and presents a formula for the quality estimation. An H.264 to MPEG-2 performance evaluation is presented in this section. Section 5 summarizes the main contributions.
2 Standardized Perceptual Video Models The Recommendation ITU-T J.144 is based on the work performed by the VQEG between the years 1997 to 2003, related with the systematic and objective comparison of different perceptual video quality estimation models and algorithms for digital
166
J. Joskowicz et al.
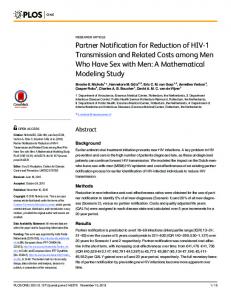
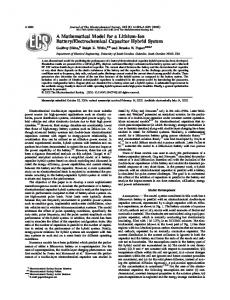
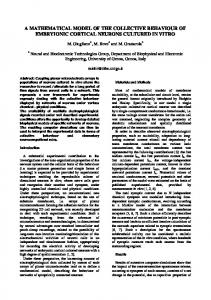
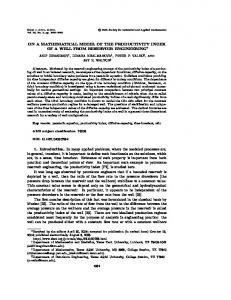
TV applications in SD (Standard Definition), when the original reference signal is available. The models proposed in the Recommendations perform quality comparisons between the “degraded” signal and the “original” signal, and are called FR (Full Reference) models. The final results were published in August 2003 by the VQEG [17]. Based on these results, ITU has standardized in the Recommendations ITU-T J.144 and ITU-R BT.1683 the best algorithms, which has been proved to be statistically equivalent between them. Among the standardized algorithms are the proposed by the NTIA [14] from U.S.A., the Yonsei University from Korea [18], the Telecommunications Research and Development Center (CPqD) from Brazil [19] and the British Telecom (BFTR) from England. All these algorithms are statistically equivalent between them, but none is statistically equivalent to the “perfect model” (the one who is statistically equivalent to the subjective test results). For each video clip pairs (original and degraded), the algorithms provide a value between 0 and 1 (0 when there are no perceived differences and 1 for maximum degradation). Multiplying this value by 100 a metric is obtained which corresponds to the DSCQS (Double Stimulus Continuous Quality Scale) [20] and can be directly related to the DMOS (Difference Mean Opinion Scores). Figure 1.a (extracted from [14]) shows the correlation between the DMOS obtained with the NTIA algorithm and the subjective tests. Figure 1.b (extracted from [18]) shows the same correlation with the Yonsei algorithms. As can be seen, there is some dispersion between the algorithm results and the subjective tests. This dispersion can be estimated in +/- 0.1 in the 0-1 scale. This means that the order of magnitude of the standardized algorithm error is 0.1 in a DMOS scale from 0 to 1.
(a) NTIA
(b) Yonsei
Fig. 1. Subjective quality with respect to estimated quality. a. In NTIA model, for 625 line clips. b. In Yonsei model, for 625 line clips.
3 Video Clips Generation The video clips detailed in Table 1, available in the VQEG web page [21], were used in this paper. Two sets of video clips were generated, one coded in MPEG-2 and other in H.264, in bit rates range from 50 kb/s to 12 Mb/s. All other coding parameters were fixed, in the values showed in Table 2.
A Mathematical Model for Evaluating the Perceptual Quality of Video
167
Table 1. Source video clips used Source src 2 src 3 src 4 src 5 src 7 src 9 src 10 src 13
Name Barcelona Harp Moving graphic Canoa Valsesia Fries Rugby Mobile&Calendar Baloon-pops
Source src 14 src 16 src 17 src 18 src 19 src 20 src 21 src 22
Name New York 2 Betes_pas_betes Le_point Autums_leaves Football Sailboat Susie Tempete
Table 2. MPEG-2 and H.264 coding parameters MPEG-2 Profile/Level: MP@ML Max GOP size: 15 GOP Structure: Automatic Picture Structure: Always Frame Intra DC Precision: 9 Bit rate type: CBR (Constant Bit rate) Interlacing: Non-Interlaced Frame Rate: 25 fps
H.264 Profile/Level: High/3.2 Max GOP size: 33 Number of B Pictures between I and P: 2 Entropy Coding: CABAC Motion Estimated Subpixel mode: Quarter Pixel Bit rate type: CBR (Constant Bit rate) Interlacing: Non-Interlaced Frame Rate: 25 fps
The original and the coded video clips were converted to non-compressed AVI format in order to be compared. The comparison was made using the NTIA algorithms available in [22]. Each one of the 16 source video clips listed in Table 1 was coded in 96 different formats, varying the codec used (MPEG-2 and H.264), the bit rate and the display format. In total more than 1500 processed video sequences were analyzed and used to derive the proposed method.
4 Perceived Quality as a Function of the Bit Rate The NTIA algorithm returns values between 0 (no perceived difference between the clips) and 1 (maximum perceived degradation). Multiplying this value by 100 a metric is obtained which can be directly related to the DMOS. The interpretation of the values is presented in Table 3. Table 3. DMOS to perceived quality relation Value 0-19 20-39 40-59 60-79 80-100
Quality Excellent Good Fair Poor Bad
168
J. Joskowicz et al.
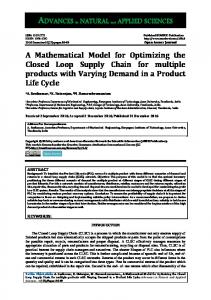
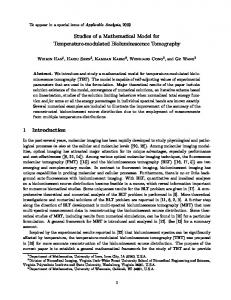
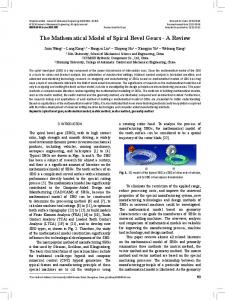
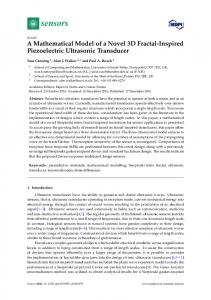
Figure 2 shows how the perceived quality varies (measured as DMOS, normalized in the range 0-1) as a function of the bit rate, keeping constant all other coding parameters, for the clip “Football” (src 19), coded in MPEG-2. The figure shows the typical behavior for any video clip: a) The perceived quality is higher (the DMOS is lower) for higher bit rates. b) For the same quality (DMOS), higher bit rates are needed for bigger displays.
Src19 - Football 0.7 0.6
DMOS
SD 0.5
CIF QCIF
0.4
VGA
0.3 0.2 0.1 0 12.000
11.000
10.000
9.000
8.000
7.000
6.000
5.000
4.000
3.000
2.000
1.000
0.000
Bitrate (Mb/s)
Fig. 2. Perceived quality (DMOS using one of the ITU-T J.144 models) for the clip “Football” coded in MPEG-2 as a function of the bit rate, for display formats SD, VGA, CIF and QCIF
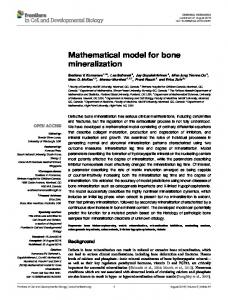
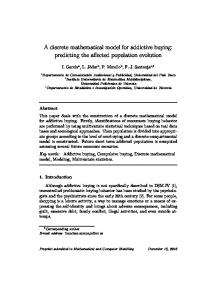
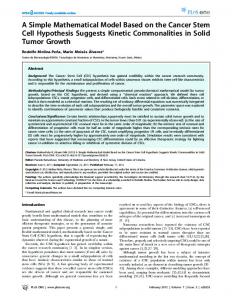
Figure 3 shows the same behavior for all the clips of Table 1. The figure shows the perceived quality as a function of the bit rate for MPEG-2 in SD, VGA, CIF and QCIF display formats respectively. As can be seen, all the clips have better perceived quality for higher bit rates, as can be expected. In MPEG-2, in SD, for bit rates higher than 6 Mb/s all the clips have an almost “perfect” perceived quality (DMOS less than 10). At 3 Mb/s practically all the clips are in the “Excellent” range. However for less than 3 Mb/s the perceived quality strongly depends upon the clip content. For example at 2.5 Mb/s, the DMOS varies between 5 (almost “perfect” quality) and 25 (“Good” quality) for different clips, and at 0.9 Mb/s the DMOS varies between 18 (“Excellent” quality) and 80 (“Bad” quality). Is common to use MPEG-2 at 3.8 Mb/s in SD IPTV commercial applications, where the perceptual quality is in the “Excellent” range for all video clips. However, at low bit rates there are high differences in the perceived quality for identical coding conditions, depending on video content. Similar considerations can be made for VGA, CIF and QCIF display formats. It can be seen, that for a given clip, the curves for SD, VGA, CIF and QCIF are very similar, if the bit rate scale is “expanded” for the VGA, CIF and QCIF curves.
A Mathematical Model for Evaluating the Perceptual Quality of Video
b. VGA MPEG-2
a. SD MPEG-2
src2 src4 src7 src10 src14 src17 src19 src21
0.7 0.6
DMOS
0.5 0.4
0.8
src3 src5 src9 src13 src16 src18 src20 src22
src2 src4 src7 src10 src14 src17 src19 src21
0.7 0.6 0.5 DMOS
0.8
0.4
9.000
0.8
src3 src5 src9 src13 src16 src18 src20 src22
src2 src4 src7 src10 src14 src17 src19 src21
0.7 0.6 0.5 DMOS
0.4
8.000
0.5
7.000
0.6
6.000
d. QCIF MPEG-2
src2 src4 src7 src10 src14 src17 src19 src21
0.7
src3 src5 src9 src13 src16 src18 src20 src22
Bitrate (Mb/s)
c. CIF MPEG-2 0.8
5.000
12.000
11.000
10.000
9.000
8.000
7.000
6.000
5.000
4.000
3.000
2.000
1.000
0.000
4.000
0 3.000
0.1
0
2.000
0.2
0.1
1.000
0.3
0.2
0.000
0.3
Bitrate (Mb/s)
DMOS
169
0.4
0.3
0.3
0.2
0.2
0.1
0.1
0
0 1.000
0.900
0.800
0.700
0.600
0.500
0.400
0.300
0.200
0.100
0.000
3.000
2.750
2.500
2.250
2.000
1.750
1.500
1.250
1.000
0.750
0.500
0.250
0.000
Bitrate (M b/s)
src3 src5 src9 src13 src16 src18 src20 src22
Bitrate (Mb/s)
Fig. 3. Perceived quality (DMOS using one of the ITU-T J.144 models) for all the analyzed clips, coded in MPEG-2, as a function of the bit rate, for SD, VGA, CIF and QCIF
4.1 MPEG-2 The curves in Figure 3, for clips coded in MPEG-2, can be modeled by different type of relations between the DMOS and bit rate. The heuristic Equation (1) was the best fit, choosing appropriate values for the coefficients a, m and n.
DMOS =
m (a.bitrate) n
(1)
where bitrate is expressed in Mb/s and DMOS is the quality metric, with values between 0 and 1. The coefficient a is related to the display format (SD, VGA, CIF or QCIF), and can be defined arbitrarily equal to 1 for SD. Coefficients m and n are related to the curve shape. The goal is to obtain the best values for a, m and n, in order to minimize the errors between the perceived quality (DMOS) obtained using the standardized algorithms and the obtained using the proposed formula, for all the clips coded in MPEG-2, in all the display formats. First, the best values for a can be obtained. For CIF, this value can be calculated as follows: For each DMOS, a value of a can be calculated as the ratio between the bit
170
J. Joskowicz et al.
rates of CIF and SD for this DMOS. For example, if DMOS=0.5 for 1 Mb/s in SD and for 0.28 Mb/s in CIF, then, in this case, a=1/0.28=3.57 for CIF. The same procedure can be done for all the clips, and for many DMOS values. Then all the a values can be averaged, in order to obtain only one value for the display format. Similar calculations can be performed for VGA and QCIF. Using this definition, the best values for the coefficient a are presented in Table 4. Table 4. Best values for a Display format SD VGA CIF QCIF
Value for a 1 1.4 3.2 10.8
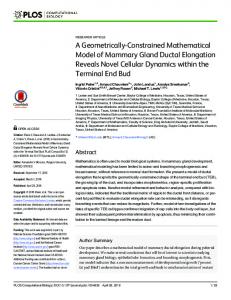
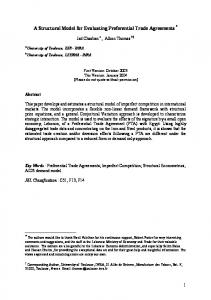
With this values for a, the best values form m and n can be obtained for each clip. Table 5 shows the values of m and n that best fits Equation (1) to each curve in Figure 3, as well as the MSE (Mean Square Error), sorted by m. Figure 4 shows the curves according to ITU Model and the estimated with (1) for the src 13, clip “Ballon-Pops” (for which the worst approximation is obtained). It can be seen that even in the worst case, the model presented in Equation (1) reproduce tightly the “actual” curves for the four display formats, with a mean square error of 0.0322. Table 5. m and n values that best fits to the actual NTIA curves Source Src 4 src 20 Src 14 src 21 Src 16 Src 18 Src 3 src 22 Src 7 Src 10 Src 2 Src 5 src 19 Src 9 Src 13 Src 17
Name Moving graphic Sailboat New York 2 Susie Betes_pas_betes Autums_leaves Harp Tempete Fries Mobile&Calendar Barcelona Canoa Valsesia Football Rugby Baloon-pops Le_point
Movement Low Low Low Low Low Low Medium Medium Medium Medium High High High High High High
Optimal m 0.15 0.195 0.21 0.21 0.225 0.27 0.33 0.33 0.39 0.42 0.435 0.495 0.51 0.555 0.57 0.69
Optimal n 0.885 1.155 1.155 1.32 1.065 1.14 1.095 1.11 1.2 0.96 0.885 1.065 1.185 0.99 1.14 1.11
MSE 0.0122 0.0151 0.0244 0.0140 0.0242 0.0119 0.0117 0.0118 0.0090 0.0176 0.0165 0.0130 0.0192 0.0193 0.0322 0.0285
Very similar behaviors can be seen for many clips. For example, clips for src 4, 14, 16, 18, 20 and 21 have practically identical behaviors in all formats. In a more general consideration, clips can be divided into 3 main groups. Table 5 shows a subjective estimation for the clip movement content, classified into “Low”, “Medium” and “High”. It can be seen a correlation between m and the movement content.
A Mathematical Model for Evaluating the Perceptual Quality of Video
171
ITU vs Estimation (Baloon Pops MPEG-2) 0.9 ITU Model SD
0.8
Estimation SD 0.7
ITU Model CIF Estimation CIF
DMOS
0.6 0.5
ITU Model QCIF Estimation QCIF
0.4
ITU Model VGA
0.3
Estimation VGA
0.2 0.1 0 12.000
11.000
10.000
9.000
8.000
7.000
6.000
5.000
4.000
3.000
2.000
1.000
0.000
Bitrate (Mb/s)
Fig. 4. Perceived quality calculated with NTIA model and with Equation (1), for the clip “Baloon-Pops”, in SD, VGA, CIF and QCIF formats
It is possible to find, using the same equation (1), the values of m and n that best fit to all the curves in each group (low, medium and high movement content). Table 6 shows the values for m and n that best fits to all the clips in each group. The maximum mean square error is 0.0396 (for the group “High Mov”). Table 6. m and n values that best fits to each group for MPEG-2 Movement Low Movement Medium Movement High Movement
Optimal m
Optimal n
0.21 0.36 0.54
1.125 1.065 1.065
MSE 0.0227 0.0231 0.0396
It is worth noting that subjective rating scales (shown in Table 3) have ranges of 0.2 (e.g. “Excellent” is from 0 to 0.19). On the other hand, the algorithms standardized by the ITU have errors in the order of +/- 0.1 regarding to measures of subjective quality. Errors of the proposed model in respect to the obtained with the algorithm of the NTIA have a maximum mean squared error of less than 0.04, which places it within the error margin of the ITU standardized algorithms. Based on these considerations, the mean square error obtained with the proposed formula for the three movement groups seems to be acceptable. 4.2 H.264 For each video clip listed in Table 1, and for each display format and bit rate, the perceptual quality was computed (according to the ITU model), for MPEG-2 and for H.264. For the same clip, at the same bit rate and display format, the relation between the perceptual quality for MPEG-2 and H.264 is the enhancement factor from one
172
J. Joskowicz et al.
codec to the other. We will call this enhancement factor k, using the definition presented in (2).
k=
DMOS MPEG 2 DMOS H .264
(2)
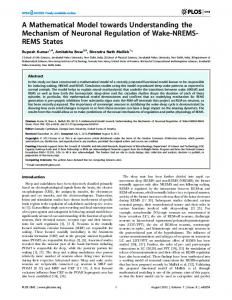
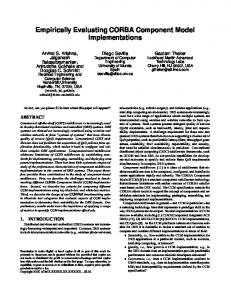
The value of k can be computed for all the encoded video clips, at different bit rates and in different formats. Figure 5 shows the relation between k and the “scaled” bit rate (i.e. a.bitrate). Average DMOSMPEG2/DMOSH.264 for all clips in all formats 1.7 1.6 MPEG/H264 Relation for all clips in SD, VGA, CIF and QCIF Exponential Model
1.5
k
1.4 1.3 1.2 1.1 1 0
1
2
3
4
5
6
7
8
9
10 11 12 13 14 15 16 17 18 19 20
Scaled Bitrate (Mb/s)
Fig. 5. Perceived quality relation between MPEG-2 and H.264 as a function of the scaled bit rate (i.e., a.bitrate), averaged for all the video clips in all display formats
This relation can be modeled with equation (3), proposing an exponential model.
k = l + d .e − b.a.bitrate
(3)
Where a depends on the display format as detailed in Table 4, and l, d and b must be calculated in order best fit equation (3) to the actual values. Using the source clips detailed in Table 1, coded in the different display formats and bit rates, the best values for l, d and b were calculated, and are the following: l = 1.07, d= 0.80, b= 0.50 For higher bit rates, k tends to 1.07, meaning that the H.264 codec is in average only 7% better than MPEG-2 for high bit rates. On the other hand, for low bit rates, H.264 is in average as much as 60% better than MPEG-2, regarding the perceptual quality obtained for the same bit rate. The relation k can be incorporated in equation (1), to extend it to H.264. Equation (4) shows the proposed formula for estimating the perceptual video quality of a clip, for MPEG-2 and H.264, as a function of the bit rate, the display format and the movement content.
A Mathematical Model for Evaluating the Perceptual Quality of Video
(a) MPEG-2 ITU vs Proposed method (SD Hi Mov) 0.9
0.6
0.7 0.6
0.4
DMOS
Src17 Src19 src2
0.5
src5 src9 src13 src17
0.8
Src5 Src9 Src13
0.7
DMOS
(b) H.264 ITU vs Proposed method (SD Hi Mov) 0.9
Proposed method
0.8
173
0.3
src19 Proposed method src2
0.5 0.4 0.3
0.2
0.2
0.1 0.1 0
src18 src20
0.3
Src20 Src21
0.2
src4 src14 src16
0.4 0.35
DMOS
DMOS
0.45
Src16 Src18
0.3 0.25
9.000
0.35
8.000
(d) H.264 ITU vs Proposed method (CIF Low Mov)
Proposed method Src4 Src14
0.4
7.000
Bitrate (Mb/s)
(c) MPEG-2 ITU vs Proposeed method (CIF Low Mov) 0.45
6.000
Bitrate (Mb/s)
5.000
4.000
3.000
2.000
1.000
0.000
12.000
11.000
10.000
9.000
8.000
7.000
6.000
5.000
4.000
3.000
2.000
1.000
0.000
0
0.15
0.25
src21 Proposed method
0.2 0.15
2.000
1.750
1.500
1.250
1.000
Bitrate (Mb/s)
0.750
0.500
0.250
0.000
3.000
2.750
2.500
2.250
2.000
1.750
1.500
1.250
1.000
0
0.750
0 0.500
0.05
0.250
0.1
0.05 0.000
0.1
Bitrate (Mb/s)
Fig. 6. Examples of perceived quality computed with ITU model and estimation using the proposed method a., c. High and low movement clips, coded in MPEG-2, in SD display format b., d. High and low movement clips, coded in H.264, in CIF display format
DMOS =
m k .(a.bitrate) n
(4)
Where k depends on the codec, with the following values: k=1
for MPEG-2
k = l + d .e − b.a.bitrate
for H.264
The best values for m and n were re-calculated, in order to best fit equation (4) for all the video clips, coded in MPEG-2 and H.264, in SD, VGA, CIF and QCIF, and at different bit rates. The optimal values with the respective mean square errors are presented in Table 7. The worst mean square error for the proposed formula is 0.0616, computed for more than 1500 processed video clips used in the study. This value is lower than 0.1, which places it within the error margin of the ITU standardized algorithms. Based on these considerations, the mean square error obtained with the proposed formula is acceptable. As an example, Figure 6 shows the perceived quality for clips coded in MPEG-2 and in H.264, in SD and CIF display format, with high
174
J. Joskowicz et al.
and low movement content, and the curve derived from equation (4) using the values for a, m and n detailed in Table 4 and 7 respectively. Table 7. m and n values that best fits to each movement content for MPEG-2 and H.264 Source Low_mov med_mov hi_mov
Name Low Movement Medium Movement High Movement
Optimal m
Optimal n
0.192 0.368 0.536
0.992 0.956 0.894
MSE 0.0264 0.0346 0.0616
5 Conclusion The MPEG-2 and H.264 codec performance has been studied, evaluating the perceived video quality as a function of the bit rate and the display format, maintaining all other coding parameters constant. The study has been made for SD, VGA, CIF and QCIF display formats in the range from 50 kb/s to 12 Mb/s. The recommendation ITU-T J.144 has been used as the starting point and in particular the NTIA algorithms were used to estimate the subjective video quality. The results have shown that the perceived quality has a strong relation with the video clip content for low bit rates, in particular, with the movement content. For each codec, display format and bit rate, the perceived quality can be estimated using a simple mathematical formula of the type m/[k.(a.bitrate)n], only knowing the movement content (classified in three levels: High, Medium or Low). The best values for a, k, m and n has been calculated, and are presented in the paper. This approach offers a clear advantage for calculating the perceived quality, as it does not require simulations or complex software, nor to know the degraded and the original video reference. The perceived quality after the encoding can be directly estimated by a simple mathematical formula. The results have an acceptable error regarding to the standard ITU algorithms. The proposed formula serves as an estimator for the maximum quality that can be obtained in MPEG-2 and H.264/AVC. This quality can only be achieved if there are no other degradations in the transmission (e.g. packet loss in IP networks).
References 1. ISO/IEC 13818-2:2000. Information technology – generic coding of moving pictures and associated audio information: Video 2. ITU-T H.264 Advanced Video Coding for Generic Audiovisual Services (March 2005 ) 3. Wiegand, T., Sullivan, G.J., Bjontegaard, G., Luthra, A.: Overview of the H.264 / AVC Video Coding Standard. IEEE Transactions on Circuits and Systems For Video Technology 13 (July 2003) 4. Basso, A., Dalgic, I., Tobagi, F.A., van den Branden Lambrecht, C.J.: Study of MPEG-2 Coding Performance Based on a Perceptual Quality Metric. In: Proc. Picture Coding Symp., Melbourne, Australia, Melbourne, Australia (March 1996) 5. Kamaci, N., Altunbasak, Y.: Performance comparison of the emerging H.264 video coding standard with the existing standards. In: Proceedings ICME 2003, vol. 1, pp. I- 345–348 (2003)
A Mathematical Model for Evaluating the Perceptual Quality of Video
175
6. Ostermann, J., Bormans, J., List, P., Marpe, D., Narroschke, M., Pereira, F., Stockhammer, T., Wedi, T.: Video coding with H.264/AVC: Tools, Performance, and Complexity. IEEE Circuits and Systems Magazine, First Quarter (2004) 7. Aeluri, P.K., Bojan, V., Richie, S., Weeks, A.: Objective quality analysis of MPEG-1, MPEG-2 & Windows Media video. In: 6th IEEE Southwest Symposium on Image Analysis and Interpretation, March 2004, pp. 221–225 (2004) 8. Ichigaya, A., Nishida, Y., Nakasu, E.: Nonreference Method for Estimating PSNR of MPEG-2 Coded Video by Using DCT Coefficients and Picture Energy. IEEE Transactions on Circuits and Systems for Video Technology 18(6), 817–826 (2008) 9. Wang, S., Zheng, D., Zhao, J., Tarn, W.J., Speranza, F.: Video quality measurement using digital watermarking. In: Proceedings of the 3rd IEEE International Workshop on Haptic, Audio and Visual Environments and Their Applications, 2004. HAVE 2004, October 2, pp. 183–188 (2004) 10. Winkler, S.: Digital Video Quality, Vision Models and Metrics. John Wiley & Sons Ltd., Chichester (2005) 11. Recommendation ITU-T J.144 Objective perceptual video quality measurement techniques for digital cable television in the presence of a full reference (February 2004) 12. Recommendation ITU-R BT.1683 – Objective perceptual video quality measurement techniques for standard definition digital broadcast television in the presence of a full reference (January 2004) 13. Final Report of VQEG’s Multimedia Phase I Validation Test September 19 (2008) 14. Pinson, M.H., Wolf, S.: A New Standardized Method for Objectively Measuring Video Quality. IEEE Transactions on Broadcasting 50(3), 312–322 (2004) 15. Li, Z.G., et al.: Adaptive rate control for H.264. Journal of Visual Communication and Image Representation 17(2), 376–406 (2006) 16. Jiang, M., Ling, N.: On enhancing H.264/AVC video rate control by PSNR-based frame complexity estimation. IEEE Transactions on Consumer Electronics 51(1), 281–286 (2005) 17. Final Report From The Video Quality Experts Group On The Validation Of Objective Models Of Video Quality Assessment, Phase Ii ©2003 VQEG, August 25 (2003) 18. Cho, S., Choe, J., Jeong, T., Ahn, W., Lee, E.: Objective video quality assessment. Optical Engineering 45(1) (January 2006) 19. Lotufo, A., Da Silva, R., Falcao, W.D.F., Pessoa, A.X.: Morphological image segmentation applied to video quality assessment. In: IEEE Proceedings in Computer Graphics, Image Processing and Vision, SIGGRAPI Proceedings, October 1998, pp. 468– 475 (1998) 20. Recommendation ITU-R BT.500-11, Methodology for the subjective assessment of the quality of television pictures, 06/2002 21. VQEG Phase I Test Sequences, ftp://vqeg.its.bldrdoc.gov/SDTV/VQEG_PhaseI/TestSequences/ Reference/ 22. Video Quality Metric (VQM), http://www.its.bldrdoc.gov/n3/video/vqmsoftware.htm