Nov 19, 2008 - Ferner versichere ich, dass ich diese Dissertation noch an keiner anderen ...... aqueous solutions cause Joule heating and electrolysis at the electrodes, ...... Kim YJ, Chung J, Lee HK, Yoon E: Microfluidic array chip for ...
A microfluidic approach for the initiation and investigation of surface-mediated signal transduction processes on a single-cell level Dissertation zur Erlangung des akademischen Grades ”doctor rerum naturalium” (Dr. rer. nat.) in der Wissenschaftsdisziplin Biotechnologie
eingereicht an der Mathematisch-Naturwissenschaftlichen Fakultät der Universität Potsdam von Michael Kirschbaum
Potsdam, den 29. Juli 2009
II
Danksagung Die vorliegende Dissertation entstand während meiner Tätigkeit als wissenschaftlicher Mitarbeiter in der Abteilung „Zelluläre Biotechnologie & Biochips“ am Fraunhofer-Institut für Biomedizinische Technik in Potsdam. An dieser Stelle möchte ich mich bei all denen bedanken, die mich auf vielfältige Weise bei meiner Arbeit unterstützten: Mein erster Dank richtet sich an meinen Mentor, Herrn Dr. Magnus Jäger für die exzellente inhaltliche Betreuung der Arbeit und die wunderbare Zusammenarbeit sowohl auf fachlicher, als auch auf persönlicher Ebene. Auf unkomplizierte Art und Weise gewährte er mir immer den nötigen Freiraum, eigene Ideen und Vorstellungen in die Arbeit einzubringen. Gleichzeitig war er kompetenter Ansprechpartner und stets bereit, sich Zeit für meine Anliegen zu nehmen. Herrn Dr. Claus Duschl, dem Leiter der Abteilung „Zelluläre Biotechnologie & Biochips“ danke ich für die Überlassung des überaus interessanten und vielseitigen Themas, seine fachliche Begleitung, sowie für die Möglichkeit, in seiner Abteilung zu promovieren. Seine konstruktiven Anregungen, sein Rat und sein Engagement waren immer sehr hilfreich und von großem Wert für mich. Ganz besonders möchte ich mich bei meinem Betreuer Herrn Prof. Dr. Frank Bier bedanken. Durch seine Unterstützung und sein entgegengebrachtes Vertrauen wurde diese Arbeit erst ermöglicht. Unserem Institutsdirektor Herrn Prof. Dr. Günter Fuhr danke ich für sein Interesse an meiner Arbeit, seine Bereitschaft zur konstruktiven Diskussion, sowie für seine wertvolle inhaltliche und formale Kritik. Herrn Dr. Walter Stöcklein danke ich für seine Hilfe bei den SPR-Messungen, Rothin Strehlow sei Dank für Millionen und Abermillionen beschichteter Nanobeads, Christine Missler danke ich recht herzlich für ihre Unterstützung bei den Stammzell-Experimenten. Darüber hinaus möchte ich mich bei Anja Magritz und Christopher Schulz für ihr selbstständiges und engagiertes Mitwirken an dieser Arbeit im Rahmen ihrer Zeit als Hilfswissenschaftlerin bzw. Praktikant in unserer Arbeitsgruppe bedanken. Für die orthografische und syntaktische Korrektur wichtiger Teile der Arbeit bedanke ich mich bei Narayanan Madaboosi und meinem alten Schulfreund Jan Saathoff. Ein riesengroßes Dankeschön richtet sich auch an Beate Morgenstern, die mit ihrem Engagement, ihrer Erfahrung und nicht zuletzt mit ihrer verständnisvollen Art maßgeblich dazu beitrug, dass sich die tägliche Arbeit im Labor so angenehm wie nur irgend vorstellbar gestaltete. Ebenso danke ich meinen jetzigen und ehemaligen Mitstreitern der Arbeitsgruppe „Lab-On-Chip Technologie“ Isabella Guido, Christian Marschner, Michael Böttcher, Albora de Pablo Peña, Richard Stein und Maika Felten, sowie allen weiteren Kolleginnen und Kollegen des Instituts für die schöne gemeinsame Zeit, den Zusammenhalt und die ausgesprochen freundschaftliche Arbeitsatmosphäre. Schließlich danke ich meiner lieben Familie und Andrea – für ihre liebevolle Unterstützung, ihren Rückhalt und ihr Vertrauen in meine Fähigkeiten, ohne die diese Arbeit völlig undenkbar gewesen wäre. III
Selbständigkeitserklärung Hiermit erkläre ich, dass ich die vorliegende Dissertation selbständig verfasst und keine anderen als die angegebenen Quellen und Hilfsmittel benutzt habe. Ferner versichere ich, dass ich diese Dissertation noch an keiner anderen Universität eingereicht habe, um ein Promotionsverfahren zu eröffnen. Ich habe mich auch früher um keine Promotion bemüht.
IV
V
Abstract For the elucidation of the dynamics of signal transduction processes that are induced by cellular interactions, defined events along the signal transduction cascade and subsequent activation steps have to be analyzed and then also correlated with each other. This cannot be achieved by ensemble measurements because averaging biological data ignores the variability in timing and response patterns of individual cells and leads to highly blurred results. Instead, only a multi-parameter analysis at a single-cell level is able to exploit the information that is crucially needed for deducing the signaling pathways involved. The aim of this work was to develop a process line that allows the initiation of cell-cell or cellparticle interactions while at the same time the induced cellular reactions can be analyzed at various stages along the signal transduction cascade and correlated with each other. As this approach requires the gentle management of individually addressable cells, a dielectrophoresis (DEP)-based microfluidic system was employed that provides the manipulation of microscale objects with very high spatiotemporal precision and without the need of contacting the cell membrane. The system offers a high potential for automation and parallelization. This is essential for achieving a high level of robustness and reproducibility, which are key requirements in order to qualify this approach for a biomedical application. As an example process for intercellular communication, T cell activation has been chosen. The activation of the single T cells was triggered by contacting them individually with microbeads that were coated with antibodies directed against specific cell surface proteins, like the T cell receptorassociated kinase CD3 and the costimulatory molecule CD28 (CD; cluster of differentiation). The stimulation of the cells with the functionalized beads led to a rapid rise of their cytosolic Ca2+ concentration which was analyzed by a dual-wavelength ratiometric fluorescence measurement of the Ca2+-sensitive dye Fura-2. After Ca2+ imaging, the cells were isolated individually from the microfluidic system and cultivated further. Cell division and expression of the marker molecule CD69 as a late activation event of great significance were analyzed the following day and correlated with the previously recorded Ca2+ traces for each individual cell. It turned out such that the temporal profile of the Ca2+ traces between both activated and nonactivated cells as well as dividing and non-dividing cells differed significantly. This shows that the pattern of Ca2+ signals in T cells can provide early information about a later reaction of the cell. As isolated cells are highly delicate objects, a precondition for these experiments was the successful adaptation of the system to maintain the vitality of single cells during and after manipulation. In this context, the influences of the microfluidic environment as well as the applied electric fields on the vitality of the cells and the cytosolic Ca2+ concentration as crucially important physiological parameters were thoroughly investigated. While a short-term DEP manipulation did not affect the vitality of the cells, they showed irregular Ca2+ transients upon exposure to the DEP field only. The rate and the strength of these Ca2+ signals depended on exposure time, electric field strength and field frequency. By minimizing their occurrence rate, experimental conditions were identified that caused the least interference with the physiology of the cell. The possibility to precisely control the exact time point of stimulus application, to simultaneously analyze short-term reactions and to correlate them with later events of the signal transduction cascade on the level of individual cells makes this approach unique among previously described applications and offers new possibilities to unravel the mechanisms underlying intercellular communication.
VI
Zusammenfassung Zelluläre Interaktionen sind wirkungsvolle Mechanismen zur Kontrolle zellulärer Zustände in vivo. Für die Entschlüsselung der dabei beteiligten Signaltransduktionsprozesse müssen definierte Ereignisse entlang der zellulären Signalkaskade erfasst und ihre wechselseitige Beziehung zueinander aufgeklärt werden. Dies kann von Ensemble-Messungen nicht geleistet werden, da die Mittelung biologischer Daten die Variabilität des Antwortverhaltens individueller Zellen missachtet und verschwommene Resultate liefert. Nur eine Multiparameteranalyse auf Einzelzellebene kann die entscheidenden Informationen liefern, die für ein detailliertes Verständnis zellulärer Signalwege unabdingbar sind. Ziel der vorliegenden Arbeit war die Entwicklung einer Methode, welche die gezielte Kontaktierung einzelner Zellen mit anderen Zellen oder Partikeln ermöglicht und mit der die dadurch ausgelösten zellulären Reaktionen auf unterschiedlichen zeitlichen Ebenen analysiert und miteinander korreliert werden können. Da dies die schonende Handhabung einzeln adressierbarer Zellen erfordert, wurde ein auf Dielektrophorese (DEP) basierendes mikrofluidisches System eingesetzt, welches die berührungslose Manipulation mikroskaliger Objekte mit hoher zeitlicher und örtlicher Präzision erlaubt. Das System besitzt ein hohes Potential zur Automatisierung und Parallelisierung, was für eine robuste und reproduzierbare Analyse lebender Zellen essentiell, und daher eine wichtige Voraussetzung für eine Anwendung in der Biomedizin ist. Als Modellsystem für interzelluläre Kommunikation wurde die T-Zell-Aktivierung gewählt. Die Aktivierung der einzelnen T-Zellen wurde durch ihre gezielte Kontaktierung mit Mikropartikeln („beads“) induziert, welche mit Antikörpern gegen spezielle Oberflächenproteine, wie die dem TZell-Rezeptor assoziierte Kinase CD3 oder das kostimulatorische Protein CD28, beschichtet waren. Die Stimulation der Zellen mit den funktionalisierten beads führte zu einem raschen Anstieg der intrazellulären Ca2+-Konzentration, welche über eine ratiometrische Detektion des Ca2+-sensitiven Fluoreszenzfarbstoffs Fura-2 gemessen wurde. Anschließend wurden die einzelnen Zellen aus dem mikrofluidischen System isoliert und weiterkultiviert. Am nächsten Tag wurden Zellteilung und die CD69-Expression – ein wichtiger Marker für aktivierte T-Zellen – analysiert und auf Ebene der individuellen Zelle mit dem zuvor gemessenen Ca2+-Signal korreliert. Es stellte sich heraus, dass der zeitliche Verlauf des intrazellulären Ca2+-Signals zwischen aktivierten und nicht aktivierten, sowie zwischen geteilten und nicht geteilten Zellen signifikant verschieden war. Dies zeigt, dass Ca2+-Signale in stimulierten T-Zellen wichtige Informationen über eine spätere Reaktion der Zelle liefern können. Da Einzelzellen äußerst empfindlich auf ihre Umgebungsbedingungen reagieren, war die Anpassung der experimentellen Vorgehensweise im Hinblick auf die Zellverträglichkeit von großer Bedeutung. Vor diesem Hintergrund wurde der Einfluss sowohl der mikrofluidischen Umgebung, als auch der elektrischen Felder auf die Überlebensrate und die intrazelluläre Ca2+-Konzentration der Zellen untersucht. Während eine kurzzeitige DEP-Manipulation im mikrofluidischen System die Vitalität der Zellen nicht beeinträchtigte, zeigten diese unregelmäßige Fluktuationen ihrer intrazellulären Ca2+-Konzentration selbst bei geringer elektrischer Feldexposition. Die Ausprägung dieser Fluktuationen war abhängig von der Expositionszeit, der elektrischen Feldstärke und der Feldfrequenz. Über die Minimierung ihres Auftretens konnten experimentelle Bedingungen mit dem geringsten Einfluss auf die Physiologie der Zellen identifiziert werden. Die Möglichkeit, einzelne Zellen zeitlich definiert und präzise mit anderen Zellen oder Oberflächen zu kontaktieren, die unmittelbare Reaktion der Zellen zu messen und diese mit späteren Ereignissen der Zellantwort zu korrelieren, macht die hier vorgestellte Methode einzigartig im Vergleich mit anderen Ansätzen und eröffnet neue Wege, die interzellulärer Kommunikation zugrunde liegende Mechanismen aufzuklären.
VII
Contents 1 INTRODUCTION ............................................................................................................................................ 2 2 OBJECTIVE TARGETS ................................................................................................................................. 4 3 BASIC PRINCIPLES AND CURRENT STATE OF RESEARCH ............................................................. 6 3.1 STRATEGIES TO MANIPULATE MICROSCALE OBJECTS .................................................................................. 6 3.1.1 Contacting techniques .................................................................................................................... 6 3.1.2 Non-contacting techniques ............................................................................................................. 7 3.2 EFFECTS OF ELECTRIC FIELDS ON CELLS.................................................................................................... 11 3.2.1 Joule heating ................................................................................................................................ 11 3.2.2 Transmembrane voltage ............................................................................................................... 12 3.2.3 Analysis of the field influences on cells ........................................................................................ 13 3.3 THE BENEFITS OF MINIATURIZATION ......................................................................................................... 14 3.3.1 Benefits for liquid cell handling ................................................................................................... 14 3.3.2 Benefits for dielectrophoretic cell handling ................................................................................. 16 3.3.3 Benefits for single-cell analysis.................................................................................................... 17 3.4 T CELL ACTIVATION .................................................................................................................................. 18 3.4.1 The role of T cells in our immune system ..................................................................................... 18 3.4.2 Signal transduction downstream of the T cell receptor (TCR) ..................................................... 18 3.4.3 Costimulation ............................................................................................................................... 21 3.4.4 In vitro activation of T cells.......................................................................................................... 21 3.4.5 Ca2+ signaling in T cells............................................................................................................... 22 4 METHODS...................................................................................................................................................... 26 4.1 FUNCTIONALITY OF THE DEP CHIPS.......................................................................................................... 26 4.1.1 Chip design................................................................................................................................... 26 4.1.2 DEP manipulation ........................................................................................................................ 27 4.1.3 Tubing system ............................................................................................................................... 27 4.2 CELL CULTURE.......................................................................................................................................... 29 4.2.1 Cultivation of Jurkat T cells ......................................................................................................... 29 4.2.2 Cultivation of L929 cells .............................................................................................................. 29 4.2.3 Cultivation of FSDC ..................................................................................................................... 29 4.2.4 Cultivation of E14Tg2A mouse embryonic stem (mES) cells........................................................ 29 4.2.5 Single-cell cultivation................................................................................................................... 29 4.2.6 Preparation of peripheral blood lymphocytes (PBL) for DEP manipulation............................... 31 4.2.7 Preparation of mES cells for DEP manipulation ......................................................................... 31 4.2.8 Cultivation of Jurkat T cells under suppressed gas exchange ...................................................... 31 4.2.9 Cultivation of cells in the DEP chips............................................................................................ 31 4.3 SURFACE COATING .................................................................................................................................... 31 4.3.1 Gelatin-coating of 96-well plates and Petri dishes ...................................................................... 31 4.3.2 Antibody coating of microplates................................................................................................... 32 4.3.3 Antibody coating of microbeads ................................................................................................... 32 4.3.4 Surface plasmon resonance (SPR) technology ............................................................................. 32 4.4 IMMUNOLOGICAL AND CELL BIOLOGICAL ASPECTS ................................................................................... 35 4.4.1 Loading of FSDC with OVA257-264 peptide.................................................................................... 35 4.4.2 Loading of Jurkat T cells with Fura-2 AM ................................................................................... 36 4.4.3 T cell activation ............................................................................................................................ 36 4.4.4 Cardiomyocyte differentiation (control experiments)................................................................... 37 4.5 CALCIUM IMAGING WITH FURA-2 ............................................................................................................. 38 4.5.1 Background .................................................................................................................................. 38 4.5.2 Image acquisition ......................................................................................................................... 38 4.5.3 In vitro calibration of Fura-2 ....................................................................................................... 39 4.5.4 Image processing.......................................................................................................................... 39 4.5.5 Analysis of the recorded calcium traces....................................................................................... 40 4.6 PARTICLE MANIPULATION WITH THE DEP CHIPS ....................................................................................... 40 4.6.1 Microfluidic configuration ........................................................................................................... 40 4.6.2 Retrieval of single cells from the fluidic system ........................................................................... 41 4.6.3 Electric and hydrodynamic parameter configuration................................................................... 41 4.7 THERMOMETRY ........................................................................................................................................ 44 4.8 NUMERICAL MODELING ............................................................................................................................ 46 VIII
5 RESULTS ........................................................................................................................................................ 48 5.1 PRELIMINARY EXPERIMENTS OUT OF THE DEP CHIPS ................................................................................ 48 5.1.1 Activation of primary T cells with APCs....................................................................................... 48 5.1.2 Activation of Jurkat T cells with monoclonal antibodies .............................................................. 49 5.1.3 Single-cell cultivation ................................................................................................................... 50 5.2 ACTIVATION OF SINGLE T CELLS EMPLOYING THE DEP CHIPS................................................................... 52 5.2.1 Chip design and microfluidic configuration ................................................................................. 53 5.2.2 Pair formation procedure ............................................................................................................. 54 5.2.3 Post-chip activation protocol........................................................................................................ 54 5.2.4 On-chip activation protocol.......................................................................................................... 56 5.3 CORRELATION OF SHORT- AND LONG-TERM RESPONSES TO THE APPLIED BEAD STIMULUS ........................ 59 5.3.1 Chip design and microfluidic configuration ................................................................................. 59 5.3.2 Pair formation procedure ............................................................................................................. 60 5.3.3 Analysis of the calcium traces....................................................................................................... 61 5.3.4 Analysis of the survival-, activation- and proliferation rates ....................................................... 61 5.3.5 Correlation of the short-term Ca2+ responses with later events in the activation process ........... 62 5.3.6 Control experiments...................................................................................................................... 63 5.4 IMPACT OF THE CHIP MANIPULATION PROCEDURE ON THE CELL PHYSIOLOGY ........................................... 65 5.4.1 DEP manipulation ........................................................................................................................ 65 5.4.2 Microfluidic environment.............................................................................................................. 68 5.5 STABILITY OF THE BEAD COATING ............................................................................................................. 70 5.5.1 Influence of desorbing antibodies on the physiology of Jurkat T cells ......................................... 71 5.5.2 Sensitivity of Jurkat T cells to low concentrations of soluble antibodies...................................... 72 5.5.3 Theoretical quantification of the antibody desorption from the beads ......................................... 73 5.6 FURTHER APPLICATIONS ............................................................................................................................ 79 5.6.1 Activation of primary T cells with APCs....................................................................................... 79 5.6.2 Contact formation between stem cells and somatic cells .............................................................. 79 5.6.3 Contact formation between stem cells and functionalized nanobeads.......................................... 80 6 DISCUSSION .................................................................................................................................................. 84 6.1 PARTICLE MANIPULATION ......................................................................................................................... 84 6.1.1 Pair formation procedure ............................................................................................................. 84 6.1.2 Single-cell isolation ...................................................................................................................... 85 6.1.3 Further applications ..................................................................................................................... 85 6.2 CORRELATION OF SHORT- AND LONG-TERM RESPONSES TO THE APPLIED BEAD STIMULUS ........................ 86 6.3 IMPACT OF THE CHIP MANIPULATION PROCEDURE ON THE CELL PHYSIOLOGY ........................................... 88 6.3.1 Influence on the vitality................................................................................................................. 88 6.3.2 Influence on the cytosolic Ca2+ level ............................................................................................ 90 6.4 STABILITY OF THE BEAD COATING ............................................................................................................. 92 6.4.1 Analysis of the binding constants for the protein A-IgG interaction............................................. 92 6.4.2 Antibody desorption from functionalized beads that are incubated in culture medium................ 93 6.4.3 Antibody desorption from functionalized beads that are flowed with culture medium ................. 93 6.5 STEM CELL DIFFERENTIATION WITH FUNCTIONALIZED NANOPARTICLES ................................................... 94 7 CONCLUSION................................................................................................................................................ 96 8 REFERENCES................................................................................................................................................ 98 LIST OF TABLES.............................................................................................................................................. 106 LIST OF FIGURES............................................................................................................................................ 106 LIST OF ABBREVIATIONS............................................................................................................................ 108 LIST OF PUBLICATIONS ............................................................................................................................... 110 APPENDIX ......................................................................................................................................................... 111
IX
1 Introduction
¯¯¯¯¯¯¯¯¯¯¯¯¯¯¯¯¯¯¯¯¯¯¯¯¯¯¯¯¯¯¯¯¯¯¯¯¯¯¯¯¯¯¯¯¯¯¯¯¯¯¯¯¯¯¯¯¯¯¯¯¯¯¯¯¯¯¯¯¯¯¯¯¯
1
Introduction
Communication is the basis for any type of cooperation. This does not apply only to the social, political and business lives of human beings, but it is also a central dogma of systems biology – without the exchange of information between individual cells, highly organized organismic processes like ontogenesis, immune defense, or sensory perception would simply be impossible. While human communication is predominantly shaped by the exchange of auditory and visual information, the relevant communication techniques used by cells are of paracrine or endocrine nature, and also include direct interactions with extracellular matrix proteins and, in particular, other cells. Speaking the language of cells is essential for a fundamental understanding of the principles underlying the integrity and homeostasis of the human body. At the same time, it will open up exciting new possibilities for the therapy of various human diseases. Communication between two or more respondents is a highly specific process, since the processing of exchanged information heavily depends on the exact conditions of the respective sender and receiver, as well as the modality and chronological sequence of the signal. Thus, the investigation of cell signaling events cannot be achieved by standard cell culture measurements that pool biological data of thousands of cells. Instead, gathering important information about differences in timing and response patterns of individual cells requires the multi-parameter analysis on a singlecell level. However, working on single cells is not an easy task. They are tiny, delicate objects, and even the merest touch can induce a multitude of intracellular signaling events that might interfere with the measured parameter. Thus, gentle particle manipulation that only minimally disturbs the cell of interest is essential when signal transduction processes are studied in vitro. Moreover, a system for the investigation of cellular interactions should allow for initiating cell-cell contacts at high spatiotemporal resolution and at the same time offer a high potential for automation or parallelization, so that statistically relevant data can be produced in short periods of time. Taking into account that individual signaling events are interrelated in a very complex manner and thereby occur at a wide range of time scales, the observation of cellular reactions over long periods of time is essential, the high-resolution analysis on a single-cell level notwithstanding. A broad spectrum of techniques has been established for manipulating cells, ranging from simply retaining the cells with adhesive surfaces to highly versatile approaches based on acoustic or electromagnetic cell trapping. Although many of these techniques allow for a competent particle manipulation, only few of them are adequate for analyzing intercellular communication efficiently. In the present study, a novel protocol has been established for the controlled initiation of cellular interactions and the subsequent investigation of the induced signaling cascades on a single-cell level. It employs a dielectrophoresis (DEP)-based microfluidic system which offers contactless and accurate particle manipulation at high spatiotemporal resolution. The system enables liquid cell handling under laminar flow conditions which makes particle transport highly deterministic and manageable by automated routines. At the same time, it provides unrestricted optical access so that the induced cellular reactions can be monitored right from the stimulus application up to late events in the signaling chain. 2
1 Introduction
¯¯¯¯¯¯¯¯¯¯¯¯¯¯¯¯¯¯¯¯¯¯¯¯¯¯¯¯¯¯¯¯¯¯¯¯¯¯¯¯¯¯¯¯¯¯¯¯¯¯¯¯¯¯¯¯¯¯¯¯¯¯¯¯¯¯¯¯¯¯¯¯¯ The potential of the technique for the investigation of cell- or surface-mediated signal transduction processes was clearly shown on an important biological task. As a well-characterized example for intercellular communication, T cell activation had been chosen. The activation of T cells plays a central role in our immune system, since it is of utmost importance for the initiation and regulation of the cell-mediated immune response. The process is triggered upon contact formation with antigen-presenting cells (APC) that display foreign antigens in association with proteins of the major histocompatibility complex (MHC) on their surface. Deciphering the interrelationship between various signaling pathways involved is of high clinical interest and one of the immediate goals of cellular immunology. T cell activation is a process that spans over several hours and even days. It involves very quick responses like the mobilization of cytosolic Ca2+ within a few seconds or minutes after stimulation and Ca2+-dependent long-term reactions with time constants of hours to days, like the expression of membrane proteins. Many of the contributing signaling cascades have been identified in the last 25 years of immunological research. However, there are still a lot of missing links between the different factors which are involved in the associated events. A prominent example is the question of how signal specificity can be attained in response to a ubiquitous second messenger, such as intracellular Ca2+. Although a few publications were able to show an interrelation between the temporal profile of the Ca2+ signals and later activation events on gene- and protein expression level, it is not clear whether or not T cells are able to decode specific Ca2+ patterns into a particular functional outcome. The methods developed in this work allow for addressing this question with high reliability. For this purpose, individual T cells were stimulated by contacting them with surface-modified microbeads that mimic the activating signals of the APC. The cytosolic Ca2+ level in the cells was monitored before, during and after the contact formation procedure and related to the bead stimulation at subsecond resolution. Diligent fluidic control enabled the release of the manipulated cells from the fluidic system after Ca2+ imaging. This made them available for further cultivation and allowed for the analysis of later activation events, i.e., the expression of the activation marker molecule CD69. Since each of the cells was identifiable at any given time point of the process chain, both short- and long-term response signals of individual cells could be correlated with each other. For maintaining the vitality of the single cells during and after DEP manipulation, experimental conditions were identified that only minimally interfered with the physiology of the cells. In this context, the composition of the culture medium, the microfluidic environment and different electric field parameters like field strength, field frequency and exposure time were evaluated for their impact on the vitality and important physiological parameters like the cytosolic Ca2+ concentration or cell division.
3
2 Objective targets
¯¯¯¯¯¯¯¯¯¯¯¯¯¯¯¯¯¯¯¯¯¯¯¯¯¯¯¯¯¯¯¯¯¯¯¯¯¯¯¯¯¯¯¯¯¯¯¯¯¯¯¯¯¯¯¯¯¯¯¯¯¯¯¯¯¯¯¯¯¯¯¯¯
2
Objective targets
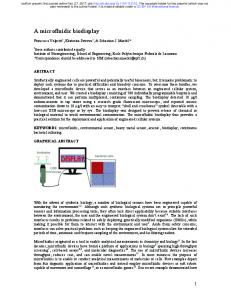
The main topic of the present study was to develop a protocol for the controlled stimulation of individual T cells with surface-modified microbeads, to analyze the induced cellular reactions at different temporal regimes and to correlate them with each other on the level of individual cells. The central biological question that was addressed by this technique was: Do short-term Ca2+ signals in stimulated T cells provide early information about a later reaction of the cell? In preliminary experiments, appropriate conditions for the cultivation of single T cells had to be identified. Moreover, establishing experimental conditions for both a successful stimulation of T cells by surface-modified microbeads and the evaluation of their activation state by live-cell staining with fluorescently labeled antibodies was a prerequisite for the successful induction of T cell activation on a single-cell level. For handling single cells and particles, a DEP-based microfluidic system was employed. In order to maintain the vitality of the cells during and after DEP manipulation, adequate conditions for their manipulation in the system had to be identified. In this context, the influence of the applied electric fields and the microfluidic environment on the vitality of the cells as well on important physiological parameters, like the cytosolic Ca2+-concentration or cell division, had to be investigated. Based on this, a protocol for the contact formation between single cells and beads in the microfluidic system was to be developed. This required selecting an appropriate chip design and microfluidic configuration. Analyzing the long-term response of the cells to the bead stimulus required their reinvestigation several hours after the contact formation. The incubation of the bead-contacted cells during that time was either possible in a cell culture plate (method 1: post-chip activation protocol) or on the DEP chip (method 2: on-chip activation protocol). The former required their successful isolation from the fluidic system after manipulation; the latter required both controlling the microchannel temperature during the incubation time and staining the bead-contacted cells with fluorescently labeled antibodies on-chip afterwards. For analyzing the short-term response, the manipulation protocol had to allow for both initiating the cell-bead contact and at the same time monitoring the cytosolic Ca2+-level of the single cells. Correlating both the short- and the long-term response of individual cells required combining the two respective manipulation protocols developed and at the same time preserving the identity of each individual cell throughout the whole experimental procedure. Fig. 2-1 gives an overview of the different aspects and defines the relationships between them.
4
Fig. 2-1: Objective targets of the present thesis. The main topic was to develop a cell handling protocol that allows for the induction of surface-mediated signal transduction processes on a single-cell level, while at the same time the induced cellular reactions can be analyzed at different temporal regimes and be correlated with each other. The global problem was subdivided into different aspects that have been worked on individually. For each aspect the respective section is specified that deals with it in detail.
¯¯¯¯¯¯¯¯¯¯¯¯¯¯¯¯¯¯¯¯¯¯¯¯¯¯¯¯¯¯¯¯¯¯¯¯¯¯¯¯¯¯¯¯¯¯¯¯¯¯¯¯¯¯¯¯¯¯¯¯¯¯¯¯¯¯¯¯¯¯¯¯¯
2 Objective targets
Fig. 2-1: Objective targets of the present thesis.
5
3 Basic principles and current state of research
¯¯¯¯¯¯¯¯¯¯¯¯¯¯¯¯¯¯¯¯¯¯¯¯¯¯¯¯¯¯¯¯¯¯¯¯¯¯¯¯¯¯¯¯¯¯¯¯¯¯¯¯¯¯¯¯¯¯¯¯¯¯¯¯¯¯¯¯¯¯¯¯¯
3
Basic principles and current state of research
3.1
Strategies to manipulate microscale objects
The analysis and manipulation of single cells is one of the most exciting research areas in the field of biomedical engineering. Single-cell manipulation is of major importance for example for in vitro fertilization, regenerative medicine as well as genomics and proteomics. The growing interest in the manipulation of single cells has led to the development of numerous technologies based on optical, chemical, mechanical, electrical, and other forces [Voldman J, 2006b]. They can be divided into contacting- and non-contacting methods the most important of which are shortly introduced in the following.
3.1.1 Contacting techniques Mechanical tweezers The most intuitive way to handle cells and particles is to just grab them with a mechanical tool like tweezers. A special challenge in this context is that the interaction forces are not to damage the sample. Kim et al. solved this problem by integrating a piezoresistive force sensor into a mechanical microgripper that provided force feedback to a controller which then adjusted the contact force in the nanonewton range [Kim K et al., 2008]. They used this tool to grasp single cells in a culture dish filled with medium and to release them at a defined position. Micropipette aspiration Micropipette aspiration is probably one of the oldest techniques for manipulating single cells. Since its invention by Marshall Barber in 1904 [Hunt TP and Westervelt RM, 2006] it has been used for over 100 years in many fields of biomedical research, including cell adhesion, microbiology and in vitro fertilization. The idea of this technique is to immobilize a single cell by suction at the tip of a hollow glass micropipette. This allows positioning the grasped cell with very high spatiotemporal resolution and in three dimensions. It has been used alone or in combination with other manipulation methods, like optical tweezers for investigating the micromechanical aspects of the interaction between cells and surface-modified microbeads [Lomakina EB and Waugh RE, 2004; Xu G and Shao JY, 2008]. Pressure-driven single-cell trapping has also been used in microfluidic devices in context with on-chip patch clamp [IonescuZanetti C et al., 2005; Ong WL et al., 2007] or cell pairing. Lee et al. used this technique for contacting two types of suspended mouse fibroblasts and monitoring juxtacrine communication [Lee PJ et al., 2005]. However, the risk of damaging the cell membrane or the cytoskeleton by suction is very high [Hunt TP and Westervelt RM, 2006]. Moreover, the technique does not provide sufficient control for cell sorting and -isolation. Cell adhesion The first step in single-cell analysis and -manipulation is selecting the cell of interest and locating it at a particular position. By taking advantage of adhesive molecules in the cell membrane, the capture of cells from a bulk suspension and their immobilization on a planar surface has been achieved by coating the surface with cell-binding molecules [Choi J et al., 1995] or antibodies [Negulescu PA et al., 1994]. Patrick et al. and Kim et al. used this technique for contacting T cells with APC or antibody-coated surfaces. For that, they artificially adhered T cells 6
3.1 Strategies to manipulate microscale objects
¯¯¯¯¯¯¯¯¯¯¯¯¯¯¯¯¯¯¯¯¯¯¯¯¯¯¯¯¯¯¯¯¯¯¯¯¯¯¯¯¯¯¯¯¯¯¯¯¯¯¯¯¯¯¯¯¯¯¯¯¯¯¯¯¯¯¯¯¯¯¯¯¯ to a coverslip and contacted it face to face with a second one that was coated with bioactive antibodies or APC [Patrick SM et al., 2000; Kim S et al., 2001]. However, unless cell adhesion and -detachment (for example, by the use of thermo-repellent surface coatings [Ernst O et al., 2007]) are controllable on the single-cell level, this approach only allows working with high cell numbers and remains too inflexible for complex manipulation tasks. Magnetic forces Except for the iron in red blood cells the vast majority of biological material does not respond to magnetic fields in any appreciable extent [Voldman J, 2006a]. This is the reason for both, the advantage and the drawback of this technique for cell manipulation. On the one hand, cells have to be labeled with para- or ferromagnetic material before they can be controlled with magnetic fields. On the other hand, this is exactly why the method is highly specific only for cells that carry this tag. The high specificity has made magnetic-activated cell sorting [Schmitz B et al., 1994] a technique widely used in immunological research. In microfluidic applications, magnetic fields have been used for cell trapping and -patterning [Lee H et al., 2004; Tanase M et al., 2005].
3.1.2 Non-contacting techniques Hydrodynamic forces In microfluidic applications, the transport of cells and particles is usually accomplished by hydrodynamic forces. The fluid flow can be driven by hydrodynamic pressure, by electroosmotic pumping [Li PC and Harrison DJ, 1997] or a combination of both [Dittrich PS and Schwille P, 2003]. However, the high-voltage DC fields used for electroosmotic pumping of aqueous solutions cause Joule heating and electrolysis at the electrodes, especially when combined with typical high-conductive cell buffers. The latter can change the pH of the medium to nonphysiological values. Both, Joule heating and pH shifts can lead to unintentional cell damage [Wheeler AR et al., 2003]. Pressure-driven flow requires the use of internal or external pumps which is cumbersome and/or expensive but completely harmless to the cells. The use of hydrodynamic forces for particle manipulation allows working at relatively high flow rates and has been used to focus, to separate [Wu ZG et al., 2007] and to sort [Dittrich PS and Schwille P, 2003] high numbers of suspended cells. Moreover, it has been shown to be suitable for selecting single cells [Wheeler AR et al., 2003; Peng XY and Li PC, 2004; Roman GT et al., 2007] and even for initiating cell-cell contacts. Very interesting approaches came from Faley et al. and Skelley et al. who used hydrodynamic barrier structures in a microfluidic channel to form pairs or conglomerates of two different cell types [Faley S et al., 2008; Skelley AM et al., 2009]. Optical trap Trapping microscale objects by radiation pressure has been first described by Arthur Ashkin who pioneered the field in the early 1970s [Neuman KC and Block SM, 2004]. He used a high-numerical aperture objective to tightly focus a laser beam which allowed him to trap a yeast cell and watch it dividing [Ashkin A et al., 1987]. The force acting on the trapped cell was due to the transfer of momentum from the scattering of incident photons. The exerted forces can exceed 100 pN with resolutions as fine as 100 aN which has made optical tweezers a powerful tool not only in biology, but also in physical chemistry and soft condensed matter physics [Grier DG, 2003]. One reason for their high applicability for single-cell manipulation is the ease to combine them with both, conventional cell culture equipment as well as microfluidic approaches [Reichle C et al., 2001; Hellmich W et al., 2005; Eriksson E et al., 2007]. Taking advantage of the extremely high spatiotemporal resolution of this technique, Wei et al. used optical forces to precisely attach antibody-coated beads to selected locations along adhered T cells and analyzed the elicited Ca2+ 7
3 Basic principles and current state of research
¯¯¯¯¯¯¯¯¯¯¯¯¯¯¯¯¯¯¯¯¯¯¯¯¯¯¯¯¯¯¯¯¯¯¯¯¯¯¯¯¯¯¯¯¯¯¯¯¯¯¯¯¯¯¯¯¯¯¯¯¯¯¯¯¯¯¯¯¯¯¯¯¯ signals [Wei XB et al., 1999]. While the possibilities for manipulating single cells offered by laser tweezers are enormous, this technique requires complex hardware and, thus, is very cost-intensive. Standing acoustic waves A very interesting technique to nonintrusively manipulate microscopic particles is ultrasonic standing waves [Hertz HM, 1995; Wiklund M et al., 2004; Wiklund M et al., 2006]. They can be formed by setting the medium in a microchannel into oscillation so that a pressure field with nodes and anti-nodes is formed between the channel walls. The pressure nodes coincide with antinodes in the oscillating fluid that constitutes the longitudinal acoustic waves. Depending on their acoustic impedance (which is a function of the density of the material and the velocity of sound in it) relative to that of the surrounding medium, objects in the channel will accumulate at either of these positions. The number and position of nodes and anti-nodes depends on the exerted field frequency and can be changed by adjusting it. Standing acoustic waves can be used for the manipulation of virtually any type of microparticle [Shi J et al., 2008] and have been shown to be very suitable for the manipulation of living cells over prolonged periods of time, even in the range of several weeks [Hultstrom J et al., 2007]. However, due to the wavelength of ultrasound in water, this technique has a low spatial resolution which makes it insufficient for complex manipulation tasks on a single-cell level. Moreover, the need for special channel geometries as well as certain acoustic reflection properties of the channel material limits the flexibility of this technique for particle manipulation in microfluidic systems. Electrophoresis Since most cells are negatively charged at neutral pH [Andersson H and van den Berg A, 2004], they are readily moving towards the anode when brought into an external electric field. This effect is called electrophoresis (EP). The force that is acting on a cell is described by
F = qE
(3.1)
where E is the applied electric field and q is the net charge of the cell. The electrophoretic velocity of the cell is a function of the medium viscosity, the electrophoretic force and its radius. It can be expressed by the electrophoretic mobility µ which is for cells in aqueous medium ca. 10-4 cm2 V-1 s-1 (approximately 1 µm s-1 in a field of 1 V cm-1, [Voldman J, 2006a]). The use of EP for cell manipulation is problematic because the applied DC currents can lead to electrochemical transformation of the medium or the electrode material at the electrode-electrolyte interface. This can corrode the electrode and contaminate the medium with toxic material. Nevertheless, it has successfully been used for the electrokinetic focusing of microparticles and erythrocytes [Xuan XC and Li DQ, 2005] or the capture of single cells from a bulk suspension in order to pattern different types of single cells onto a substrate [Toriello NM et al., 2005]. Dielectrophoretic forces The principle of DEP is only shortly exemplified here, since more exhaustive discussions of the phenomenon are available from other sources [Pohl HA, 1978; Fuhr G et al., 1994; Markx GH et al., 1996; Ramos A et al., 1998; Kentsch J et al., 2003; Duschl C et al., 2004]. While EP is an effect that occurs when an electrically charged particle is brought into a (mostly) homogeneous electric field, in DEP, a force acts on a dielectric particle in an inhomogeneous electric field (the particle may or may not carry permanent charges). The force is generated by the interaction of the external field with induced polarization charges of the suspended object and can be described by
8
3.1 Strategies to manipulate microscale objects
¯¯¯¯¯¯¯¯¯¯¯¯¯¯¯¯¯¯¯¯¯¯¯¯¯¯¯¯¯¯¯¯¯¯¯¯¯¯¯¯¯¯¯¯¯¯¯¯¯¯¯¯¯¯¯¯¯¯¯¯¯¯¯¯¯¯¯¯¯¯¯¯¯
F = q∇E
(3.2)
where q is the induced dipole moment of the cell and ∇E is the electric field gradient. The induced dipole moment of the particle depends on its radius and its permittivity, as well as the permittivity of the surrounding medium. In order to suppress electrophoretic effects and electrochemistry at the electrodes, an alternating E-field with frequencies between 100 kHz and 100 MHz is usually used for DEP [Jaeger MS, 2005]. Thus, q is time-dependent and can be expressed as
q (t ) = 4πr 3ε m f CM E (t )
(3.3)
where r is the particle radius and fCM is the well known Clausius-Mossotti factor describing the contrast between the complex permittivities of the particle and the surrounding medium, respectively. It is given by
σ p* − σ m* σ p* + 2σ m*
(3.4)
σ * = σ + iωεε 0
(3.5)
f CM =
with
which holds true for a homogeneous dielectric particle with negligible surface conductivity (such as a 10 µm polystyrene microbead, [Jaeger MS, 2005]). Here, ε0 is defined as the dielectric constant and i2 = -1. σp, m and εp, m describe the electric conductivities and permittivities of the particle and the surrounding medium, respectively [Schnelle T et al., 1999; Muller T et al., 2003]. The situation is far more complex for a biological cell with a membrane enclosing the cytoplasm, since its effective permittivity does not only depend on the properties of the cytosol but also on the membrane capacity as well as its conductivity. The exact relationship is not discussed here but has been extensively described earlier [Gimsa J et al., 1991; Mietchen D et al., 2002; Seger U, 2006]. The time-averaged DEP force that is acting on the particle can be calculated from eq. (3.2) and (3.3) and is 2 FDEP = 2πr 3ε m Re( f CM )∇E rms
(3.6)
(where rms stands for the root mean square value). Hence, the force strongly depends on the radius of the particle and the Clausius-Mossotti factor which can reach values between -0.5 and 1, as can easily be seen from eq. (3.4). Depending on a positive or a negative value of the fCM, the force is directed up (positive DEP, pDEP) or directed down (negative DEP, nDEP) the electric field gradient. This causes the particle to be attracted to (pDEP) or to be repelled from (nDEP) the electrodes, respectively. 9
3 Basic principles and current state of research
¯¯¯¯¯¯¯¯¯¯¯¯¯¯¯¯¯¯¯¯¯¯¯¯¯¯¯¯¯¯¯¯¯¯¯¯¯¯¯¯¯¯¯¯¯¯¯¯¯¯¯¯¯¯¯¯¯¯¯¯¯¯¯¯¯¯¯¯¯¯¯¯¯ In Fig. 3-1, fCM is plotted as a function of the electric field frequency for a mammalian cell (A) or a polystyrene bead (B) suspended in aqueous solutions of various electric conductivities.
Fig. 3-1: Real part of the Clausius-Mossotti factor for (A) a mammalian white blood cell and (B) a 10 µm polystyrene microbead. The calculation of fCM for the cell was based on the protoplast model described in [Seger U, 2006] with radius r = 5 µm, membrane capacitance Cm = 16.3 mF m-2, as well as the cell and medium interior relative permittivities and electric conductivities εc = 75, σc = 0.75 S m-1, εm = 78 and σm = 0.1 … 1.4 S m-1, respectively (according to [Huang Y et al., 1997] and [Jaeger MS, 2005]). (B) The calculation of fCM for the polystyrene bead was carried out according to eq. (3.4) and (3.5) with the bead permittivity and conductivity σb = 0.8 mS m-1 and εb = 2, respectively [Jaeger MS, 2005].
In cell culture medium with a conductivity of ca. 1.4 S m−1, cells and polystyrene beads exhibit nDEP at any field frequency given. While in the frequency range shown the manipulation of cells with pDEP requires the medium to have a decreased conductivity below 1 S m-1, the polystyrene beads do not experience pDEP at all. Thus, the use of nDEP is inevitable for manipulating cells and beads simultaneously. In order to make DEP cell handling as gentle as possible, the frequency used should be as high as possible. This minimizes field-induced effects like shifts of the membrane potential (see below). On the other hand, the frequency should be sufficiently low to achieve a DEP force as strong as possible. A good compromise is the use of radio frequency fields in the lower MHz range, as can be seen from Fig. 3-1 A. While cells or other objects are automatically shifted to the position of the highest field strength when manipulated by pDEP, the opposite is the case with nDEP. Since local Joule heating and field-induced membrane depolarization is proportional to the square of the applied electric field strength, the use of nDEP for manipulation minimizes the impact on the cell physiology. This makes manipulating living objects with nDEP advantageous compared to their manipulation with pDEP. DEP is a potent tool for the label-free manipulation of microscale objects and has been widely used in biomedical applications, predominantly for sorting and separating bulk cell suspensions [Muller T et al., 2000; Braschler T et al., 2005; Wang L et al., 2007; Boettcher M et al., 2008; Braschler T et al., 2008], but also for handling and analyzing single cells. Chiou et al. employed light-patterned electrodes for the parallel manipulation of single cells by high resolution DEP [Chiou PY et al., 2005]. Yin et al. used a microchannel-associated pDEP-based cell trapping system for patterning pairs of temporarily suspended human umbilical vein cells [Yin ZZ et al., 2008]. Since pDEP must be performed in non-physiological media with low electric conductivity to guarantee that the cells are more polarizable than the surrounding media ([Mittal N et al., 2007], Fig. 3-1 A), it can only be 10
3.2 Effects of electric fields on cells
¯¯¯¯¯¯¯¯¯¯¯¯¯¯¯¯¯¯¯¯¯¯¯¯¯¯¯¯¯¯¯¯¯¯¯¯¯¯¯¯¯¯¯¯¯¯¯¯¯¯¯¯¯¯¯¯¯¯¯¯¯¯¯¯¯¯¯¯¯¯¯¯¯ used for short manipulation- or positioning tasks of non-adherent cells like T lymphocytes. In contrast, Reichle et al. used a combination of nDEP and laser tweezers for contacting a biotinylated blood cell with a streptavidin-coated microbead and studied the induced receptor-ligand interactions [Reichle C et al., 2001]. In the present work, the spectrum of possible applications of DEP-based microfluidic systems was extended to complex manipulation tasks. Taking advantage of the possibility to contactlessly manipulate live cells at very high spatiotemporal resolution offered by DEP, a protocol was developed for the precisely controlled initiation of cell-cell or cell-surface contacts on a single-cell level. This was not only motivated by advancing technological progress but was also pursued with the perspective of a clear biomedical application. Hence, cell biological signaling cascades triggered by the initiated particle contact were investigated at a statistically relevant sample size. This issue will be picked up again later in this chapter.
3.2
Effects of electric fields on cells
The electrokinetic manipulation of cells necessitates detailed knowledge of the influence of the Efield on the cell physiology. A large number of electromagnetic field-induced effects on cell growth and animal physiology have been described in literature [Glasser H and Fuhr G, 1998], including changes in the ion exchange over cell membranes, or effects on the immune response [Bernhardt JH, 1992]. However, at the frequencies used for DEP manipulation – hundreds of kHz to tens of MHz – the relevant effects are primarily due to thermal stress by ohmic warming and electric field-induced shifts of the membrane potential [Voldman J, 2006a].
3.2.1 Joule heating When an electric potential drops over a conductor, electric energy is converted into heat. The amount of heat generation is a function of the applied electric field and the electric conductivity of the medium between the electrodes (i.e., the cell culture medium in the microchannel). Care has to be taken, when living cells are exposed to these electric fields, since ambient temperatures > 4 °C above physiological ones can lead to protein denaturation and rapid mammalian cell death [Voldman J, 2006a]. Moreover, warming can also influence the kinetics of biochemical processes in cells and trigger the synthesis of a small number of highly conserved proteins, the heat-shock proteins (hsps) [Lindquist S, 1986]. Their expression is a universal response to environmental stress factors that affect the tertiary structure of proteins or have adverse effects on the cellular metabolism like heat, heavy metals, ethanol, ozone, glucose starvation, anoxia and even pathogens like viruses and bacteria [De Maio A, 1999]. In mammals, the hsps are expressed at body temperatures above 41 °C and immediately translated with very high efficiency, so that several thousand transcripts are present per cell within one hour [Lindquist S, 1986]. The importance of these proteins for the cell for dealing with environmental stress is highlighted by the high number of gene repeats coding for the same hsps (e.g. hsp70) which are located on different chromosomes. Reporter cell lines expressing GFP under the control of a heat shock element promoter construct have been used to quantify the impact of several electric field parameters, like frequency, field strength and exposure time, on the cell physiology at a molecular level [Desai SP and Voldman J, 2008]. 11
3 Basic principles and current state of research
¯¯¯¯¯¯¯¯¯¯¯¯¯¯¯¯¯¯¯¯¯¯¯¯¯¯¯¯¯¯¯¯¯¯¯¯¯¯¯¯¯¯¯¯¯¯¯¯¯¯¯¯¯¯¯¯¯¯¯¯¯¯¯¯¯¯¯¯¯¯¯¯¯
3.2.2 Transmembrane voltage Exposing a cell to an electric field induces a dipole in the cell which leads to a voltage-drop over the membrane. In the AC case, this voltage-drop is frequency-dependent and superimposes on the resting potential of the cell of ca. -65 mV [Winslow MM and Crabtree GR, 2005]. It oscillates with the external electric field and can be described according to Glaser [Glaser R, 2001] as
ΔΨ ind = 1.5 E r
1 ⎛ ⎛ 1 1 + 1 + ⎜⎜ 2 π f r C ⎜⎜ ⎝ σ in 2 σ out ⎝
⎞⎞ ⎟⎟ ⎟ ⎟ ⎠⎠
2
(3.7)
where ΔΨind is the induced voltage drop, E is the external electric field strength, f is the field frequency, r is the radius of the cell, C is the membrane capacitance and σin and σout are the electric conductivities of the cytosol and the external medium, respectively. Since the transmembrane voltage regulates the function of numerous membrane proteins such as ion channels, transporters, pumps and enzymes [Bezanilla F, 2008], the induced potential shifts can trigger ion flux across the membrane or activate signaling cascades in the cell. For example, the activities of the cholinergic G protein-coupled receptors m1r (muscarinic receptor 1) and m2r are increased or decreased, respectively, as a function of the membrane potential [Bezanilla F, 2008]. Dal Maschio et al. observed slowly and progressive membrane depolarization and Ca2+ release from intracellular stores in muscle fibers upon electric field exposure in the MHz range (between 4 and 64 MHz, [Dal Maschio M et al., 2009]). It also has been reported that radio frequency electric fields can activate the cellular stress response and interact with cell signaling pathways like the MAPK (mitogen-activated protein kinase) signaling cascade [Blank M and Goodman R, 2009]. Another electric field-membrane coupling mechanism is electroporation. It describes the transient increase in the permeability of membranes for ions and molecules when exposed to a high electric field [Chen C et al., 2006]. Electroporation is the consequence of structural rearrangements in the lipid bilayer and mainly occurs at elevated trans-membrane voltages above 0.2 - 1 V [Weaver JC, 2000]. While prolonged electric pulses can lead to membrane breakdown and cell death, much shorter pulses at the same field strength and in the order of milliseconds to microseconds cause reversible high-conductance states that rapidly discharge the membrane before it can rupture [Weaver JC, 2003]. Although these E-field-induced pores dramatically increase the ionic and molecular transport across the membrane by orders of magnitude [Weaver JC, 2003], they rapidly reseal without affecting cell viability to a marked extent [Markx GH, 2008]. Their size can vary between 1 nm and more than 1 µm [Weaver JC, 2003] and their formation has been reported to depend on several electric field parameters like field strength, pulse duration and exposure time of the cells to the electric field [Maswiwat K et al., 2008]. However, the physical mechanism underlying electroporation still lacks a comprehensive theoretical basis and is discussed controversially. Several models for the molecular processes involved have been proposed of which the most widely accepted is the transient aqueous pore hypothesis [Abidor IG et al., 1978; Weaver JC, 2003; Chen C et al., 2006]. The basic assumption is to consider the cell membrane as a metastable system with a positive surface tension (energy per unit area). From this, it follows that intact membranes have a higher free energy than perforated 12
3.2 Effects of electric fields on cells
¯¯¯¯¯¯¯¯¯¯¯¯¯¯¯¯¯¯¯¯¯¯¯¯¯¯¯¯¯¯¯¯¯¯¯¯¯¯¯¯¯¯¯¯¯¯¯¯¯¯¯¯¯¯¯¯¯¯¯¯¯¯¯¯¯¯¯¯¯¯¯¯¯ ones. The creation of a circular pore changes the free energy of the membrane system in two ways: (i) its surface energy decreases as a square function of the pore radius (r2). (ii) The edge energy along the circumference of the pore increases linearly with r, since the creation of a circular rim under strain requires work. Because, for small pores, the latter term is pivotal, thermal fluctuations may result in the random and transient creation of pores, but the probability of surmounting the barrier energy increases with increased radius [Chen C et al., 2006]. Including a membrane potential in the system provides an additional contribution to the defect formation energy. As a capacitor, the membrane stores electrical energy which is proportional to its capacitance and the membrane potential to the square. Assuming that a spontaneously created pore rapidly fills with water, this changes the dielectric properties of the membrane at this location. As a consequence, the membrane capacitance changes as a function of r2 and with that the free energy of the electric field. This leads to the pore creation probability increasing non-linearly with increasing membrane potential. The stochastic pore hypothesis described above is consistent with findings of electroporation experiments in planar lipid bilayers. These have established a stochastic rupture of the membrane and a critical transmembrane voltage at which the probability of rupture becomes large [Chen C et al., 2006]. As biological membranes include proteins and cytoskeletal elements, the situation is more complex in cells, but for the basic elements of the theory, the effects of protein inclusion can be neglected.
3.2.3 Analysis of the field influences on cells For the detection of electric field influences, cells can be and have been examined for numerous vitality parameters. The most important are cell growth, division rates, viability, cell motility or other endpoints integrating responses from a large number of pathways [Glasser H and Fuhr G, 1998; Voldman J, 2006a]. Dal Maschio et al. used fluorescent dyes for analyzing E-field induced shifts of the membrane potential and the cytosolic Ca2+ concentration in muscle cells [Dal Maschio M et al., 2009]. Prominent tools for revealing harmful effects of electric field exposure include live- and dead-cell markers like trypan blue, propidium iodide or fluorescein diacetate. Glasser et al. detected the loss of membrane integrity in context with DEP manipulation by fluorescent dye uptake in mouse fibroblasts [Glasser H and Fuhr G, 1998]. Desai et al. analyzed field-induced cellular stress on the gene expression level [Desai SP and Voldman J, 2008]. In numerous studies, DEP manipulation of living cells has been shown to not cause major harm to the cells [Glasser H and Fuhr G, 1998; Jaeger MS et al., 2008; Kortmann H et al., 2009]. However, the same authors also demonstrate that there are only small windows for the electric field parameters that allow working at physiologically tolerable conditions. Moreover, surveys in different contexts showed that even radio-frequency fields can influence the behavior of living cells [Blank M and Goodman R, 2009; Dal Maschio M et al., 2009]. This shows that there is no binary answer to the question of whether DEP manipulation alters the cell physiology or not. Instead, it depends on (i) the tested cell type, (ii) the analyzed cellular response, (iii) the experimental setup and (iv) the characteristics of the applied electric field. For this reason, an important topic of the present study was to investigate the impact of the DEP fields on (single) T cells in context of the experimental setup used for their manipulation. Tolerable 13
3 Basic principles and current state of research
¯¯¯¯¯¯¯¯¯¯¯¯¯¯¯¯¯¯¯¯¯¯¯¯¯¯¯¯¯¯¯¯¯¯¯¯¯¯¯¯¯¯¯¯¯¯¯¯¯¯¯¯¯¯¯¯¯¯¯¯¯¯¯¯¯¯¯¯¯¯¯¯¯ exposure times were investigated as well as the influence of the field strength and the field frequency on several biomarkers of the cells, the latter of which included morphological changes, cell division, endpoint analysis of cell signaling cascades and cytosolic Ca2+ signals.
3.3
The benefits of miniaturization
3.3.1 Benefits for liquid cell handling The most noticeable characteristic of liquids that are manipulated on the microscale is the laminarity of flow. In laminar flow, the streamlines of the fluid are purely deterministic and do not intersect, so that mass transport can be precisely calculated as a function of time. Whether a liquid is transported in a channel by laminar or turbulent flow can be assessed by calculating the Reynolds number. This dimensionless characteristic is described by
Re =
ρvd η
(3.8)
where ρ is the fluid density, v is the fluid velocity, η is its viscosity and d is the characteristic length of the system, which is the diameter for circular conduits and the hydraulic diameter Dh for rectangular systems. Dh depends on the cross-sectional geometry of the channel and is defined as
Dh =
4A L
(3.9)
[Beebe DJ et al., 2002] where A is the cross-sectional area and L is the perimeter of the channel. Laminar flow in fluidic systems is indicated by small Reynolds numbers (< 2300). As Re approaches 2300, the fluid starts to show signs of turbulence and is completely chaotic at values > 2300 [Beebe DJ et al., 2002]. In microfluidic devices, the Reynolds number is generally < 0.1 [Roman GT et al., 2007]. For a water-filled microchannel as it was used in the present work, Remax = 0.035 at a maximum fluid flow of v = 7.4 × 10⁻⁴ m s-1 (≙ 120 µl h-1), A = 4.5 × 10⁻⁸ m2 (≙ 30 µm × 1500 µm), L = 3.1 × 10⁻³ m, ρ = 1.0 ×10⁶ g m-3 and η = 1.0 g m-1 s-1. One can take advantage of these laminar flows by e.g. (i) precisely transporting cells and particles through the microfluidic system or (ii) hydrodynamically focusing a microparticle suspension to the middle of a channel by two outer sheath flows of higher flow rate (see Fig. 3-2 A). The latter is widely used in cytometry and fluorescence-activated cell sorting to precisely align hundreds and thousands of cells per second so that they cross a laser beam. The parallel introduction of different fluids streams into a microchannel has also been used for patterning of the cell culture substrate with different proteins, the patterning of different types of cells adjacent to each other (see Fig. 3-2 B) or the patterned delivery of chemicals to adhered cells [Takayama S et al., 1999]. Laminar flow-based applications even have been used for the local delivery of drugs to a selected part of a single cell [Takayama S et al., 2003]. 14
3.3 The benefits of miniaturization
¯¯¯¯¯¯¯¯¯¯¯¯¯¯¯¯¯¯¯¯¯¯¯¯¯¯¯¯¯¯¯¯¯¯¯¯¯¯¯¯¯¯¯¯¯¯¯¯¯¯¯¯¯¯¯¯¯¯¯¯¯¯¯¯¯¯¯¯¯¯¯¯¯ However, when working with patterned fluids one has to consider that diffusive mixing occurs between streams that flow in contact with each other (see Fig. 3-2 C). Diffusion is a timedependent process which is driven by the natural Brownian movement of any particle. In one dimension,
〈 x 2 〉 = 2 Dt
(3.10)
establishes a relation between the average distance x a particle moves in a time t. D is the diffusion coefficient of the particle in a particular medium. It is a function its radius r, the Boltzmann constant kB, the ambient temperature T and the viscosity η of the surrounding medium. It can be expressed by
D=
k BT 6πηr
(3.11)
Since the time it takes a particle to travel a given distance is directly proportional to the square of that distance, diffusive material transport is usually negligible in the macroscopic world but becomes very important on the microscale. This is why microfluidic systems have been used for creating defined concentration gradients at the cellular level and for moving these gradients in time and space. Especially for the investigation of chemotaxis and oriented signaling, the ability to generate highly defined concentration gradients is extremely beneficial. Many of the cell migration studies now performed routinely were simply not possible without this technique [Breslauer DN et al., 2006; Sims CE and Allbritton NL, 2007]. When a fluid is pumped through a channel at a given pressure gradient Δp, its flow rate is limited by the flow resistance which is due to the no-slip condition at the channel walls and cohesive forces between the molecules of the liquid. The description of pressure-driven flow Q is a solution of the Navier-Stokes equation and is given by the law of Hagen-Poiseuille with
Q=
wh 3 Δp 12ηL
(3.12)
for a rectangular microchannel with a high aspect ratio between its width w and its height h. L describes the length of the channel, Δp stands for the pressure gradient and η is the viscosity of the medium. The same principles underlying the hydrodynamic resistance are also responsible for the liquid having a parabolic-shaped flow profile while being actively pumped through the channel. The highest flow velocity is in the middle of the channel, with decreasing values towards the channel walls (see Fig. 3-2 D). For microfluidic particle handling, this is both, a blessing and a curse. On the one hand, this non-uniform velocity field can be used to separate particles that are moving at different distances from the channel walls. The term for this technique is (flow-) field flow fractionation and has been used for e.g. separating particles very quickly and effectively according to their size [Wu ZG et al., 2007]. On the other hand, the broadening of plugs of sample along the channel is impedimental but unavoidable when small packages of particles or solutions
15
3 Basic principles and current state of research
¯¯¯¯¯¯¯¯¯¯¯¯¯¯¯¯¯¯¯¯¯¯¯¯¯¯¯¯¯¯¯¯¯¯¯¯¯¯¯¯¯¯¯¯¯¯¯¯¯¯¯¯¯¯¯¯¯¯¯¯¯¯¯¯¯¯¯¯¯¯¯¯¯ are to be transported (for example, in context with electrophoretic DNA separation in a microchannel).
Fig. 3-2: Microfluidic phenomena emerging from laminar flow conditions in a microchannel. (A) Hydrodynamic focusing. A solution of a Ca2+-senitive dye is flushed into the central channel while at the same time CaCl2 solution is injected into the adjacent inlets at much higher flow rate. The dye solution is focused by the sheath flow and starts to fluoresce at the liquid boundary [Park HY et al., 2006]. (B) Patterned cell culture. First, solutions of protein x and protein y are allowed to flow from the designated inlets into the main channel which creates a micro-patterned surface. The channel is then filled with cells specifically binding to protein x. Non-adherent cells are removed by washing with PBS [Takayama S et al., 1999]. (C) Concentration gradient in a microchannel. Two solutions are moving in parallel in a microchannel. Due to the laminar flow condition, mixing between them occurs only by diffusion. The steepness of the resulting concentration gradient depends on the diffusion time and, thus, is a function of the position along the microchannel. (D) Parabolic velocity profile of pressure-driven flow. Due to the friction of the fluid at the channel walls, the highest fluid velocity occurs at the center of the channel. Such velocity fields can be used for separating particles according to their size (i.e., flow field flow fractionation).
3.3.2 Benefits for dielectrophoretic cell handling To understand the benefits of miniaturization for DEP particle handling, it is essential to realize how the DEP force scales with size. As described above, FDEP is proportionally to the gradient of the applied electric field to the square. Since the gradient of an E-field depends on its propagation in the three-dimensional space, it increases inversely proportional to the third power of the length L that characterizes electric field variations [Voldman J, 2006a]. Thus,
FDEP
E2 ~ 3 L
(3.13)
In other words: The smaller the scale on which DEP is exerted, the lower the electric field required for generating a given DEP force. This has an important implication for the manipulation of biological objects which are very sensitive to the ambient temperature. Since the local power dissipation (Ohmic heating) per volume element in an AC field is a function of the local electric field strength to the square and the electric conductivity of the interjacent medium [Gimsa J and Haberland L, 2005], miniaturization enables the use of highly conductive solutions for DEP cell handing, such as standard cell-culture media. 16
3.3 The benefits of miniaturization
¯¯¯¯¯¯¯¯¯¯¯¯¯¯¯¯¯¯¯¯¯¯¯¯¯¯¯¯¯¯¯¯¯¯¯¯¯¯¯¯¯¯¯¯¯¯¯¯¯¯¯¯¯¯¯¯¯¯¯¯¯¯¯¯¯¯¯¯¯¯¯¯¯ However, the temperature rise in a given volume V due to ohmic warming is not only a function of the thermal power converted at the electrodes but also depends on heat dissipation from that volume to its environment. Since microscale systems have a large surface area to volume ratio, the removal of excess heat by thermal conduction is extremely efficient. For example, the time constant for the thermal relaxation in context with electric field exertion is about 600 ms in the microdevices used in the present work [Jaeger MS, 2005].
3.3.3 Benefits for single-cell analysis The potential of microfluidic approaches for single-cell analysis is tremendous. Adjusting the size of the manipulation platform to that of a cell offers unprecedented opportunities for cell handling and opens up a broad spectrum of novel opportunities for experimental designs. Besides the possibilities that emerge from the microscale physics mentioned above, practical issues of miniaturizing enable powerful applications for cell biology research and are discussed in the following. The possibility to use and to manipulate very small quantities of samples and (possibly expensive) reagents (i) reduces cost and (ii) allows for the stimulation of cellular reactions at near physiological concentrations. For example, the dilution of signaling factors secreted by cells is strongly reduced in microfluidic systems. This provides triggering paracrine communication between individual cells and has been utilized for the investigation of Ca2+ mobilization in T lymphocytes elicited by soluble factors of dendritic cells [Faley S et al., 2008]. Moreover, the lowloss sample handling has been used to collect the content from a single cell (i.e., proteins, DNA or RNA) and, if necessary, to amplify it for detection [Hong JW et al., 2004; Hellmich W et al., 2006; Ros A et al., 2006]. At the same time, the risk of contaminating the probe with material from other cells can be kept at a minimum. The extraordinary experimental charge involved with analyzing small target objects with large instruments is particularly evident in context with the traditional patch clamp technique. Despite of its success, it requires complex and expensive setups and remains highly laborious to prevent loss of seal integrity between the cell membrane and the glass capillary due to mechanical vibration of the pipette tip. In microfluidic devices, the cell substrate and the recording capillary can be mechanically bonded which eliminates the need for external positioning devices and minimizes the effects of ambient vibration [Ionescu-Zanetti C et al., 2005]. Microfluidic devices also offer a high potential for integrating many steps for sample handling into an automated format. This allows the parallelization of manipulation protocols and, thus, provides high-throughput analysis of single cells. Moreover, the miniaturization of established techniques for handling and examining single cells enables to combine different manipulation protocols on a single analysis platform. These systems might allow achieving high throughput in context with a dynamic multi-parameter analysis of single cells. Despite of the breathtaking precision, throughput and complexity offered by microfluidic applications for single-cell manipulation, most devices lack an acceptable methodology for low volume delivery of cells or reagents [Breslauer DN et al., 2006]. This makes it difficult to combine them with established methodologies. However, raising a broader interest in the life science community will require a possibility to make the cells available for a large spectrum of standard 17
3 Basic principles and current state of research
¯¯¯¯¯¯¯¯¯¯¯¯¯¯¯¯¯¯¯¯¯¯¯¯¯¯¯¯¯¯¯¯¯¯¯¯¯¯¯¯¯¯¯¯¯¯¯¯¯¯¯¯¯¯¯¯¯¯¯¯¯¯¯¯¯¯¯¯¯¯¯¯¯ downstream analyses after their manipulation. This is why an important part of this work was focused on establishing a sheath flow-based protocol for the release of single cells from the microfluidic device after their manipulation and to thoroughly investigate the efficiency of singlecell isolation by that procedure.
3.4
T cell activation
3.4.1 The role of T cells in our immune system The history of the exploration of the human immune system starts with a British farmer in the late 18th century, Benjamin Jesty. It was the time of the big smallpox epidemic in 1774 when he noticed that milkmaids did not become infected with that disease. So he took cowpox material from an infected cow and inoculated his wife and children. The big success of this method was recognized by the medical doctor Edward Jenner who later became famous for his description of the first smallpox vaccination (vaccinus: “of cow”). Today, smallpox has been completely eradicated and we know that the adaptive immunity described by Edward Jenner is mediated by a part of the white blood cells, the B and T lymphocytes that protect our body not only from the smallpox virus, but pathogens of every description. An adaptive immune reaction against invading pathogens is characterized by both, the humoral and the cellular immunity. The former is mediated by plasma cells (which are differentiated B lymphocytes) producing antibodies against the pathogen. The latter is mediated by CD8+ cytotoxic T lymphocytes (CTL) which destroy virus-infected host cells by driving them to apoptosis. Both, the humoral and the cellular immunity are mediated or regulated by complex cellular interactions with a special type of T lymphocytes, the CD4+ T helper cells. Before these cells can perform their task, they have to be activated by APCs. In this context, the T cell recognizes a specific antigen which is displayed by a protein of the MHC present in the cell membrane of the APC. This triggers a multitude of signaling events which finally lead to the activation of the T cell (provided the engagement of costimulatory signals). The elucidation of the involved signaling cascades is of paramount importance for a comprehensive understanding of the basic principles underlying the adaptive immunity. The most important pathways are shortly reviewed in the following.
3.4.2 Signal transduction downstream of the T cell receptor (TCR) The central molecule and starting point of T cell activation is the TCR (see Fig. 3-3). It is a multisubunit complex that comprises at least six polypeptides [Baniyash M, 2004]. The α and β chains are connected by disulfide bonds and carry a (hyper-) variable region at their extracellular N-terminus. This region is responsible for the recognition of antigens that are displayed on the surface of APCs in the context of MHC molecules. It is encoded in gene segments that undergo somatic recombination during T cell development to generate an enormous antigen-binding diversity of ca. 107 different TCR species [Stryer L, 1994]. Although responsible for antigen recognition, it is not the αβ heterodimer that transmits the signal across the cell membrane into the 18
3.4 T cell activation
¯¯¯¯¯¯¯¯¯¯¯¯¯¯¯¯¯¯¯¯¯¯¯¯¯¯¯¯¯¯¯¯¯¯¯¯¯¯¯¯¯¯¯¯¯¯¯¯¯¯¯¯¯¯¯¯¯¯¯¯¯¯¯¯¯¯¯¯¯¯¯¯¯ inner of the cell. Instead, this is accomplished by the non-polymorphic CD3 molecule which is non-covalently associated with the α and β chains of the TCR and obligatorily coexpressed with these proteins [Smith-Garvin JE et al., 2009]. It is formed by a series of dimers including γε, δε, and ζζ chains that are associated with a single αβ heterodimer. Each of the chains is composed of a short extracellular domain followed by a long intracellular tail that contains three immunoreceptor tyrosine-based activation motifs (ITAMs), which undergo tyrosine phosphorylation upon TCR engagement [Baniyash M, 2004].
Fig. 3-3: Signal transduction upon TCR engagement. Ligation of the TCR triggers the activation of the receptor-associated tyrosine kinase Lck. This protein phosphorylates the ζ-chains of the TCR at tyrosine residues present in ITAMs (immunoreceptor tyrosine-based activation motifs). This leads to activation of the protein tyrosine kinase ZAP70 (ζ chain-associated protein kinase of 70 kDa). This ultimately results in the activation of phospholipase C (PLC-γ1) which generates inositol-1,4,5trisphosphate (InsP3) and diacylglycerol (DAG) from hydrolyzing phosphatidylinositol-4,5bisphosphate (PtdIns(4,5)P2). InsP3 induces the release of Ca2+ from intracellular calcium stores which triggers the opening of calcium release-activated calcium (CRAC) channels in the plasma membrane. As a consequence, the cytosolic Ca2+ concentration is perpetually elevated. This activates the calmodulin-dependent phosphatase calcineurin. Activated calcineurin dephosphorylates nuclear factor of activated T cells (NFAT) proteins that are subsequently translocated into the nucleus and bind to the DNA. Here, they help to reorganize gene expression in the T cell which leads to its activation. For further details, see text. LAT, linker for the activation of T cells; PI3K, phosphoinositide 3-kinase; MAPK, mitogen-activated protein kinase; PKC-Θ, protein kinase C-Θ; 19
3 Basic principles and current state of research
¯¯¯¯¯¯¯¯¯¯¯¯¯¯¯¯¯¯¯¯¯¯¯¯¯¯¯¯¯¯¯¯¯¯¯¯¯¯¯¯¯¯¯¯¯¯¯¯¯¯¯¯¯¯¯¯¯¯¯¯¯¯¯¯¯¯¯¯¯¯¯¯¯ GSK3, glycogen synthase kinase 3; CK1, casein kinase 1; NF-κB, nuclear factor-κB; AP-1, activator protein 1; IL-2, interleukin 2. Modified from [Baniyash M, 2004; Macian F, 2005; Hayashi T et al., 2007].
This is mediated by the protein tyrosine kinases Lck and Fyn that are recruited to the cell membrane and activated following TCR ligation. Although the exact mechanism of Lck activation is unclear, it is known that the protein is associated with CD4 (in T helper cells) or CD8 (in CTL) that both bind to the same MHC molecule as that engaged by the TCR. Holdorf et al. assumed that CD4 facilitates the rapid recruitment of Lck to the T cell-APC interface and mediates its transient autophosphorylation [Holdorf AD et al., 2002]. The phosphorylated ITAMs of CD3 recruit the protein-tyrosine kinase ZAP70 (ζ chain-associated protein kinase of 70 kDa) which leads to a cascade of phosphorylation events. Among the most important targets of ZAP70 are the transmembrane adapter protein LAT (linker for the activation of T cells) and SLP-76 [Smith-Garvin JE et al., 2009]. Phosphorylation of these proteins leads to formation of the proximal signaling complex (PSC) from PLC-γ1 (phospholipase C), SLP-76, GADS and LAT. This, in turn, triggers the reorganization of the cytoskeleton and stimulates the PLC-γ1 which activates three different signaling pathways, one of which is (directly) Ca2+ dependent. The activated PLC-γ1 hydrolyzes the membrane lipid phosphatidylinositol-4,5-bisphosphate (PtdIns(4,5)P2), thereby producing the second messengers InsP3 (inositol-1,4,5-trisphosphate) and DAG (diacylglycerol). DAG activates two major pathways involving the GTP-binding protein Ras and the DAG-dependent isoform of the protein kinase C family, PKC-Θ. The activation of Ras initiates a MAPK activation cascade that leads to the stimulation of the activator protein-1 (AP-1) transcription complex which plays an important role in many proliferative reactions [Foletta VC et al., 1998]. The second major signaling pathway regulated by DAG is mediated by PKC-Θ and leads to the translocation of the nuclear factor κB (NF-κB) transcription factor into the nucleus. The InsP3 generated by TCR-stimulated PLC-γ1 activity stimulates the Ca2+-permeable ion channel receptor IP3R on the endoplasmic reticulum (ER) membrane, leading to the release of ER Ca2+ stores into the cytoplasm [Smith-Garvin JE et al., 2009]. This initial increase of the intracellular Ca2+ concentration triggers the opening of calcium-release-activated calcium (CRAC) channels in the plasma membrane, leading to a sustained increase in the cytosolic Ca2+ level. Ca2+ binds to the 17 kDa protein calmodulin which is regulatory associated with numerous enzymes and adjusts their activity in a Ca2+-dependent manner. One of these enzymes is the proteinphosphatase calcineurin. Activated calcineurin dephosphorylates the nuclear factor of activated T cells (NFAT), which thereupon exposes its nuclear-localization signal (NLS) and is translocated into the nucleus [Macian F, 2005]. The transcription factors AP-1, NF-κb and NFAT all bind (either alone or in combination with other proteins) to the DNA and promote the expression of genes important for T cell activation. While AP-1 regulates the expression of the very early activation antigen CD69 [Castellanos MC et al., 1997], NFAT promotes the expression of interleukin 2 (IL-2) which is the major T cell growth and proliferation factor. NFAT also interacts with other transcriptional partners and, thus, integrates Ca2+ signaling with other signaling pathways on the epigenetic level.
20
3.4 T cell activation
¯¯¯¯¯¯¯¯¯¯¯¯¯¯¯¯¯¯¯¯¯¯¯¯¯¯¯¯¯¯¯¯¯¯¯¯¯¯¯¯¯¯¯¯¯¯¯¯¯¯¯¯¯¯¯¯¯¯¯¯¯¯¯¯¯¯¯¯¯¯¯¯¯ Although the precise role of the surface marker CD69 has not yet been elucidated, it is assumed to have immunoregulatory functions, since crosslinking of CD69 leads to the secretion of the antiinflammatory cytokine TGF-β (transforming growth factor) in CD4+ T cells [Sancho D et al., 2005]. In contrast, IL-2 is a proinflammatory cytokine which is secreted by the activated T cell. The factor acts in an autocrine fashion as part of a positive feedback loop by binding the IL-2 receptor on the surface of the T cell from which it was produced. Indeed, IL-2 can also act on neighboring cells leading to their clonal expansion and production of other proinflammatory cytokines, such as TNF-α (tumor-necrosis factor).
3.4.3 Costimulation A central axiom of T cell activation is that an isolated stimulation of the TCR results in a nonresponsive state (anergy) in which T cells are refractory to restimulation [Smith-Garvin JE et al., 2009]. Instead, the costimulation of other cell surface receptors provides additional signals that prevent the cell from an anergic state and lead to productive T cell activation [Beier KC et al., 2000]. Although many cell surface receptors have been identified to be important regulators of an immune reaction [Hutloff A et al., 1999], CD28 was the first one shown to function as a costimulatory receptor [Frauwirth KA and Thompson CB, 2002] and does so more robustly than any other [Smith-Garvin JE et al., 2009]. Binding of CD28 to its ligands CD80 or CD86 on APCs activates the phosphoinositide 3-kinase (PI3K) which induces activation of a MAPK and, thus, promotes the production of AP-1 [Parry RV et al., 2003]. Additionally, PI3K is coupled to the activation of AKT. AKT negatively regulates the maintenance kinase GSK3 (glycogen synthase kinase 3) which helps – together with the casein kinase 1 (CK1) – to maintain NFAT in a phosphorylated state and, thus, mediates its nuclear export. Besides prolonged NFAT nuclear localization and AP-1 promotion, CD28 stimulation has been shown to enhance both, the nuclear translocation of NF-κB and the Ca2+ flux triggered by CD3 engagement [Macian F, 2005; SmithGarvin JE et al., 2009].
3.4.4 In vitro activation of T cells The stimulation of T cells in vitro can be achieved by a series of techniques of which the most common are shortly introduced in the following. The method that comes closer to the physiological situation in vivo than many others is the stimulation of primary T cells with APCs. For that, the APCs are incubated in a solution of antigen which makes them take up the respective peptides and present them on their cell surface. Mixing the T cells and the loaded APC will result in contact formation between the two cell types, so that the signal cascades described in section 3.4.2 get triggered. However, the T cells must be able to recognize the antigen used for APC loading. For this, the T cells have to be isolated from a transgenic animal expressing only TCR of single, known antigen specificity. Another possibility to stimulate T cells in vitro is by exposing them to a cocktail of the phorbolester PMA (which activates PKC-Θ) and the ionophore ionomycin that leads to Ca2+ flux across the cell membrane. This activates the most important of the biochemical pathways described here and is often used for the stimulation of cells expressing reduced amounts of TCR and CD3 proteins. 21
3 Basic principles and current state of research
¯¯¯¯¯¯¯¯¯¯¯¯¯¯¯¯¯¯¯¯¯¯¯¯¯¯¯¯¯¯¯¯¯¯¯¯¯¯¯¯¯¯¯¯¯¯¯¯¯¯¯¯¯¯¯¯¯¯¯¯¯¯¯¯¯¯¯¯¯¯¯¯¯ TCR engagement by MHC-associated antigens can also be mimicked by crosslinking the TCR complexes directly. This can be achieved by lectins like phytohemagglutinin (PHA) that bind to specific cell surface carbohydrates presented by the proteins of the TCR complex or antibodies against CD3 and, for costimulation, CD28. The antibodies can either be added to the cells in soluble form or be immobilized on a surface, like the culture dish or functionalized microbeads. While the activating potential of immobilized IgG has been shown to be stronger than that of soluble antibodies [van Lier RA et al., 1989], other studies reported that effective T cell stimulation requires the ligands to be immobilized on a surface having dimensions similar to those of a cell [Curtsinger J et al., 1997]. Taking advantage of both effects, the stimulating antibodies are preferably immobilized on (cell-sized) microbeads.
3.4.5 Ca2+ signaling in T cells The key step in triggering Ca2+ flux is the activation of PLC-γ1. It results in a biphasic Ca2+ signal due to the InsP3-mediated Ca2+ depletion of intracellular stores followed by Ca2+ entry across CRAC channels (of which only 100 - 400 are present in the cell membrane of a single Jurkat T cell, [Lewis RS, 2001]). Ca2+ release from the ER is triggered within ≈ 30 s after contact formation between T cell and APC. It shifts the Ca2+ concentration from a resting value of about 70 nM to a peak concentration of ≈ 500 nM before it ebbs within ≈ 100 s. Since it only serves as a sensitive trigger for controlling a much larger flux of Ca2+ across the plasma membrane, Ca2+ release from intracellular stores in T cells makes a relatively small contribution to the total Ca2+ signal compared to that of Ca2+ influx via the store-operated Ca2+ channels. The latter is effected, directly or indirectly, by Ca2+ ATPases, Na+-Ca2+ exchange, mitochondria, endoplasmatic reticulum, Ca2+ buffers, membrane potential as well as endogeneous inhibitors of CRAC channels [Bautista DM et al., 2002; Quintana A et al., 2005]. Moreover, it has been shown, that the voltage-gated K+ channel Kv1.3 or the Ca2+-activated K+ channel IKCa1 can also modulate the rate of Ca2+ entry across the plasma membrane [Lewis RS, 2001]. The complexity of the signal, and the many opportunities for regulating individual components of the signaling mechanism, lead to a tremendous flexibility in outcome, ranging from isolated transients to sustained oscillations and elevated plateaus, spanning a concentration range of ≈ 200 nM to > 1 µM [Grafton G and Thwaite L, 2001; Lewis RS, 2001]. This complexity serves to illustrate that the Ca2+ signal is not a binary switch, but in principle contains a wealth of information. This can be decoded by the cell into a particular outcome [Lewis RS, 2001]. As diverse as the shape of calcium traces observed in T cells upon TCR stimulation is the number of cellular events influenced by the elevated cytosolic Ca2+ level. 75% of all activation-regulated genes show a dependence on Ca2+ influx through the plasma membrane via CRAC channels [Feske S et al., 2001; Quintana A et al., 2005]. Moreover, each of the three most important transcription factor families in T cells, NFAT, NF-κB and AP-1, is activated downstream from the TCR engagement in a Ca2+-dependent manner, whether directly (in case of NFAT) or indirectly (in case of NF-κB and AP-1). However, full T cell activation is not achieved by a transient elevation of the cytoplasmatic Ca2+ concentration but requires the prolonged intracellular signaling over several hours [Viola A et al., 1999; Rachmilewitz J and Lanzavecchia A, 2002; Winslow MM and Crabtree GR, 2005]. While Ca2+ mobilization has been shown to be essential for lymphocyte proliferation following focal stimulation [Schwarz EC et al., 2007], the shape and mobility of T cells are
22
3.4 T cell activation
¯¯¯¯¯¯¯¯¯¯¯¯¯¯¯¯¯¯¯¯¯¯¯¯¯¯¯¯¯¯¯¯¯¯¯¯¯¯¯¯¯¯¯¯¯¯¯¯¯¯¯¯¯¯¯¯¯¯¯¯¯¯¯¯¯¯¯¯¯¯¯¯¯ regulated by cytosolic Ca2+, too [Wulfing C et al., 1997]. This supports that calcium is also involved in the cytoskeletal reorganization upon TCR stimulation. Ca2+ signals have been shown to be related to numerous downstream events in the cellular response and to be strongly influenced by a number of factors, like the type of T cell, its state of maturation [Arrol HP et al., 2008], as well as the APC and the characteristics of the stimulus [Wulfing C et al., 1997; Wei XB et al., 1999]. However, our knowledge about the influence of its time course on gene expression or later activation events is rather poor. Hence, only little is known about whether the different patterns of Ca2+ traces are responsible for coding the specificity of cellular responses. Studies of murine B cells have shown that the amplitude and duration of Ca2+ signals controls specific subsets of Ca2+-sensitive transcription factors. Dolmetsch et al. observed biphasic Ca2+ signals in B lymphocytes consisting of a large transient followed by a smaller, persistent plateau. They could show that the large transient activates NF-κB and the MAPK pathway selectively, whereas the low plateau activates only NFAT [Dolmetsch RE et al., 1997]. The same group could further show that Ca2+ oscillations can regulate the activation of transcription factors mediating IL-2 expression in T cells. While NFAT required high-frequency oscillations (with oscillation periods shorter that 400 s), NF-κB was activated significantly even by spikes as infrequent as one every 30 min. [Dolmetsch RE et al., 1998; Lewis RS, 2003]. Moreover, Negulescu et al. stimulated T cell hybridoma cells with immobilized anti-CD3 and correlated the elicited Ca2+ transients with the expression of an NFAT-dependent lacZ reporter gene. They detected a significant difference in (i) the mean Ca2+ concentration, (ii) the spiking amplitude and (iii) the spiking rate between lacZ+ and lacZ- cells [Negulescu PA et al., 1994]. All these experiments show that – although a ubiquitous second messenger – lymphocyte Ca2+ signals can transmit specific information embedded in their duration, amplitude, and kinetics. Recent studies have correlated the characteristics of anti-CD3-evoked Ca2+ traces in T cells with morphological changes in those cells upon stimulation [Quintana A et al., 2009]. Others even proposed calcium signaling responses to better represent the potentially functional complexity of T cells than their conventional description by phenotypic markers [Arrol HP et al., 2008]. However, the functional relationship between Ca2+ signals and later T cell responses has still not yet been completely clarified. Although it is widely accepted that the response of a stimulated T cell is related to the pattern of its Ca2+ response, there interestingly are comparatively few studies that address this question. Those which do, mainly rely on the data of Wülfing et al., Dolmesch et al., or Negulescu et al. [Negulescu PA et al., 1994; Dolmetsch RE et al., 1997; Wulfing C et al., 1997; Dolmetsch RE et al., 1998], see above). This might be due to a lack of techniques that provide the possibility to investigate different dynamic cellular processes over periods of time in the range of seconds to hours. The analysis of highly specific response patterns of individual cells requires working on a single-cell level. This cannot be achieved by standard cell culture methods that average out rare, but important signaling events. However, correlating the analysis of early responses like short-term Ca2+ signaling with late activation events like protein expression or proliferation requires controlling and monitoring the involved event cascades of each single cell from the stimulus application over the initial cellular reactions up to late responses. This is demanding, especially with non-adherent cells like T cells.
23
3 Basic principles and current state of research
¯¯¯¯¯¯¯¯¯¯¯¯¯¯¯¯¯¯¯¯¯¯¯¯¯¯¯¯¯¯¯¯¯¯¯¯¯¯¯¯¯¯¯¯¯¯¯¯¯¯¯¯¯¯¯¯¯¯¯¯¯¯¯¯¯¯¯¯¯¯¯¯¯ A central part of the present work was to develop a cell handling protocol that provides (i) the controlled stimulation of single T cells with bioactive surfaces (ii) the analysis of the elicited cellular reactions on a short-term level (iii) the analysis of the elicited cellular reactions on a long-term level (iv) assigning the recorded data sets to each individual cell (v) correlating the short- and the long-term responses with each other.
24
3.4 T cell activation
¯¯¯¯¯¯¯¯¯¯¯¯¯¯¯¯¯¯¯¯¯¯¯¯¯¯¯¯¯¯¯¯¯¯¯¯¯¯¯¯¯¯¯¯¯¯¯¯¯¯¯¯¯¯¯¯¯¯¯¯¯¯¯¯¯¯¯¯¯¯¯¯¯
25
4 Methods
¯¯¯¯¯¯¯¯¯¯¯¯¯¯¯¯¯¯¯¯¯¯¯¯¯¯¯¯¯¯¯¯¯¯¯¯¯¯¯¯¯¯¯¯¯¯¯¯¯¯¯¯¯¯¯¯¯¯¯¯¯¯¯¯¯¯¯¯¯¯¯¯¯
4
Methods
4.1
Functionality of the DEP chips
4.1.1 Chip design Microfluidic systems (Fig. 4-1 A) were manufactured by sandwiching a 30 µm thick SU-8 polymer between two glass slides, so that the resist formed the sidewalls of a channel. For stabilization, the sandwich structure was mounted on a carrier of anodized aluminum. The shape of the channel system is reminiscent of a spider with eight branches diverting from a central channel (Fig. 4-1 B). Each of the branches has a fluid port at its end that was connected to standard HPLC tubing and either used as inlet or as outlet for introducing (or discarding) cells, beads or aqueous solutions. Syringe pumps allowed controlling the fluid flow in each branch of the channel individually. Due to the dimensions of the fluidic system, particles and solutions were transported in a laminar flow and, thus, moved in parallel trajectories.
26
4.1 Functionality of the DEP chips
¯¯¯¯¯¯¯¯¯¯¯¯¯¯¯¯¯¯¯¯¯¯¯¯¯¯¯¯¯¯¯¯¯¯¯¯¯¯¯¯¯¯¯¯¯¯¯¯¯¯¯¯¯¯¯¯¯¯¯¯¯¯¯¯¯¯¯¯¯¯¯¯¯ Fig. 4-1 (see previous page): Design and function of the DEP chip. (A) Photography depicting the DEP chip with the fluidic system (detailed in B) mounted on a carrier of anodized aluminum (black). Two green plates serve as the connection boards for interfacing the microelectrodes of the chip to a radio-frequency generator. Scale bar, 20 mm (B) Microchannel system bordered by the SU-8 polymer spacer. Eight branches diverge from a central channel. They were connected to a tubing system and served as inlets or outlets for particles and solutions. Syringe pumps controlled the fluid flow in each branch individually. Dielectrophoretic manipulation of cells and microparticles occurred in the central processing area (detailed in C). Scale bar, 3 mm (C) Central processing area with electrode structures for positioning and sideward guiding of microscale objects in the fluid flow. Scale bar, 300 µm (D) Side view of the microchannel at the zigzag element marked with the rectangle in C. The top and bottom of the channel carry identical designs of electrode structures. By applying an appropriate AC voltage (see text for details) between the two electrodes (black), cells and particles are prevented from passing between them. (E) 3D illustration of the zigzag element retaining a particle against the fluid flow (indicated by the white arrows).
4.1.2 DEP manipulation The DEP manipulation of cells and particles occurred at the central processing area (box in Fig. 4-1 B). Here, the inner faces of the top and bottom slides of the channel carry identical designs of 20 µm wide photolithographically wet-etched Pt microelectrodes (Fig. 4-1 C). Applying a voltage from a generator to these electrodes creates an inhomogeneous electric field which polarizes suspended objects like live cells or beads. Because of the contrast of conductivity and permittivity between the particles and the surrounding medium, the induced polarization charges interact with the E-field and produce a net force that is directed away from the electrodes (nDEP). This effect was used to prevent particles and cells from passing between active electrodes (Fig. 4-1 D). Depending on the design of the electrodes, the particles were held against the fluid flow or shifted laterally and, thus, could be positioned with high precision in the microchannel (Fig. 4-1 E).
4.1.3 Tubing system
Fig. 4-2: The tubing system. (A) Exploded assembly drawing of the interface between the chip and the HPLC tubes. (B) Photography of the tubing system with injectors and valves. One open exit allows retrieving the manipulated cells from the fluidic system. For that, a fast sheath flow is running from one inlet of the microchannel to the exit of the tubing system where it continuously forms droplets of cell culture medium. By directing a cell into the sheath flow and subsequently collecting the formed droplet into a microwell the cell can be released from the fluidic system after manipulation. Cover plate, CP; Mounting block, MB; Scale bar, 30 mm. (C) Exit of the tubing system with a forming droplet. Scale bar, 3 mm. 27
4 Methods
¯¯¯¯¯¯¯¯¯¯¯¯¯¯¯¯¯¯¯¯¯¯¯¯¯¯¯¯¯¯¯¯¯¯¯¯¯¯¯¯¯¯¯¯¯¯¯¯¯¯¯¯¯¯¯¯¯¯¯¯¯¯¯¯¯¯¯¯¯¯¯¯¯ For connecting the HPLC tubes to the microchannel, the chip was fixed to a mounting block of aluminum (Fig. 4-2 A). The tubes were inserted into the boreholes of a special carrier unit which were precisely arrayed according to the configuration of the openings in the microchannel. A cover plate was fixed to the carrier unit and screwed tightly onto the mounting block. This made the carrier unit press the tubes on the openings of the microchannel. A gasket ring between the tubes and the chip surface ensured the interface to be sealed. Fig. 4-2 B shows a section of the tubing system and its interface with the DEP chip. The mounting block, the tubes and the cover plate are clearly visible while the DEP chip is hidden by the carrier unit. Cells and beads are introduced into the tubing system by custom-built injectors. For that, a septum within the injector was penetrated with a microvolume syringe containing the particle solution. Valves provided a high flexibility of the tubing configuration and helped to dispense the fluid flow generated by the syringe pumps according to the requirements of the experimental task. An overview of the complete setup with syringe pumps and radio-frequency generator is given in Fig. 4-3. The fluidic system has one open exit for extracting the cells after DEP manipulation. For that, a fast sheath flow was generated between one inlet and the sampling outlet of the channel system. It continuously formed droplets at the open exit of the tubing (Fig. 4-2 C) by which a cell was retrieved from the fluidic system and collected e.g. into a well of a microplate (see section 5.2.3 for details).
Fig. 4-3: Experimental setup of the system.
28
4.2 Cell culture
¯¯¯¯¯¯¯¯¯¯¯¯¯¯¯¯¯¯¯¯¯¯¯¯¯¯¯¯¯¯¯¯¯¯¯¯¯¯¯¯¯¯¯¯¯¯¯¯¯¯¯¯¯¯¯¯¯¯¯¯¯¯¯¯¯¯¯¯¯¯¯¯¯
4.2
Cell culture
4.2.1 Cultivation of Jurkat T cells Jurkat T lymphocytes (clone E6-1) were cultivated at 5% CO2 and 37 °C in 5 ml cell culture medium from initial concentrations of 0.5 or 1 × 10⁵ ml-1. Every three to four days, the cell suspension was transferred to a new culture flask and diluted with fresh medium to keep the cell number below 1 × 10⁶ ml-1.
4.2.2 Cultivation of L929 cells L929 fibroblasts were cultivated in L929 medium from initial concentrations between 4 and 8 × 103 cm-2. To keep the cell number below 8 × 104 cm-2 the culture was splitted every three to four days. For that, the cells were washed with PBS and incubated for 5 min. in 1 - 2 ml Trypsin/EDTA 0.05% at 37 °C. After that, the trypsinization was stopped by adding 10 ml L929 medium. The cells were resuspended in fresh L929 medium after centrifugation for 5 min. at 100 g, counted in a counting chamber and transferred into a new culture flask.
4.2.3 Cultivation of FSDC FSDC cells were cultivated in GIL medium at cell densities between 4 × 10³ and 3 × 105 cm-2. For splitting the cells (every three to four days), the same protocol was used as for L929 cells except for using GIL medium instead of L929 medium and centrifuging the cells at 300 g instead of 100 g.
4.2.4 Cultivation of E14Tg2A mouse embryonic stem (mES) cells E14Tg2A cells were cultivated on gelatin-coated Petri dishes in stem cell medium+LIF. They were splitted every two days by first incubating them in 1 ml Trypsin/EDTA 0.25% for 5 min. at 37 °C. After this, the trypsinization was blocked by adding 8 ml stem cell medium+LIF. Subsequently, the cells were washed with fresh medium (centrifugation for 5 min. at 100 g) and seeded into a gelatincoated Petri dish (1 × 10⁶ cells in 15 ml of stem cell medium+LIF). After one day, the medium was changed.
4.2.5 Single-cell cultivation Preparation of conditioned medium Jurkat T cells were grown for three days under sterile conditions from an initial concentration of 105 ml-1. The supernatant was sterile-filtered and mixed with fresh medium at a mixing ratio of 2 : 1 (unless otherwise specified). After that, 1 mM sodium pyruvate was added. Limiting dilution assays For the pipet-based deposition of single cells into a microwell, a limiting dilution assay was performed. A cell suspension was diluted to 5 cells ml-1 of which subsamples of 100 µl were pipetted into the wells. After that, the wells were analyzed for the 29
4 Methods
¯¯¯¯¯¯¯¯¯¯¯¯¯¯¯¯¯¯¯¯¯¯¯¯¯¯¯¯¯¯¯¯¯¯¯¯¯¯¯¯¯¯¯¯¯¯¯¯¯¯¯¯¯¯¯¯¯¯¯¯¯¯¯¯¯¯¯¯¯¯¯¯¯ number of deposited cells by brightfield microscopy. Unless otherwise specified, only wells containing a single cell were evaluated further (note, that in the experiments to evaluate the singlecell cultivation in different culture plates, cell suspensions of 10 cells ml-1 were used; in these experiments, all filled wells were analyzed for vital cell clones after seven to eight days of cultivation). The number of cells having been seeded into a microwell was estimated by scanning the well with a brightfield microscope for deposited cells (magnification of the objective, 10 ×). Since the size of a cell is extremely small in contrast to the area of the well, there was a risk of missing cells by this method which could lead to an underestimation of the cell number in the well. For estimating the reliability of the described method to recover the seeded cells, n = 162 microwells were filled with 100 µl cell suspension (5 cells ml-1) and analyzed for the number of deposited cells. Then, the experimental data was compared with the theoretical expectation for the amount of wells containing a certain cell number Nk. This is described by the Poisson distribution multiplied by the number of all analyzed wells:
N k = n ⋅ Pμ ( X = k ) = n
μk k!
e−μ
(4.1)
While µ describes the expected cell number per well (here, µ = 0.5), n is the total number of wells (here, n = 162). Pµ (X = k) (with the random variable X) describes the expected percentage of wells containing k cells.
Fig. 4-4: Recovery of single cells after their deposition into microwells. In context of a limiting dilution assay, single cells were deposited randomly into the wells of a microplate (µ = 0.5 cells well-1, n = 162). For each microwell, the number of seeded cells was estimated by scanning the surface with a brightfield microscope for deposited cells (magnification of the objective, 10 ×). On the basis of the Poisson distribution, the experimental data was compared to the theoretically anticipated amount of wells containing a certain cell number.
As shown in Fig. 4-4, the experimental data was very close to the theoretical expectation. Moreover, the experimentally estimated amounts of wells containing one, two, three and four cells were slightly higher than theoretically expected which suggests the risk of underestimating the seeded cell number to be negligible.
30
4.3 Surface coating
¯¯¯¯¯¯¯¯¯¯¯¯¯¯¯¯¯¯¯¯¯¯¯¯¯¯¯¯¯¯¯¯¯¯¯¯¯¯¯¯¯¯¯¯¯¯¯¯¯¯¯¯¯¯¯¯¯¯¯¯¯¯¯¯¯¯¯¯¯¯¯¯¯
4.2.6 Preparation of peripheral blood lymphocytes (PBL) for DEP manipulation After thawing the cells, they were transferred to 50 ml preheated cell culture medium without FCS and washed 3 × (10 min. at 100 g), before they were resuspended in cell culture medium and adjusted to a cell number of 5 × 10⁵ ml-1.
4.2.7 Preparation of mES cells for DEP manipulation The cells were trypsinized as described in section 4.2.4. After washing, they were resuspended in stem cell medium, adjusted to 8 × 10⁵ ml-1 and incubated at 37 °C and 5% CO2 until use. Prior to their injection into the DEP chip, the cells were centrifuged again (5 min. at 100 g) and adjusted to a cell number of 6 × 10⁶ ml-1.
4.2.8 Cultivation of Jurkat T cells under suppressed gas exchange Cell culture medium was degassed by incubating it at 37 °C for 3 h followed by ultrasonic treatment (5 min. at degas mode) or without further treatment. Alternatively, it (i) was aerated by incubating it for 3 h at 5% CO2 and 37 °C or (ii) was left untreated. Jurkat T cells were centrifuged at 300 g for 5 min. before they were resuspended in the previously prepared culture medium and adjusted to a cell number of 4 × 10⁵ ml -1. The cell suspension was transferred to a 50 µl syringe which was hermetically sealed after this or covered with laboratory film to enable gas exchange. The capillaries were incubated over night at 37 °C and 5% CO2, before the vitality of the cells was analyzed the following day by brightfield microscopy.
4.2.9 Cultivation of cells in the DEP chips Different types of microchannels (DEP chips or MicCell) were connected to a tubing system and filled with suspensions of Jurkat T cells (4 - 5.3 × 10⁵ ml-1 in culture medium) or L929 fibroblasts (1.5 - 5 × 10⁶ ml-1 in L929 medium). All exits of the system were sealed and the microchannels were incubated over night at 37 °C and 5% CO2. After this, the vitality of the cells was evaluated by brightfield microscopy.
4.3
Surface coating
4.3.1 Gelatin-coating of 96-well plates and Petri dishes Petri dishes (or microwells) were incubated for at least 2 - 3 h at 37 °C with 8 ml (or 100 µl) PBS containing 0.1% Gelatin. Before use, the solution was removed.
31
4 Methods
¯¯¯¯¯¯¯¯¯¯¯¯¯¯¯¯¯¯¯¯¯¯¯¯¯¯¯¯¯¯¯¯¯¯¯¯¯¯¯¯¯¯¯¯¯¯¯¯¯¯¯¯¯¯¯¯¯¯¯¯¯¯¯¯¯¯¯¯¯¯¯¯¯
4.3.2 Antibody coating of microplates Antibody-coated microwells (BD Falcon) were prepared by first incubating them for 1 h with PBS containing 10 µg ml-1 Protein-A. Subsequently, they were washed two times with PBS and blocked for 1 h with 0.1% BSA. After having been washed again, they were incubated at least 24 h at 4 °C with 1 µg ml-1 anti-CD3 and anti-CD28, and washed three times before use.
4.3.3 Antibody coating of microbeads Antibody-presenting 10 µm polystyrene beads were produced by first washing protein A-coated beads in PBS, incubating them at a concentration of 8 × 10⁵ ml-1 for one hour at room temperature in 2 µg ml-1 anti-CD3 and anti-CD28. After that, they were stored at 4 °C and were washed three times with PBS before use.
4.3.4 Surface plasmon resonance (SPR) technology The SPR experiments were performed in friendly cooperation with Dr. Walter Stöcklein, Fraunhofer IBMT, Potsdam. Background Surface plasmon resonance (SPR) is a phenomenon that occurs when (monochromatic) p-polarized light is shone through a prism on a metal (e.g. gold-) surface at an incidence angle higher than the critical angle for total internal reflection. In this case, a so-called evanescent wave is exerted at the back side of the surface that interacts with the free electron gas of the metal layer. As a consequence, the energy of the reflected light is reduced. The angle at which the maximum loss of the reflected light intensity occurs is called resonance angle or SPR angle. It depends on the refractive index in the immediate vicinity of the surface layer of a sensor chip, which, in turn, changes when accumulated mass (e.g. proteins) adsorb on it. This is why the technology can be used to characterize the interaction between two or more (unlabeled) molecules like antigens and antibodies. For that, one of the proteins (the receptor) is immobilized to a goldcoated glass slide. The other one (the analyte) remains in solution and is continuously flushed over the analyte-coated surface. Binding of the analyte to the receptor increases the mass at the slide surface and changes the SPR angle which can be detected by a photodiode array (Fig. 4-5 A) and is expressed in response units (RU). Fig. 4-5 B shows a typical binding cycle observed with an optical biosensor described in Fig. 4-5 A. After a short incubation step with running buffer, the receptor is flushed with a solution of analyte that immediately binds to the receptor molecules. This makes the refractive index of the sensor surface increase and, thus, leads to a shift of the resonance angle. After 300 s, the analyte solution is replaced by buffer so that the receptor-analyte complexes dissociate again. Finally, the surface is regenerated by washing it with e.g. HCl and is ready for use in the next binding cycle.
32
4.3 Surface coating
¯¯¯¯¯¯¯¯¯¯¯¯¯¯¯¯¯¯¯¯¯¯¯¯¯¯¯¯¯¯¯¯¯¯¯¯¯¯¯¯¯¯¯¯¯¯¯¯¯¯¯¯¯¯¯¯¯¯¯¯¯¯¯¯¯¯¯¯¯¯¯¯¯
Fig. 4-5: Typical setup of an SPR experiment. (A) SPR detection unit. A sensor chip with a thin gold film is coated with receptor molecules. In a microfluidic flow chamber the analyte is flushed over the sensor chip and, thus, binds to the receptor molecules. At the same time, p-polarized light is shone to the surface at a particular wavelength and incident angle so that a surface plasmon wave of excited electrons is produced at the gold layer. It is detected as a reduced intensity of the reflected light beam at a particular resonance angle which depends on the mass of the surface layer and, thus, represents the interaction between the analyte and the receptor. (B) A typical sensorgram of an SPR experiment. At the beginning, the surface is washed with running buffer. Then, the analyte is added to the solution and binds to the receptor molecules (association): the response signal increases. Dissociation of the analyte-receptor complex is induced by replacing the analyte solution with running buffer again. Finally, the sensor chip is regenerated by washing it with regeneration solution (e.g. HCl). Modified from [Cooper MA, 2002].
Protein A coating An SPR sensor chip was prepared by first cleaning it with 50 mM NaOH and 50 mM HCl until it showed a stable response signal. After that, one part of the chip was activated for 3 min. with EDC/NHS followed by a coating step with 5 µg ml-1 protein A in acetate buffer. Finally, it was saturated by incubation for 7 min. in 1 M Ethanolamine (pH 8.5). After each incubation step, the surface was washed with PBS/T buffer for 60 - 120 s. For the control sample, another part of the chip underwent the same manipulation procedure except for omission of the coating step with protein A. Blocking non-specific binding sites Both, the protein A-coated and the control sample were washed for 30 s with 50 mM HCl, followed by ca. 5 min. incubation step in 0.1% BSA (in PBS/T buffer). After that, the samples were regenerated with 50 mM HCl for 30 s. After each incubation step, the surface was washed for 3 - 3.5 min. with PBS/T buffer. The signals of both, the protein Aand the control sample were subtracted from each other. Non-specific binding of BSA to protein A was indicated by a slightly increasing signal during the BSA exposure (Fig. 4-6 A). Regeneration of the sensor chip The chip was incubated in 100 nM anti-CD3 (in PBS/T buffer) for 3 min. and washed with buffer for ca. 6 min. after this. Then it was regenerated by HCl exposure (50 nM, 1 min.) and washed again with PBS/T. The whole procedure was repeated three times. Alternatively, the chip was flushed with pure PBS/T over the complete trial period (buffer curve). The signals of both, the protein A- and the control sample were subtracted from each other and corrected for the buffer curve. The corresponding response signal is plotted in Fig. 4-6 B. All three curves are perfectly aligned and return to their initial values after HCl treatment which shows a high reproducibility and a complete regeneration of the chip after IgG binding.
33
4 Methods
¯¯¯¯¯¯¯¯¯¯¯¯¯¯¯¯¯¯¯¯¯¯¯¯¯¯¯¯¯¯¯¯¯¯¯¯¯¯¯¯¯¯¯¯¯¯¯¯¯¯¯¯¯¯¯¯¯¯¯¯¯¯¯¯¯¯¯¯¯¯¯¯¯
Fig. 4-6: Preparation of a protein A-coated SPR sensor chip. (A) Blocking of non-specific binding sites. The chip was washed with PBS/T buffer before it was incubated in 0.1% BSA for ca. 5 min. After this, the BSA solution was replaced with buffer again and the chip was regenerated with 50 mM HCl. (B) Regeneration of the sensor chip. The chip was incubated for 3 min. in 100 nM antiCD3 before it was washed with PBS/T for the rest of the trial period, only interrupted by a 30 s regeneration step with 50 mM HCl at t = 620 s. The whole procedure was repeated three times.
Binding kinetics of anti-CD3 and anti-CD28 to protein A The chip was flushed for 3 min. with PBS/T buffer containing different concentrations of anti-CD3 or anti-CD28 (2, 4, 8, 16, 32, 64, 128, 256, or 512 nM) or no antibodies (buffer curve, 20 µl min.-1). Then, it was washed with buffer without IgG for 7 min. and regenerated for 30 s with 50 mM HCl. After an additional incubation step in fresh PBS/T buffer, the procedure was repeated with another antibody concentration. The signals of both, the protein A- and the control sample were subtracted from each other and corrected for the buffer curve. Analysis of the SPR sensorgram For estimating the association and dissociation constants for the protein A - antibody interaction, a Langmuir model (1:1) was fitted to the data of the sensorgram. The model assumes that both, the (monovalent) analyte and the receptor are homogeneous, and that all binding events are independent. Under these conditions, the interaction between analyte and receptor is described by ka
A + R ⇌ AR kd
with the association- and dissociation rate constants ka and kd describing the rate of the formation and decay of the antigen-receptor complex, respectively. Thus,
d [ AR] = k a ⋅ [ A] ⋅ [ R] − k d ⋅ [ AR] dt
(4.2)
describes the formation of the complex as a function of time. While [R] is the concentration of free binding sites on the surface [AR] is that of the occupied. Thus, [R] can be expressed as [AR]max [AR]. Furthermore, the concentration of the occupied binding sites [AR] at a given time point can be expressed as the function Γ(t) which leads to
34
4.4 Immunological and cell biological aspects
¯¯¯¯¯¯¯¯¯¯¯¯¯¯¯¯¯¯¯¯¯¯¯¯¯¯¯¯¯¯¯¯¯¯¯¯¯¯¯¯¯¯¯¯¯¯¯¯¯¯¯¯¯¯¯¯¯¯¯¯¯¯¯¯¯¯¯¯¯¯¯¯¯ dΓ(t ) = k a ⋅ [ A] ⋅ ([ AR] max − Γ(t ) ) − k d ⋅ Γ(t ) dt
(4.3)
dΓ(t ) = k a ⋅ [ A] ⋅ [ AR] max − (k a ⋅ [ A] + k d ) ⋅ Γ(t ) dt
(4.4)
and after conversion to
Assuming that the analyte concentration [A] is kept constant throughout the whole experimental procedure, the differential equation can be solved to
(
Γ(t ) = Γeq 1 − e −(ka ⋅[ A]+ kd )⋅t
)
(4.5)
with
Γeq =
[ A] ⋅ [ AR]max ⋅ ka [ A] ⋅ ka + kd
(4.6)
describing the concentration of the analyte-receptor complexes at the equilibrium. The association and dissociation rate constants ka and kd are evaluated from fitting the function to the set of curves obtained from the SPR measurements. The affinity of the analyte to the receptor is given by
KD =
kd −1 = KA ka
(4.7)
with the dissociation- and association equilibrium constants KD and KA, respectively.
4.4
Immunological and cell biological aspects
4.4.1 Loading of FSDC with OVA257-264 peptide FSDC were incubated at 37 °C and 5% CO2 for 1.5 - 2.5 h in GIL medium containing 5 – 10 µg ml-1 OVA257-264 peptide. After that, the cells were washed three times in PBS, before they were resuspended in GIL medium 60/30 and adjusted to a cell number of 3 × 10⁵ ml-1.
35
4 Methods
¯¯¯¯¯¯¯¯¯¯¯¯¯¯¯¯¯¯¯¯¯¯¯¯¯¯¯¯¯¯¯¯¯¯¯¯¯¯¯¯¯¯¯¯¯¯¯¯¯¯¯¯¯¯¯¯¯¯¯¯¯¯¯¯¯¯¯¯¯¯¯¯¯
4.4.2 Loading of Jurkat T cells with Fura-2 AM 1 × 10⁶ Jurkat T lymphocytes were incubated in the dark for 1 h at RT (or for 30 min. at 37 °C) in 1 ml cell culture medium containing 2 µM Fura-2/AM. Subsequently, the cells were centrifuged for 5 min. at 500 g, resuspended in culture medium and used within the next 2 h.
4.4.3 T cell activation Activation of T cells in antibody-coated microplates 3.5 or 8.8 × 10⁴ Jurkat T cells were deposited into an antibody-coated microwell in a total volume of 180 or 100 µl cell culture medium. The suspension was incubated over night at 37 °C and 5% CO2. After that, the vitality and activation state of the cells was analyzed. Activation of Jurkat T cells with antibody-coated microbeads The potential of the antibodycoated beads to induce T cell activation was tested by incubating 5.6 × 10⁵ antibody-coated microbeads and 3.5 × 10⁴ cells at 5% CO2 and 37 °C over night in a total volume of 180 µl in a microplate prior to analysis of the vitality and activation state of the cells. Activation of T cells with soluble antibodies 3.5 × 10⁴ Jurkat T cells were incubated in a microwell containing 180 µl culture medium and 2 µg ml-1 of both, anti-CD3 and anti-CD28. The cells were incubated at 37 °C and 5% CO2 for 6 h before their survival and activation rates were analyzed. Ca2+ imaging after stimulation with soluble antibodies at different concentrations 1 × 10⁵ Fura-loaded Jurkat T cells were mixed with 150 µl culture medium containing different concentrations of anti-CD3 and anti-CD28 (10-8, 10-9, 10-10, 10-11, 10-12, 10-13 and 10-14 M each) or medium without antibodies (control). The suspensions were transferred into a microplate and incubated for 10 min. before the cytosolic Ca2+ levels of 15 cells in each case were analyzed. After this, the cells were further incubated over night at 37 °C and 5% CO2 and analyzed for T cell activation the following day. Activation of primary T cells with APCs A microwell of a glass bottom plate was used to 4 5 incubate 7.2 × 10 OT-I cells and 5.4 × 10 OVA257-264-loaded FSDC over night in a total volume of 180 µl GIL medium 60/30 at 5% CO2 and 37 °C. The next day, the activation state of the T cells was analyzed. Activation of Jurkat T cells with desorbed antibodies from functionalized microbeads 8.8 × 10⁴ antibody-coated beads were incubated over night in 180 µl cell culture medium. The suspension was centrifuged for 10 min. at 16000 g after this to separate beads and supernatant from each other. Two-thirds of the beads (5.7 × 10⁴) were washed 3 × with PBS and added to 3.5 × 10⁴ Jurkat T cells in a total volume of 180 µl. Additionally, two-thirds of the supernatant (120 µl) were also added to 3.5 × 10⁴ Jurkat cells and diluted with fresh culture medium to a total volume of 180 µl. Alternatively, 3.5 × 10⁴ Jurkat T cells were mixed with 5.7 × 10⁴ freshly prepared beads or left unstimulated (total volume: 180 µl). The suspensions were incubated over night at 37 °C and 5 % CO2 in a microwell. After this, the activation rate of the cells was analyzed. Analysis of T cell activation out of the DEP chips Analysis of T cell activation was performed in the CLSM after live cell staining with 4% anti-CD69-FITC (or 0.2% anti-CD69-PE for OT-I 36
4.4 Immunological and cell biological aspects
¯¯¯¯¯¯¯¯¯¯¯¯¯¯¯¯¯¯¯¯¯¯¯¯¯¯¯¯¯¯¯¯¯¯¯¯¯¯¯¯¯¯¯¯¯¯¯¯¯¯¯¯¯¯¯¯¯¯¯¯¯¯¯¯¯¯¯¯¯¯¯¯¯ cells) for fifteen minutes. Contrast and brightness of the obtained grayscale pictures were adjusted with Image-Pro Plus 4.0 (Media Cybernetics, USA) so that the intracellular intensity equaled the background. T cells were counted as activated, if their outlines were visible after image processing. Analysis of T cell activation on-chip Following the staining procedure on-chip, the cells were analyzed in the fluorescence microscope (excitation, 492/18 nm; emission, 530/20 nm; exposure time, 150 ms; binning, 2×). The intensity histogram of the picture was calculated with the imaging software Cell^R (Olympus SIS, Germany). Both points on the intensity curve which were half the maximum value of the highest peak were evaluated. The displayed spectrum area was spanned between the higher of both values and the threefold of this. Cells were counted as activated, if they showed an outline brighter than their cell body after image processing. Analysis of T cell vitality To evaluate the vitality of the T cells, they were examined following over night incubation and counted as damaged if they showed a non-spherical morphology with undefined contours (Fig. 4-7 A, arrowheads) or blebs (Fig. 4-7 A and B, arrow). Perforated cells appeared as bright spots after live cell staining due to fluorescent antibodies in the cytoplasm (Fig. 4-7 E, arrow). In contrast, vital cells showed a spherical morphology with a homogeneously structured cell body and a clear-cut contour (Fig. 4-7 C, arrowheads).
Fig. 4-7: Evaluation of the T cell vitality by brightfield and fluorescence microscopy. Vital and damaged cells were distinguished from each other by (i) the shape of their outline, (ii) bleb formation or (iii) cytosolic fluorescence signal after live-cell staining. (A, B) Brightfield images of damaged cells showing undefined contours (arrowheads) and blebs (arrows). (C) In contrast, vital cells show a spherical and clear-cut contour (arrowheads) with a homogeneously structured cell body devoid of blebs. (D, E) Brightfield- and fluorescence image of a bead-contacted, perforated cell after live cell staining with fluorescent antibodies. The cell body is brightly stained due to fluorescently labeled antibodies in the cytoplasm (arrow). Scale bar, 10 µm.
4.4.4 Cardiomyocyte differentiation (control experiments) 20 µl E14Tg2A mES cells (6 × 10⁶ ml-1) were mixed with the same volume of LIF-, SPARC- or BSA-coated (magnetic) nanobeads (0.5 mg ml-1) in a reaction tube. After an incubation step of 30 s, the suspension was diluted with stem cell medium 1 : 600. Excess nanobeads were extracted from the suspension by attaching a magnet to the reaction tube for 1 min. Then, 100 µl of the cell suspension were transferred to a standard 96-well plate and cultivated further. The medium was adjusted to a total volume of 350 µl and was changed when necessary.
37
4 Methods
¯¯¯¯¯¯¯¯¯¯¯¯¯¯¯¯¯¯¯¯¯¯¯¯¯¯¯¯¯¯¯¯¯¯¯¯¯¯¯¯¯¯¯¯¯¯¯¯¯¯¯¯¯¯¯¯¯¯¯¯¯¯¯¯¯¯¯¯¯¯¯¯¯
4.5
Calcium imaging with Fura-2
4.5.1 Background Fura-2 is a photosensitive derivate of the Ca2+ chelator EGTA (Fig. 4-8 A) that changes its spectral properties upon Ca2+ binding (KD = 0.14 µM, at pH of 7.2 and temperature of 22 °C). For UV illumination at 340 nm, the fluorescence excitation of Fura-2 increases with increasing Ca2+ concentration, while it decreases under illumination of 380 nm (see Fig. 4-8 B). As a consequence, the emitted fluorescence intensity at 510 nm differs in a Ca2+-dependent manner for 340 nm and 380 nm excitation so that the ratio of both intensities is directly related to the concentration of free Ca2+ ions in the solution. This ratiometric imaging method is unaffected by the dye concentration, the detector sensitivity, bleaching, etc. Using Fura-2 for the measurement of the cytosolic free Ca2+ requires the dye to be present in the cytoplasm. Several methods have been established during the last decades for loading it into the cell, one of which is the bulk loading method that takes advantage of the membrane permeability for the hydrophobic acetoxymethylester form of Fura-2 (Fura-2/AM). Here, the cells are simply incubated in a solution of Fura-2/AM. Once inside the cell, (non-fluorescent) Fura-2/AM will be de-esterified to the (fluorescent) Fura-2 free acid by endogeneous esterases. The acid is membrane impermeable and, thus, is trapped inside the cell.
Fig. 4-8: The ratiometric Ca2+-indicator Fura-2. (A) Molecular structures of EGTA and its derivate Fura-2. (B) Fluorescence excitation spectra of Fura-2 at different Ca2+ concentrations (modified from invitrogen).
4.5.2 Image acquisition Fura-loaded cells were analyzed with a 40 × water immersion objective on the fully automated microscope system Cell^R equipped with an external electronic shutter. Brightfield- and fluorescence images (excitation, 340/13 nm and 380/10 nm; emission, 510/80 nm) were taken alternately and at 0.2, 1 or 2 frames s-1 for each image type (exposure time, 50 ms frame-1). For the analysis of the bead-contacted cells in the DEP chips, the UV illumination intensity was set as low as possible in order to keep the irradiation stress for the cells at a minimum (intensity at the objective, 0.7 µW and 3.7 µW for 340 nm and 380 nm excitation, respectively).
38
4.5 Calcium imaging with Fura-2
¯¯¯¯¯¯¯¯¯¯¯¯¯¯¯¯¯¯¯¯¯¯¯¯¯¯¯¯¯¯¯¯¯¯¯¯¯¯¯¯¯¯¯¯¯¯¯¯¯¯¯¯¯¯¯¯¯¯¯¯¯¯¯¯¯¯¯¯¯¯¯¯¯
4.5.3 In vitro calibration of Fura-2 For evaluating the relationship between the free Ca2+ concentration and the fluorescence emission intensity ratio, a Ca2+ calibration kit (F-6774, Invitrogen Molecular Probes, Germany) was used. According to the protocol (product information, revised: 06-July-2001), aqueous solutions containing 50 µM Fura-2 and free Ca2+ at concentrations between 0 and 39 µM were analyzed in the fluorescence microscope as described above. Alternatively, a solution without Fura-2 was analyzed (background). The background-corrected fluorescence intensities at 340 nm and 380 nm excitation (Fig. 4-9 A) and the corresponding ratio values (Fig. 4-9 B) were plotted against the free Ca2+ concentration. For 0 or 39 µM free Ca2+, the fluorescence intensities at 380 nm excitation (Fmin, 380 and Fmax, 380, respectively) as well as the corresponding ratio values Rmin and Rmax were estimated.
Fig. 4-9: In vitro calibration of Fura-2. Aqueous solutions containing 50 µM Fura-2 and free Ca2+ between 0 and 39 µM were analyzed at 340 nm and 380 nm excitation. (A) The obtained fluorescence intensities were background-corrected for buffer without Fura-2 and plotted against the Ca2+ concentration. Scale bars, s.e.m. (B) Then, the ratio between corresponding fluorescence intensities at 340 and 380 nm excitation was calculated. For 0 and 39 µM free Ca2+, the ratios and fluorescence intensities at 380 nm excitation were estimated (Rmin, Rmax, Fmin, 380 and Fmax, 380, respectively).
4.5.4 Image processing The obtained fluorescence images were background-subtracted, before the F340/F380 ratio picture was calculated. On the basis of the Fura-2 calibration in vitro (see section 4.5.3), the pictures were further processed according to Grynkiewicz.[Grynkiewicz G et al., 1985]:
⎛ R − Rmin ⎞⎛ Fmin, 380 ⎟⎟⎜ [Ca ]i = K D ⎜⎜ ⎜ R R − ⎠⎝ Fmax, 380 ⎝ max 2+
⎞ ⎟ ⎟ ⎠
(4.8)
with KD = 135 nM, Rmin = 0.18, Rmax = 13.28, Fmin, 380 = 33.20 and Fmax, 380 = 2.11. Cytosolic Ca2+ levels were obtained by averaging all pixels of a cell.
39
4 Methods
¯¯¯¯¯¯¯¯¯¯¯¯¯¯¯¯¯¯¯¯¯¯¯¯¯¯¯¯¯¯¯¯¯¯¯¯¯¯¯¯¯¯¯¯¯¯¯¯¯¯¯¯¯¯¯¯¯¯¯¯¯¯¯¯¯¯¯¯¯¯¯¯¯
4.5.5 Analysis of the recorded calcium traces For the quantification of irregular Ca2+ spiking due to the electric field- or antibody exposure, the statistical variance of the recorded Ca2+ traces was estimated. For that, the square deviation from the mean calcium level of a trace was estimated for each data point before the average of all deviations was calculated. The Ca2+ signals of cells that had been contacted with antibody-coated microbeads were analyzed in more detail. Since all traces were aligned with the chronological sequence of the contact formation procedure, the particle manipulation on the DEP chip had to be considered. Shortly after the bead was released, it reached zigzag electrode z2 (see Fig. 5-14 B) with the cell stored there. This moment was called bead presentation, in contrast to the time point of the actual contact formation between the cell and the particle, which was observed by brightfield microscopy and defined when both objects acted like one aggregate in the fluid flow. For identifying the initial peak, Ca2+ traces were scanned for the triplet of monotonically increasing values with the highest ratio between first to last value. The interval between bead presentation and contact formation was called contact latency, while the interval between contact formation and initial peak was called response latency. The baseline of the cytosolic Ca2+ level was detected by averaging all values from the first five minutes of examination, i.e., before the bead presentation. Prior to the estimation of the maximum peak height, the traces were baseline-corrected. The interval between the initial peak and the maximum peak was defined as the rising time. For calculating the slope of the Ca2+ signal, the difference between maximum peak height and initial peak height was divided by the rising time (Fig. 5-14).
4.6
Particle manipulation with the DEP chips
4.6.1 Microfluidic configuration For the DEP manipulation of cells and particles, two different types of DEP chips were used: CeProm2 and CeProm6. Since the two chip types have slightly different microchannel architectures, each of them was connected to an individually configured tubing system (Fig. 4-10). To ensure bubble-free charging of the tubing system with buffer or medium, the solutions used were degassed before filling. For that, they were heated to 37 °C and treated in an ultrasonic bath for 5 min. at 100% intensity and degas mode.
40
4.6 Particle manipulation with the DEP chips
¯¯¯¯¯¯¯¯¯¯¯¯¯¯¯¯¯¯¯¯¯¯¯¯¯¯¯¯¯¯¯¯¯¯¯¯¯¯¯¯¯¯¯¯¯¯¯¯¯¯¯¯¯¯¯¯¯¯¯¯¯¯¯¯¯¯¯¯¯¯¯¯¯
Fig. 4-10: Configuration of the tubing system for different types of DEP chips. Tubing maps for (A) the CeProm2 and (B) for the CeProm6 chip. The black numbers indicate the length of the respective tubing sections in mm.
4.6.2 Retrieval of single cells from the fluidic system For isolating a cell from the fluidic system, it was hydrodynamically transported to the sampling outlet of the microchannel (see Fig. 5-7). This region of the DEP chip cannot be observed by transmitted light microscopy. Instead, it was illuminated by a fiber-optics illuminator and observed in reflected light mode. At the outlet, the cell was captured by the sheath flow, a constant flow of cell culture medium at 1800 µl h−1 which continuously formed droplets at the exit of the tubing system that dripped off after having reached a volume of ca. 30 µl. The sheath flow accelerated the pair to a velocity of 1 cm s−1 and transported it to the exit of the tubing system. 10 s after the cell had been captured, the exit was cleaned from forming droplets and the next one was collected into a microwell, containing the cell of interest (see Fig. 4-2 C).
4.6.3 Electric and hydrodynamic parameter configuration Post-chip activation protocol Cells and microbeads were manipulated at two different fluidic parameter configurations: the deflection- and the extraction mode (Tab. 4-1). In both configurations, the electrode voltage was set to 1.5 V. Moving cells and microbeads during the pair 41
4 Methods
¯¯¯¯¯¯¯¯¯¯¯¯¯¯¯¯¯¯¯¯¯¯¯¯¯¯¯¯¯¯¯¯¯¯¯¯¯¯¯¯¯¯¯¯¯¯¯¯¯¯¯¯¯¯¯¯¯¯¯¯¯¯¯¯¯¯¯¯¯¯¯¯¯ formation procedure was performed at deflection mode. After initiating the cell-bead contact, the fluid flow was stopped for 1 min. to let the cell intensify its junction to the bead without perturbation. Then, the pair was moved to the sampling outlet and isolated from the fluidic system under extraction mode.
Tab. 4-1: Electric and hydrodynamic parameter configuration for the post-chip activation protocol. Chip used: CeProm6
Assignment
Deflection mode
Stream A
Culture medium
1.8 µl h-1
18.0 µl h-1
Stream B
Culture medium
-1
3.6 µl h
36.0 µl h-1
Stream C
Culture medium
1.8 µl h-1
18.0 µl h-1
Waste
Culture medium
- 5.4 µl h-1
- 39.6 µl h-1
-1
1800.0 µl h-1
Sheath flow
Conditioned medium
Injector 1
Microbeads
Injector 2
Cells
Extraction mode
1800.0 µl h
U electric field
1.5 V
1.5 V
ω electric field
1 MHz
1 MHz
On-chip activation protocol Contacting cells and microbeads was performed at deflection mode (see Tab. 4-2). After the formation of the cell-bead pair, the microchannel was cleaned from other cells or particles by directing them to the waste outlet under the washing configuration. During that time (< 3 min.), the cell-bead pair of interest was retained at the hook electrode. Then, the exit of the tubing system was closed and the temperature of the microchannel was controlled to 35 - 37 °C. The cell was incubated for 15 - 18 h and stained the following day against the activation marker CD69. For that, the fluidic configuration was set to staining mode until the channel medium was replaced with antibody solution. After that, the cell was washed again with conditioned medium under washing mode and analyzed for T cell activation on-chip.
Tab. 4-2: Electric and hydrodynamic parameter configuration for on-chip activation protocol.
42
Chip used: CeProm2
Assignment
Stream A
Conditioned medium
Stream B Stream C
Deflection mode
Staining mode
Washing mode
19.2 µl h-1
0.0 µl h-1
14.4 or 28.8 µl h-1
PBS containing 1 : 200 anti-CD69-Alexa488
0.0 µl h-1
14.4 µl h-1 or 28.8 µl h-1
0.0 µl h-1
Conditioned medium or PBS
9.6 µl h-1
0.0 µl h-1
0.0 µl h-1
-1
-1
Waste
Conditioned medium
0.0 µl h
0.0 µl h
0.0 µl h-1
Sheath flow
Culture medium
0.0 µl h-1
0.0 µl h-1
0.0 µl h-1
Injector 1
Cells
Injector 2
Microbeads
U electric field
2.5 - 4.2 V
3V
3V
ω electric field
0.5 - 4.5 MHz
0.5 - 4.5 MHz
0.5 - 4.5 MHz
4.6 Particle manipulation with the DEP chips
¯¯¯¯¯¯¯¯¯¯¯¯¯¯¯¯¯¯¯¯¯¯¯¯¯¯¯¯¯¯¯¯¯¯¯¯¯¯¯¯¯¯¯¯¯¯¯¯¯¯¯¯¯¯¯¯¯¯¯¯¯¯¯¯¯¯¯¯¯¯¯¯¯ Correlation of short- and long-term responses to the applied bead stimulus Three different electric and hydrodynamic parameter configurations were used for these experiments: the deflection, the imaging, and the extraction mode (Tab. 4-3). Electrodes and fluidics were driven at the deflection mode to move or deflect cells and beads within the microchannel. In contrast, simple retaining of cells or cell-bead pairs in the zigzag electrode for Ca2+ imaging was performed at the imaging mode. To record a bead-induced Ca2+ trace, cells and beads typically were manipulated several seconds under deflection mode for the purpose of directing them to the zigzag electrodes. Here, they were held for 5 min. under imaging mode while their baseline Ca2+ level was recorded. After that, the configuration was switched for ca. 20 s to the deflection mode, in order to initiate the cell-bead contact, followed by a 5 min. observation of the cytosolic Ca2+ level under imaging mode. After this, the cells were transported to the sampling outlet of the microchannel under deflection mode again, before they were flushed out of the tubing system under extraction mode.
Tab. 4-3: Electric and hydrodynamic parameter configuration for the correlation of short- and long term responses to the applied bead stimulus. Chip used: CeProm6
Assignment
Stream A
Culture medium
2.9 µl h-1
0.14 µl h-1
18.0 µl h-1
Stream B
Culture medium
5.7 µl h-1
0.29 µl h-1
36.0 µl h-1
Stream C
Culture medium
-1
5.7 µl h
-1
0.29 µl h
36.0 µl h-1
Waste
Culture medium
- 5.4 µl h-1
- 0.54 µl h-1
- 39.6 µl h-1
-1
-1
1800.0 µl h-1
Sheath flow
Conditioned medium
Injector 1
Microbeads
Injector 2
Cells
Deflection mode
1800.0 µl h
Imaging mode
1800.0 µl h
Extraction mode
U electric field
3.0 V
1.2 V
1.2 V
ω electric field
1 MHz
1 MHz
1 MHz
Influence of DEP manipulation on the cell physiology For investigating the influence of different electrode voltages on the cell physiology, the cells were manipulated at field exposure condition (Tab. 4-4). Using electrode voltages of 1.5, 1.8, 2.2, 2.6 or 3.0 V, the cells were directed to the zigzag electrode where they were retained against the fluid flow for ca. 30 s. After this, they were forwarded to the sampling outlet and flushed out from the microfluidic system under extraction mode. The field exposure condition was also used to test the influence of the electric field exposure time on the cell physiology. In this context, the cells were directed to the zigzag electrode and retained against the fluid flow for 0, 20 or 60 min. before they were directed to the sampling outlet and flushed out of the tubing system under extraction mode. In the associated control experiments without electric field exposure, the cells underwent the same manipulation procedure but were incubated in the chip at no field exposure condition. The influence of the DEP fields on the cytosolic Ca2+ concentration was analyzed by manipulating the cells at high field- and low field mode (Tab. 4-4) or without electric field exposure (no field exposure condition). Unless otherwise specified (u.o.s), the frequency of the applied electric fields was 1 MHz.
43
4 Methods
¯¯¯¯¯¯¯¯¯¯¯¯¯¯¯¯¯¯¯¯¯¯¯¯¯¯¯¯¯¯¯¯¯¯¯¯¯¯¯¯¯¯¯¯¯¯¯¯¯¯¯¯¯¯¯¯¯¯¯¯¯¯¯¯¯¯¯¯¯¯¯¯¯ Tab. 4-4: Electric and hydrodynamic parameter configuration for analyzing the influence of DEP manipulation on the cell physiology. Chip used: CeProm6
Assignment
Field exposure
No field exposure
Stream A
Culture medium
1.8 µl h-1
0 µl h-1
2.9 µl h-1
0.14 µl h-1
18.0 µl h-1
Stream B
Culture medium
-1
3.6 µl h
-1
0 µl h
-1
5.7 µl h
-1
0.29 µl h
36.0 µl h-1
Stream C
Culture medium
1.8 µl h-1
0 µl h-1
5.7 µl h-1
0.29 µl h-1
18.0 µl h-1
Waste
Culture medium
-1
-1
-1
-1
-39.6 µl h-1
Sheath flow
Culture medium
0.00 µl h-1
1800.0 µl h-1
-5.4 µl h
0 µl h
High field mode
Low field mode
-5.4 µl h
-0.54 µl h
1800.0 µl h-1
0 µl h-1
U electric field
3 V (u.o.s)
0V
3.0 V
1.2 V
1.5 V
ω electric field
1 MHz
-
1 MHz (u.o.s)
1 MHz (u.o.s)
1 MHz
Injector 1
-
Injector 2
Cells
0.0 µl h-1
Extraction mode
Contact formation between stem cells and functionalized nanobeads E14Tg2A mES cells 6 -1 (6 × 10 ml , in stem cell medium) and nanobeads were introduced into the DEP chip through injectors 1 and 2, respectively (see Fig. 4-10). The fluidic configuration was set to extraction mode (Tab. 4-5) until cells and beads moved in well-defined particle flows (see Fig. 5-32). Running the sheath flow during that time prevented the sampling outlet from contaminating with waste nanoparticles. Then, the configuration was switched to deflection mode and the cells were guided across the stream of nanobeads. After this, they were directed to the sampling outlet and flushed out of the tubing system under extraction mode. In this way, batches of several hundred or thousand stem cells were contacted to LIF-, SPARC- and BSA-coated nanobeads and deposited into gelatin-coated microwells.
Tab. 4-5: Electric and hydrodynamic parameter configuration for contacting mES cells with functionalized nanobeads.
4.7
Chip used: CeProm6
Assignment
Stream A
Stem cell medium
2.2 µl h-1
30.0 µl h-1
Stream B
Stem cell medium
4.3 µl h-1
60.0 µl h-1
Stream C
Stem cell medium
2.2 µl h-1
30.0 µl h-1
Waste
Stem cell medium
-1
- 75.6 µl h-1
Sheath flow
Stem cell medium
0.0 µl h-1
1800.0 µl h-1
Injector 1
Stem cells
Injector 2
Nanobeads
Deflection mode
Extraction Mode
- 6.5 µl h
U electric field
2.0 - 2.2 V
1.5 V
ω electric field
1 MHz
1 MHz
Thermometry
Calibration of the temperature within the microchannel was performed by attaching a heated oil immersion objective to the lower side of the DEP chip while the surface temperature of its upper side was analyzed by an infrared camera. The objective temperature was controlled by an objective
44
4.7 Thermometry
¯¯¯¯¯¯¯¯¯¯¯¯¯¯¯¯¯¯¯¯¯¯¯¯¯¯¯¯¯¯¯¯¯¯¯¯¯¯¯¯¯¯¯¯¯¯¯¯¯¯¯¯¯¯¯¯¯¯¯¯¯¯¯¯¯¯¯¯¯¯¯¯¯ heater. In preliminary experiments, a calibration curve between the temperature set point of the objective heater (Bioptechs, USA) and the real objective surface temperature was evaluated. For that, the objective temperature was measured with an infrared camera at different temperature set points. The mean surface temperature was estimated by averaging all pixel values of the obtained thermographic image (Fig. 4-11 A, the objective boundary is marked with a dotted line). For estimating the channel temperature, the DEP chip was filled with culture medium and attached to the 60 × oil immersion objective. The objective surface was heated to temperatures of 36.6, 37.7, 38.3, 38.9, 39.5, 40.0 and 41.1 °C. Thermographic images of the upper chip surface were taken by the infrared camera (see Fig. 4-11 B). The mean temperature along the cross axis of the microchannel area (dotted line, Fig. 4-11 B) was estimated and used for calculating the temperature profile along the central z-axis of the experimental setup (cross in Fig. 4-11 B, dotted line in Fig. 4-11 C). For that, a cross section of the setup was drawn with the finite element software FlexPDE (see Fig. 4-11 C). For each pair of objective- and channel surface temperature, the differential equations of the thermal flow at the thermal equilibrium were solved so that a temperature gradient along the central z-axis was obtained (see Fig. 4-11 D). From that, the temperature within the microchannel at different objective temperatures was estimated.
Fig. 4-11: Temperature control of the microchannel. (A) Thermographic image of the objective surface recorded by an infrared camera. (B) Thermographic image of the upper chip surface after attaching the heated oil immersion objective to the lower glass slide of the DEP chip. Scale bar, 3 mm. (C) Scheme of the experimental setup (cross section along the dotted line in B) which was used for numerically modeling the temperature profile along the central axis of the setup (black cross in B). For that, the upper and lower boundaries (marked in red) were set to the evaluated mean surface temperatures of the chip and the objective, respectively. The values for the thermal conductivity of air, glass, oil and the microchannel (filled with aqueous solution) were set to 0.02, 1, 0.6 and 0.6 W K-1 m-1, respectively. Note, that in the figure the horizontal and vertical proportions are not to the same scale. (D) Temperature profile along the central z-axis (cross in B, dotted line in C) simulated with FlexPDE. The dotted lines at 150, 300 and 330 µm indicate the interface between the 45
4 Methods
¯¯¯¯¯¯¯¯¯¯¯¯¯¯¯¯¯¯¯¯¯¯¯¯¯¯¯¯¯¯¯¯¯¯¯¯¯¯¯¯¯¯¯¯¯¯¯¯¯¯¯¯¯¯¯¯¯¯¯¯¯¯¯¯¯¯¯¯¯¯¯¯¯ immersion oil and the lower glass slide as well as the upper and lower inner face of the microchannel, respectively.
4.8
Numerical modeling
For the numerical simulation of the electric field within the microchannel the Quasi-Statics, Electromagnetics module of the finite element software, COMSOL Multiphysics (COMSOL, Burlington, MA, USA) was used. A section of the microchannel surrounding zigzag electrode z2 was drawn, as depicted in Fig. 4-1 E. The conductivity and permittivity of the medium within the box was set to 1.4 S m-1 and 78, respectively. The 3D distribution of the electric field strength was calculated for voltages of 3.0 and 1.2 V between the electrodes. The mean field strength that a cell experienced at a given distance d (Fig. 5-21 B) was evaluated by integrating the E-field over a 10 µm-diameter sphere.
46
4.8 Numerical modeling
¯¯¯¯¯¯¯¯¯¯¯¯¯¯¯¯¯¯¯¯¯¯¯¯¯¯¯¯¯¯¯¯¯¯¯¯¯¯¯¯¯¯¯¯¯¯¯¯¯¯¯¯¯¯¯¯¯¯¯¯¯¯¯¯¯¯¯¯¯¯¯¯¯
47
5 Results
¯¯¯¯¯¯¯¯¯¯¯¯¯¯¯¯¯¯¯¯¯¯¯¯¯¯¯¯¯¯¯¯¯¯¯¯¯¯¯¯¯¯¯¯¯¯¯¯¯¯¯¯¯¯¯¯¯¯¯¯¯¯¯¯¯¯¯¯¯¯¯¯¯
5
Results
5.1
Preliminary experiments out of the DEP chips
Before T cells could be activated in the DEP chips on a single-cell level, an adequate protocol for their activation as well as their cultivation as a single-cell was established. For reasons of simplicity, this was done out of the chip. Several methods for the in vitro activation of T cells have been developed (see section 3.4.4). They are based on the application of soluble or immobilized factors as well as the contact formation with other cells. Since the highest possible control over the activating stimulus in time and space is achieved by using immobilized factors for the stimulation, a protocol for the stimulation of T cells with surface-modified microbeads and APC was established.
5.1.1 Activation of primary T cells with APCs Primary T cells were incubated with APC over night followed by the analysis of their activation state by fluorescently labeled antibodies against the very early activation antigen CD69. The T cells were harvested from transgenic mice which produce MHC class I-restricted, ovalbumin-specific CD8+ T cells (OT-I cells). For antigen presentation, cells of the fetal skin dendritic cell line (FSDC) were used. Before the latter were incubated with the T cells, they had been loaded with a short amino acid sequence of ovalbumin (OVA257-264 peptide) or had been left untreated. The loaded cells presented the peptide on their surface which made them able to specifically stimulate the OT-I cells. As seen in Fig. 5-1, incubation with loaded FSDC led to brightly stained T cells while no CD69 expression was detected after incubation with unloaded FSDC.
Fig. 5-1: Activation of primary T cells with APCs. OT-I T cells were incubated over night with FSDC that (A) had been loaded before with OVA257-264 peptide or (B) had been left untreated. (C, D) T cell activation was detected by staining with fluorescently labeled antibodies against the very early activation marker molecule CD69 the next day. Scale bar, 30 µm.
48
5.1 Preliminary experiments out of the DEP chips
¯¯¯¯¯¯¯¯¯¯¯¯¯¯¯¯¯¯¯¯¯¯¯¯¯¯¯¯¯¯¯¯¯¯¯¯¯¯¯¯¯¯¯¯¯¯¯¯¯¯¯¯¯¯¯¯¯¯¯¯¯¯¯¯¯¯¯¯¯¯¯¯¯
5.1.2 Activation of Jurkat T cells with monoclonal antibodies In contrast to primary (OT-I) T cells, cells from the Jurkat T cell line have an unknown antigen specificity which makes activating them with antigen-loaded APC impossible. However, the TCR ligation by antigen-presenting MHC can be bypassed by stimulating the TCR-associated kinase CD3 directly. This can be achieved by exposing the cells to soluble or immobilized monoclonal anti-CD3 antibodies. Costimulatory signals were provided by anti-CD28. T cell activation with soluble and immobilized antibodies Jurkat T cells were stimulated by cultivating them for 16 - 24 h on an anti-CD3/anti-CD28-coated surface or by incubating them in 13.5 nM anti-CD3/anti-CD28 for 6 h. Alternatively, the cells were incubated over night in pure cell culture medium on an uncoated surface (control). After the incubation step, the cells were stained with FITC-conjugated anti-CD69 and analyzed in the fluorescence microscope. Fig. 5-2 A-F show that both, immobilized and soluble anti-CD3/anti-CD28 induced T cell activation, while no CD69 expression was detected in unstimulated T cells (89% ± 6% (n = 2), 65%, (n = 1) and 2% ± 1% (n = 3) activated T cells, respectively, Fig. 5-2 G). The survival rates of the cells in the three conditions added up to 96% ± 1%, 93.4% and 97.8% ± 0.1%.
Fig. 5-2: Activation of Jurkat T cells with antibodies against CD3 and CD28. Jurkat T cells were incubated over night (A) on an antibody-coated planar surface, (B) in cell culture medium containing soluble antibodies or (C) without antibody exposition. (D-F) T cell activation was detected the following day by live cell staining against CD69. Scale bar, 30 µm. (G) Quantification of the vitality and the activation state of the cells in D-F. Error bars, s.e.m.
T cell activation with functionalized microbeads In contrast to the stimulation with soluble antibodies, working with immobilized antibodies enables to control the stimulus presentation in time and space. Coupling the antibodies to microbeads allows manipulating the activating surface in a microfluidic system. The potential of antibody-coated beads to activate Jurkat T cells was tested by mixing them with the cells and incubating the suspension for 16 - 24 h. Alternatively, the T cells were incubated with uncoated beads. Both the vitality and the activation state of the cells were analyzed after the incubation step by brightfield microscopy and immunostaining against CD69, respectively (Fig. 5-3 A-D). As shown in Fig. 5-3 E, incubation with antibody-coated beads activated 96% ± 2% (n = 5) of all analyzed cells. In contrast, uncoated beads did not induce T cell activation (0.9% ± 0.2% activation rate, n = 2). Interestingly, the survival rate of the beadstimulated cells (86% ± 2%) was significantly lower than that of unstimulated cells (98.5% ± 0.5%, p < 0.05) or cells that had been activated by immobilized antibodies in a microwell (96% ± 1%, p < 0.05, Fig. 1.2 G, see previous section). 49
5 Results
¯¯¯¯¯¯¯¯¯¯¯¯¯¯¯¯¯¯¯¯¯¯¯¯¯¯¯¯¯¯¯¯¯¯¯¯¯¯¯¯¯¯¯¯¯¯¯¯¯¯¯¯¯¯¯¯¯¯¯¯¯¯¯¯¯¯¯¯¯¯¯¯¯ Time course of T cell activation Activation of the T cells is detected by immunostaining against the very early activation molecule CD69. The expression of this molecule upregulated after engagement of the TCR complex. Hence, the occurrence of the molecule in the outer leaflet of the cell membrane is a time-dependent process. In order to ensure that the T cell activation rate is not determined by the incubation time, it is advisable to measure it after the CD69 expression has reached a plateau. In this context, the time course of the CD69 expression was estimated by incubating the T cells with anti-CD3/anti-CD28-presenting microbeads for different periods of time followed by the analysis of their activation rate. Fig. 5-3 F shows the T cell activation rate for different stimulation times. A Gauss error function was fitted to the data. During the first 8 - 10 h it strictly increased before it leveled off at ca. 76% for the next 14 - 16 h. Hence, in all following experiments, T cell activation was analyzed 16 - 24 h after stimulus presentation.
Fig. 5-3: Activation of Jurkat T cells with anti-CD3/anti-CD28-coated microbeads. Jurkat T cells were incubated over night with (A) coated or (B) uncoated microbeads. (C, D) T cell activation was analyzed the following day by live cell staining against CD69. Scale bar, 30 µm. (E) Quantification of the vitality and activation state of the cells in (A) and (B). Error bars, s.e.m.; *p < 0.05. (F) Time course of the activation rate. T cells were incubated with antibody-coated microbeads for different times and subsequently analyzed for their activation state. A Gauss error function was fitted to the data. Error bars, s.e.m.
5.1.3 Single-cell cultivation In general, there is a critical number of cells below which their cultivation is hardly possible. This is presumably because cell-derived diffusible signals essential for maintaining cellular survival and proliferation are too dilute at low cell densities. For the successful cultivation of single cells after their manipulation on the chip, special effort has to be undertaken in order to overcome these limitations; either by the use of feeder layers or by conditioning the culture medium, the latter of which was employed in this work. Influence of the culture medium on the vitality of the cells Different medium compositions were tested for the cultivation of single Jurkat T cells. For that, fresh or thawed cell culture supernatant was mixed with entirely fresh culture medium at different mixing ratios. This so-called conditioned medium was used in the course of a limiting dilution assay for cultivating the single cells in a microplate. Wells containing single cells were examined for cell clones (conglomerates of at least three cells) after three and eight days.
50
5.1 Preliminary experiments out of the DEP chips
¯¯¯¯¯¯¯¯¯¯¯¯¯¯¯¯¯¯¯¯¯¯¯¯¯¯¯¯¯¯¯¯¯¯¯¯¯¯¯¯¯¯¯¯¯¯¯¯¯¯¯¯¯¯¯¯¯¯¯¯¯¯¯¯¯¯¯¯¯¯¯¯¯ As shown in Fig. 5-4, the cloning efficiency increased with the proportion of cell culture supernatant within the conditioned medium. Cultivating the cells in fresh culture medium resulted in a cloning efficiency of 2 % ± 2% (n = 2) after both, three and eight days of cultivation. In contrast, mixing ratios of 2 : 1 for cell culture supernatant and fresh medium increased these values to 72% ± 4% and 62% ± 4% (n = 3), respectively. While the usage of pure cell culture supernatant did not increase the cloning efficiency further (n = 1), freezing and thawing it did not reduce its capability for single-cell cultivation (60% ± 20% (n = 2) cloning efficiency for three and eight days of cultivation, respectively).
Fig. 5-4: Suitability of different medium compositions for single-cell cultivation. Defrosted or freshly prepared cell culture supernatant was mixed with culture medium at different mixing ratios. The solution was used for the cultivation of single Jurkat T cells in standard 96 well plates. The cloning efficiency was estimated after three or eight days of cultivation by evaluating the amount of single vital cells having divided two or more times during their cultivation. Error bars, s.e.m.
Influence of the culture dish on the vitality of the cells Besides the identification of an appropriate culture medium composition, the suitability of different culture plates for the cultivation of single cells was tested. For that, a limiting dilution assay was performed to deposit cells into the wells of the three different types of cell culture plates (Plate A, microplate; Plate B, standard 96 well plate; Plate C, glass bottom plate, see material section) followed by their further cultivation for seven to eight days. Subsequently, the amount of wells containing cell clones (conglomerates of at least three vital cells) was evaluated for each culture plate While more than 58% (n = 2) of the wells in culture plates of type A and B contained vital cell clones, no clones were grown in culture plate of type C (Fig. 5-5).
Fig. 5-5: Suitability of different culture plates for single-cell cultivation. Three different types of culture plates were used for cultivating Jurkat T cells at cell densities of 10 ml-1. After 7 - 8 days of cultivation, the cloning efficiency in each culture plate was estimated by evaluating the amount of wells containing conglomerates of at least three vital cells. Error bars, s.e.m. 51
5 Results
¯¯¯¯¯¯¯¯¯¯¯¯¯¯¯¯¯¯¯¯¯¯¯¯¯¯¯¯¯¯¯¯¯¯¯¯¯¯¯¯¯¯¯¯¯¯¯¯¯¯¯¯¯¯¯¯¯¯¯¯¯¯¯¯¯¯¯¯¯¯¯¯¯ Short-term incubation in fresh culture medium prior to single-cell cultivation The experiments described above have shown that a successful cultivation of single cells required their incubation in conditioned medium. However, working with the DEP chip possibly demands a manipulation of the cells in fresh culture medium for time periods of up to 1 h. Hence, it was tested if a short-term incubation step of the cells in fresh culture medium (prior to their further cultivation in conditioned medium) impairs the cell physiology. For that, 15 cells ml-1 were incubated in fresh culture medium for 0, 20 or 60 min. before they were transferred to conditioned medium and deposited as single cells into the antibody-coated wells of a microplate. The cells were cultivated over night and analyzed for their vitality, proliferation-, and activation state after this. As shown in Fig. 5-6, incubating the cells in fresh culture medium decreased neither the proportion of vital cells (80%, 73% and 82% for 0 min., (n = 10), 20 min. (n = 11) and 60 min. (n = 11) incubation time, respectively) nor that of activated cells (70%, 55%, 64%). Only the percentage of proliferated cells was slightly reduced for cells which had been incubated for 60 min. in fresh culture medium (27%) compared to those of shorter incubation times (40% and 45% for 0 min. and 20 min., respectively).
Fig. 5-6: Single-cell cultivation after a short-term incubation step in fresh culture medium. Single cells were incubated in fresh culture medium for different incubation times before they were transferred to conditioned medium and cultivated over night in an antibody-coated microwell. Their vitality-, activation- and proliferation state was analyzed after this.
5.2
Activation of single T cells employing the DEP chips
After having identified experimental conditions for both the activation of T cells with functionalized microbeads and single-cell cultivation, a protocol was established for their stimulation on a single-cell level employing the DEP chips. In this context, two strategies were pursued. The first one was called post-chip activation protocol. Here, cells and beads were contacted with each other in the microchannel followed by their isolation from the chip system and their further cultivation in a microwell over night. The following day, their activation state was analyzed by staining the cells with fluorescent antibodies against the activation marker molecule CD69. The second strategy was called on-chip activation protocol. Here, the incubation of the bead-contacted cells over night as well as the analysis of their activation state by antibody staining was performed within the microchannel.
52
5.2 Activation of single T cells employing the DEP chips
¯¯¯¯¯¯¯¯¯¯¯¯¯¯¯¯¯¯¯¯¯¯¯¯¯¯¯¯¯¯¯¯¯¯¯¯¯¯¯¯¯¯¯¯¯¯¯¯¯¯¯¯¯¯¯¯¯¯¯¯¯¯¯¯¯¯¯¯¯¯¯¯¯
5.2.1 Chip design and microfluidic configuration For both strategies, the inlets and outlets of the microchannel system were assigned as depicted in Fig. 5-7 A. Cells and antibody-presenting beads were introduced into the system through two different inlets on the left side, so that the respective suspensions moved in parallel trajectories. Cell culture medium was supplied to the chip through a third central inlet at the same flow rate as that for cells and particles. Two of the three outlets on the right side were controlled by withdrawing the fluid with a syringe pump and were used to discard unprocessed or waste particles. For a possible live-cell staining of the activated cells in context of the on-chip activation protocol, fluorescently labeled anti-CD69 was optionally introduced via a fourth inlet. In context of the postchip activation protocol, a fast sheath flow served to transport the manipulated cells from the sampling outlet to the exit of the microfluidic tubing system where they were deposited into a well of a microplate. In order to efficiently initiate the cell-bead contact, an electrode design was chosen that allowed to direct single T cells and beads to a single zigzag electrode. This was best met by an electrode configuration with deflection-, switch- and zigzag electrodes in a row (see Fig. 5-7 B). Deflection electrodes downstream the zigzag electrode served to direct unprocessed particles to the waste outlet. They also ensured that only successfully processed particles were forwarded to the sampling outlet (in case of the post-chip activation protocol).
Fig. 5-7: Chip design and microfluidic configuration. (A) Microfluidic configuration. The suspensions of beads and T cells enter the chip through two separate inlets and pass the central processing area (detailed in B) in two parallel laminar flows. Unprocessed objects leave the chip through the two waste channels. For a possible live-cell staining in context of the on-chip activation protocol, fluorescently labeled antibodies against CD69 are optionally introduced via a fourth inlet. In context of the post-chip activation protocol, the formed particle pairs are moved to the sampling outlet where they are flushed out from the microfluidic system by means of a fast sheath flow. (B) Microelectrode design and particle manipulation in the central processing area. By means of consecutively arranged deflection- and switch electrodes, individual cells and beads are dielectrophoretically selected from their respective particle flows and directed to a zigzag electrode which retains the objects against the fluid flow (going from left to right). Further electrodes allow sorting processed and unprocessed particles to the different outlets. d, deflection electrode; s, switch electrode; z, zigzag electrode; scale bar, 250 µm.
53
5 Results
¯¯¯¯¯¯¯¯¯¯¯¯¯¯¯¯¯¯¯¯¯¯¯¯¯¯¯¯¯¯¯¯¯¯¯¯¯¯¯¯¯¯¯¯¯¯¯¯¯¯¯¯¯¯¯¯¯¯¯¯¯¯¯¯¯¯¯¯¯¯¯¯¯
5.2.2 Pair formation procedure After having been transported to the central processing area, (see Fig. 5-7 B) single cells and beads were selected from their respective particle flows and directed to the area of contact formation (ACF, white box in Fig. 5-7 B), where they were formed into pairs. In contrast, unprocessed particles were discarded to either of the two waste outlets. Fig. 5-8 visualizes the process of pair formation in more detail. After having been displaced to the ACF, cells (yellow arrows) and beads (red arrows) reached a special switch element consisting of a central peak electrode (s1) and two lateral deflection elements (s2 and s3) for sideward guiding. Depending on which of the three electrodes was inactive, consecutively approaching particles were directed individually and very quickly (i) to either of two holding positions in the zigzag electrode (z1 and z2, Fig. 5-8), where they formed contact, or (ii) to the waste outlet. For example, directing cells and particles to the holding position z2 required the deflection electrode s3 being inactive.
Fig. 5-8: Pair formation procedure. (A) The T lymphocytes (yellow arrow) are deflected to the channel center and (B) directed by the switch electrodes (s1-s3) to one of the retaining positions of the zigzag electrode (z1 and z2). (C) The same procedure is repeated with the beads (red arrow), resulting ultimately in the formation of cell-bead pairs (D, arrows). The fluid flow is going from left to right. Scale bar, 100 µm.
5.2.3 Post-chip activation protocol Isolation of the manipulated cells from the fluidic system Following the pair formation procedure, the cell-bead pairs were transported to the sampling outlet. Precise fluidic and electric control ensured that no additional cells or particles besides the cell-bead pair of interest reached the outlet simultaneously. Thus, the efficiency of separating target pairs and waste particles was 100%. At the outlet, a constant flow of conditioned cell culture medium maintained the sheath flow (1800 µl h−1) which accelerated the cell-bead pair to a velocity of 1 cm s−1 and transported it to the exit of the tubing system. After a short period of time depending on the sheath flow rate, the medium formed a droplet at the exit containing the pair which could, thus, be collected into a well of a microplate. 54
5.2 Activation of single T cells employing the DEP chips
¯¯¯¯¯¯¯¯¯¯¯¯¯¯¯¯¯¯¯¯¯¯¯¯¯¯¯¯¯¯¯¯¯¯¯¯¯¯¯¯¯¯¯¯¯¯¯¯¯¯¯¯¯¯¯¯¯¯¯¯¯¯¯¯¯¯¯¯¯¯¯¯¯ In order to evaluate the chip-based procedure with respect to the isolation efficiency of single particles, the possible fate of flushed out T cells has to be considered (Fig. 5-9): after they had been swept along by the sheath flow (n = 104), the cells could successfully be isolated from the chip and be deposited into a microplate. In some cases, cell and bead dissociated due to the acceleration process or the target pair got lost on the transfer from the chip to the microplate, e.g. when it got stuck in the tubing system downstream from the sampling outlet. The probability to successfully isolate a single pair was 75% of all flushed-out cell-bead pairs. As T cell activation can only be analyzed several hours after the initiation of the cell-bead contact, the pairs were incubated for 16 24 h prior to analysis. During this period, the contact between cell and bead was lost in some pairs while it stayed intact in 96% of all incubated pairs. In conclusion, 75% × 96% = 72% of all manipulated T cells formed the basic population which was then analyzed for the biological parameters vitality and activation.
Fig. 5-9: Efficiency of single-cell isolation from the fluidic system. Two effects are visualized that reduce the number of analyzable cell-bead pairs with respect to the number initially formed. 75% of all formed pairs (n = 104) reach the target well without being lost or disassembled. Of these, 96% remain in contact after one day when the analysis is performed. Thus, in all, 75% × 96% = 72% of all processed T cells were available for analysis.
Analysis of the survival- and activation rate of the chip-manipulated cells After the formed cell-bead pairs had been flushed out from the fluidic system, they were cultivated further. 16 - 24 h after their deposition in the microwells the survival- and activation rates were analyzed. Cells that were subjected to the same manipulation procedure except for omitting the beads formed the control group. In a third experiment, single cells did not undergo dielectrophoretic manipulation o the chip but were pipetted into the microwells in a limiting dilution assay. They, too, were analyzed for their survival- and activation rate after an incubation step of 16 - 24 h. The results are shown in Fig. 5-10: while 95% of all pipetted single cells (n = 20) were vital the following day, the survival rate of the chip-manipulated cells was slightly reduced (85%, n = 26 and 76%, n = 29 for the noncontacted and the bead-contacted cells, respectively). Analysis of the activation rate revealed spontaneous activation in 11% (n = 19) and 5% (n = 22) of the non-contacted cells when handled by pipette or by DEP chip, respectively. In contrast, 77% of all bead-contacted cells (n = 22) were clearly activated, indicated by the brightly stained membrane after incubation in fluorescently labeled antibodies against the activation marker molecule CD69 (see Fig. 5-15 B).
55
5 Results
¯¯¯¯¯¯¯¯¯¯¯¯¯¯¯¯¯¯¯¯¯¯¯¯¯¯¯¯¯¯¯¯¯¯¯¯¯¯¯¯¯¯¯¯¯¯¯¯¯¯¯¯¯¯¯¯¯¯¯¯¯¯¯¯¯¯¯¯¯¯¯¯¯
Fig. 5-10: Biological analysis of the manipulated Jurkat T cells. Survival rate and activation rate were examined after manipulation either by dielectrophoretic sorting in the chip or by pipetting. (A) Survival rate of single cells. Cells were either contacted in the chip with anti-CD3/anti-CD28-coated beads or subjected to the same chip procedure without beads. Alternatively, single cells that did not undergo the chip manipulation were deposited into a microwell by pipetting. (B) Activation rate of vital cells in (A).
5.2.4 On-chip activation protocol Analysis of the survival- and activation rate of the chip-manipulated cells Single Jurkat T cells or human PBL were contacted with functionalized microbeads as described in section 5.2.2 and incubated for 15 - 18 h on-chip. During that time, the temperature in the microchannel was kept at 37 °C (see below). Since prolonged electric field exposure can impair the vitality of the cells (see Fig. 5-20) the electrodes were switched off during the entire incubation period. To still keep the cells at their position, undesirable movement of the channel medium was disabled by switching off the fluid flow and sealing the exit of the microfluidic system. After the incubation period was over, the vitality and activation states of the cells were analyzed by live-cell staining on-chip (see below). In contrast to the high vitality rates obtained in context with the post-chip activation protocol described in the previous section (see Fig. 5-10), none of the analyzed Jurkat T cells (n = 10) were vital after over night incubation on-chip. Moreover, none of those that were additionally stained showed T cell activation (n = 6). Repetition of these experiments with PBL did not enhance the survival rate (0%, n = 6). However, T cell activation was detected in one out of four stained PBL (Fig. 5-11).
Fig. 5-11: On-chip activation protocol, analysis of vitality and activation state. A human PBL was contacted with two antibody-coated microbeads and incubated on-chip at 37 °C over night. (A) After its incubation in the microchannel for 18 h, the T cell showed an irregular bulge in its plasma membrane (bleb) which indicated cell damage. (B, C) After live-cell staining on the chip, the same cell (arrowhead) showed a stained membrane in the fluorescence image which indicated CD69 expression and, thus, T cell activation. Scale bar, 20 µm. 56
5.2 Activation of single T cells employing the DEP chips
¯¯¯¯¯¯¯¯¯¯¯¯¯¯¯¯¯¯¯¯¯¯¯¯¯¯¯¯¯¯¯¯¯¯¯¯¯¯¯¯¯¯¯¯¯¯¯¯¯¯¯¯¯¯¯¯¯¯¯¯¯¯¯¯¯¯¯¯¯¯¯¯¯ Temperature control of the microchannel The incubation step of the cell-bead pair in the microchannel required controlling the temperature at physiological levels to maintain the cellular metabolism. Unfortunately, the experimental setup did not fit into a microscope climate chamber (see Fig. 4-3). Instead, heating of the microchannel was performed by attaching an oil immersion objective which was temperature controlled on its part by an objective heater (see methods section for details). However, heat dissipating made the temperature within the microchannel differ from that of the objective and demanded a calibration curve between both parameters so that the microchannel temperature could be adjusted properly. Since the temperature within the microchannel could not be measured directly, an infrared camera was used to analyze the surface temperature at the channel upper side, while the temperature at the lower channel side was set to different values by the heated objective. The gained information was used to calculate the temperature within the microchannel at each objective temperature by using the finite element software FlexPDE (see methods section). The evaluated calibration curve is shown in Fig. 5-12. Within the range of the tested objective temperatures, a linear relationship between both parameters was observed (R2 = 0.9999). Controlling the microchannel to a mean temperature of 37 °C required the objective temperature to be set to 40.2 °C.
Fig. 5-12: Temperature control of the microchannel. An oil immersion objective was heated with an objective heater and attached to the bottom slide of the microchannel. Simultaneously, the surface temperature of the upper channel slide was analyzed with an infrared camera (see methods section). By using the finite element software FlexPDE, the mean temperature within the microchannel was calculated numerically for each objective temperature. The data was fitted by linear regression. Error bars indicate the temperatures at the upper and the lower inner face of the microchannel.
Antibody staining of the chip-manipulated cells on-chip Evaluating the activation state of the T cells on-chip by live-cell staining with fluorescently labeled antibodies required replacing the culture medium in the microchannel by antibody solution with the cell being simultaneously retained in the zigzag electrode against the fluid flow. In preliminary experiments, the amount of the introduced antibody solution necessary for exchanging the channel medium was evaluated. For that, fluorescently labeled antibodies were introduced into the channel system at a constant flow rate while the ACF (box in Fig. 5-7 B) was monitored with a fluorescence microscope (Fig. 5-13 A-D). The fluorescence intensity of the area surrounded by the red circle in Fig. 5-13 A was plotted against the introduced volume of antibody solution. Then, a Gauss error function was fitted to the data (Fig. 5-13 E). From this, the amount of introduced antibody solution necessary for shifting the fluorescence intensity to 2.5% (dead volume) and from there to 97.5% (turning volume) 57
5 Results
¯¯¯¯¯¯¯¯¯¯¯¯¯¯¯¯¯¯¯¯¯¯¯¯¯¯¯¯¯¯¯¯¯¯¯¯¯¯¯¯¯¯¯¯¯¯¯¯¯¯¯¯¯¯¯¯¯¯¯¯¯¯¯¯¯¯¯¯¯¯¯¯¯ of the maximum intensity was estimated. The same procedure was performed for replacing the antibodies in the channel again by fresh cell culture medium. Altogether, the fluorescence intensity reached 97.5% of its maximum after introducing 490 µl ± 90 µl into the chip system (n = 3, Tab. 5-1). Washing the stained cells required the introduction of 440 µl ± 30 µl culture medium in order to supplant the antibody solution with fresh medium again. The dead volume was 360 µl ± 60 µl for the staining-, and 330 µl ± 40 µl for the washing step. After this, the live-cell staining procedure in the chip was established. For that, activated T cells were produced out of the chip and introduced into the chip system. A single cell-bead pair was selected from the suspension and directed to the zigzag electrode where it was retained against the fluid flow. Simultaneously, the content of the microchannel was exchanged with fluorescently labeled anti-CD69 and washed again with fresh culture medium. Fig. 5-13 F and G show brightfield and fluorescence pictures of the cell after the staining procedure. The successful live-cell staining is indicated by the brightly stained membrane in the fluorescence image.
Fig. 5-13: Live-cell staining on the DEP chip. (A-D) Amount of introduced antibody solution required for replacing the culture medium in the microchannel (for microfluidic configuration, see Fig. 5-7 A). Different volumes of fluorescently labeled anti-CD69 solution were introduced into the microchannel while the background fluorescence at the retaining position z1 (dotted circle, see also Fig. 5-8) was analyzed. Scale bar, 50 µm. (E) The kinetics of the fluorescence signal inside the red circle in A-D was plotted against the amount of introduced antibody solution. The data of one out of three experiments is shown. A Gauss error function was fitted to the data. Both, the required volume for replacing the first 2.5% (dead volume) and the following 95% (turning volume) of the culture medium with antibody solution were estimated from the fit. (F, G) Brightfield- and fluorescence image of an activated T cell that was stained in the DEP chip with fluorescently antibodies against the activation marker molecule CD69. Activated T lymphocytes were produced out of the chip before they were introduced into the chip system and directed to the hook electrode. They were held against the fluid flow while the channel medium was replaced with anti-CD69-FITC. After that, they were washed again with fresh cell culture medium before image acquisition. Scale bar, 10 µm.
58
5.3 Correlation of short- and long-term responses to the applied bead stimulus
¯¯¯¯¯¯¯¯¯¯¯¯¯¯¯¯¯¯¯¯¯¯¯¯¯¯¯¯¯¯¯¯¯¯¯¯¯¯¯¯¯¯¯¯¯¯¯¯¯¯¯¯¯¯¯¯¯¯¯¯¯¯¯¯¯¯¯¯¯¯¯¯¯ Tab. 5-1: Amount of introduced liquid necessary for exchanging the channel medium. The values for the dead volume and the turning volume were evaluated from the data of three experiments each of which a Gauss curve was fitted to as described in Fig. 5-13 E.
5.3
Staining step (n = 3)
Washing step (n = 3)
mean
mean
s.e.m.
s.e.m.
Dead volume
360 nl
± 60 nl
330 nl
± 40 nl
Turning volume
130 nl
± 30 nl
108 nl
± 4 nl
Sum
490 nl
± 90 nl
440 nl
± 30 nl
Correlation of short- and long-term responses to the applied bead stimulus
As shown in the previous section, the DEP chips allow triggering of cell- or surface-mediated signal transduction processes in single Jurkat T cells when subjected to the post-chip activation protocol. A big advantage of this technique emerges from the possibility to precisely initiate and investigate cell-cell or cell-bead contacts in combination with the isolation of the manipulated cells from the chip system. This enables not only the analysis of long-term reactions of the cells to a given stimulus, but also monitoring reactions on a shorter time scale like immediate changes in the cytosolic Ca2+ concentration seconds or minutes after the stimulus presentation. Moreover, the possibility to isolate the cells from the fluidic system after manipulation even enables to correlate the recorded short-term responses with later reactions of the same cell after several hours or even days. To further exploit this very interesting feature of the technique, single Jurkat T cells were stimulated with functionalized microbeads while their cytosolic Ca2+ concentration was recorded before, during and five minutes after the contact formation procedure. After this, the cells were released from the system, cultivated further and analyzed for their vitality, activation- and proliferation state after over night incubation. Finally, the short-term responses to the bead stimulus were correlated with the long term reactions for each individual cell.
5.3.1 Chip design and microfluidic configuration For the separate introduction of cells and beads into the microchannel, the release of the formed cell-bead pairs from the fluidic system and the removal of waste particles, a microfluidic configuration was chosen that was similar to that used in the experiments described in the previous section. It is depicted in Fig. 5-14 A. Two neighboring inlets on the left side of the microchannel system served to introduce cells and particles, while cell culture medium was applied through a third one at twice the flow rate as for cells and beads. This made the two particle flows move in parallel trajectories in the upper half of the central channel. At the central processing area (box in Fig. 5-14 A), single cells and beads were contacted with each other. While waste particles were forwarded to either of the two waste outlets, the cell-bead pair of interest was directed to the sampling outlet where it was released from the fluidic system by a fast sheath flow. The analysis of the cytosolic Ca2+ concentration before and after the bead stimulation required controlling the exact time point of contact formation between the cell and the bead. In this context, a special electrode design was chosen that allowed selecting single cells and beads from their 59
5 Results
¯¯¯¯¯¯¯¯¯¯¯¯¯¯¯¯¯¯¯¯¯¯¯¯¯¯¯¯¯¯¯¯¯¯¯¯¯¯¯¯¯¯¯¯¯¯¯¯¯¯¯¯¯¯¯¯¯¯¯¯¯¯¯¯¯¯¯¯¯¯¯¯¯ respective particle flow and prepositioning them in two consecutively arranged zigzag electrodes so that the cell-bead contact could be initiated at the push of a button (see Fig. 5-14 B). Appropriate deflection elements upstream and downstream of the zigzag electrodes were required for directing the selected cells and beads to their holding positions in the zigzag electrodes as well as for transporting the analyzed bead-contacted cells to the sampling outlet, respectively.
5.3.2 Pair formation procedure Analogously to the procedure described in section 5.2.2, Fura-loaded cells and beads were introduced into the microfluidic system and transported hydrodynamically to the central processing area (see Fig. 5-14 B). The deflection elements d1 and d2 were used to individually direct cells and beads to the successively arranged zigzag elements z1 and z2 where they were held against the fluid flow for 5 min. During that time, the cytosolic Ca2+ concentration was monitored for the purpose of estimating the baseline Ca2+ level. Subsequent deactivation of the zigzag electrode z1 made the bead hydrodynamically relocate towards the zigzag element z2, where it was presented to the cell stored there (see Fig. 5-14 C). Shortly after the bead presentation the cell attached to the particle and both objects formed a stable cell-bead pair. The time point of the bead presentation after the bead release mainly depended on the flow rate in the microchannel and, thus, could be controlled with high precision. The cytosolic Ca2+ concentration was analyzed during and after the contact formation procedure (at 1-2 frames s-1 over a period of 5 min.), so that it could be aligned with the bead presentation at sub-second resolution.
Fig. 5-14: Particle manipulation on the DEP chip for the analysis of the cytosolic Ca2+ level. (A) Microfluidic configuration. Cells and beads enter the chip through two neighboring inlets. Cell culture medium is applied through a third inlet below, so that both, cells and beads move in the upper half of the central channel. At the central processing area (box, detailed in B), contact 60
5.3 Correlation of short- and long-term responses to the applied bead stimulus
¯¯¯¯¯¯¯¯¯¯¯¯¯¯¯¯¯¯¯¯¯¯¯¯¯¯¯¯¯¯¯¯¯¯¯¯¯¯¯¯¯¯¯¯¯¯¯¯¯¯¯¯¯¯¯¯¯¯¯¯¯¯¯¯¯¯¯¯¯¯¯¯¯ formation between cells and beads takes place. While unprocessed objects leave the chip through either of two waste channels, the particle pairs formed are forwarded to the sampling outlet where they are flushed out from the microfluidic system by means of a fast sheath flow. (B) Pair formation procedure. After having been introduced into the chip system, Fura-loaded cells (open arrows) and beads (filled arrows) move in parallel trajectories according to the fluid flow going from left to right. By means of the deflection electrodes d1 and d2, single beads and cells are directed to the zigzag element z1 or z2, respectively. A subsequent inactivation of z1 hydrodynamically relocates the bead towards the cell. Shortly after the bead presentation the cell attaches to the particle and both objects form a stable cell-bead pair. The cytosolic Ca2+ concentration is monitored 5 min. before and 5 min. after the bead presentation. After the manipulation and imaging procedure, the cell-bead pair is directed to the sampling outlet and deposited into a well of a microplate. In contrast, unprocessed particles are discarded to the waste outlet. (C) Time series of the contact formation procedure between an antibody-coated microbead and a Fura-loaded T cell held in the zigzag element z2 (see A). The cytosolic Ca2+ level strongly increases ca. 120 s after initiation of the cell-bead contact. Scale bar, 20 µm. (D) A typical course of the cytosolic Ca2+ level of a bead-contacted T cell. Ca2+ traces were analyzed for the trace characteristics contact latency, response latency, and rising time; the heights of the initial peak and the maximum peak; as well as the slope of the Ca2+ trace (see text and methods section).
5.3.3 Analysis of the calcium traces A typical course of the intracellular Ca2+ concentration is shown in Fig. 5-14 D. During the unstimulated period of the first 5 min., [Ca2+]i is at baseline level (ca. 60 nM). After the bead presentation and the subsequent contact formation of the cell with the functionalized bead, the Ca2+ concentration remains at the baseline level for one to two minutes, before it rapidly rises to a concentration of several hundred nM. After that, the Ca2+ level again slowly decays. The resulting Ca2+ traces were analyzed for the trace characteristics contact latency, response latency, and rising time, as well as the heights of the initial peak and the maximum peak. Moreover, the slope and the baseline of the Ca2+ trace were estimated (see Fig. 5-14 D and the methods section for details).
5.3.4 Analysis of the survival-, activation- and proliferation rates After the imaging procedure, each of the bead-contacted cells was transported to the exit of the fluidic system where it was deposited into a well of a microplate. The collected cells were cultivated for 16-24 h and analyzed for their vitality, activation- and proliferation state after this. 74% of all manipulated cells were vital the next day (Fig. 5-15 D) and, thus, were available for further analysis. Their proliferation rate was detected by investigating the amount of divided cells among all analyzed. While 50% of all vital cells were activated, the proliferation rate was 44%.
61
5 Results
¯¯¯¯¯¯¯¯¯¯¯¯¯¯¯¯¯¯¯¯¯¯¯¯¯¯¯¯¯¯¯¯¯¯¯¯¯¯¯¯¯¯¯¯¯¯¯¯¯¯¯¯¯¯¯¯¯¯¯¯¯¯¯¯¯¯¯¯¯¯¯¯¯
Fig. 5-15: Analysis of the bead-stimulated T cells after their isolation from the microfluidic system and over night incubation in a microwell. (A, B) Brightfield and fluorescence image of an activated T cell after staining with dye-labeled antibodies against the activation marker molecule CD69. Binding of the antibodies to the membrane makes the cell appear as a bright circle in the microscope image. (C) Image of a bead-stimulated T cell that had divided during over night incubation. Scale bar, 10 µm. (D) Quantification of vitality-, activation- and proliferation rates of the incubated cells. Evaluation of vitality was done for all manipulated cells, while only vital cells were analyzed for their activation- and proliferation state.
5.3.5 Correlation of the short-term Ca2+ responses with later events in the activation process After the proliferation and the activation states of the manipulated cells had been analyzed, the gathered information was compared with the previously recorded Ca2+ signals for its eventual identification as an early indicator for the later reaction. In this context, all analyzed parameters of the Ca2+ traces (see section 5.3.3) of dividing and activated cells were compared to those of nondividing and non-activated cells, respectively. A significant difference between activated and non-activated cells was detected in the rising time (80 s vs. 51 s, p < 0.05, Fig. 5-16 A and B). All other parameters were statistically equal between the both cell populations (p > 0.05). In the case of dividing vs. non-dividing cells, a significant difference was detected in the maximum peak heights (500 nM vs. 380 nM, p < 0.05, Fig. 5-16 C and D) of the cells. Again, the other parameters were statistically equal (p > 0.05).
62
5.3 Correlation of short- and long-term responses to the applied bead stimulus
¯¯¯¯¯¯¯¯¯¯¯¯¯¯¯¯¯¯¯¯¯¯¯¯¯¯¯¯¯¯¯¯¯¯¯¯¯¯¯¯¯¯¯¯¯¯¯¯¯¯¯¯¯¯¯¯¯¯¯¯¯¯¯¯¯¯¯¯¯¯¯¯¯
Fig. 5-16: Correlation of the short- and long-term responses to the applied bead stimulus. Single Jurkat T cells were stimulated with antibody-coated microbeads in the DEP chips and analyzed for their cytosolic Ca2+ concentration. The Ca2+ trace of each individual cell was analyzed for the mean trace characteristics contact latency, response latency, rising time, baseline, initial peak height, maximum peak height, slope and baseline fluctuation (for details, see text). After that, the cells were released from the microfluidic system and cultivated further. The following day, the proliferationand activation state of the cells was analyzed and correlated with the previously analyzed Ca2+ signal. For that, the values of the analyzed trace characteristics of (A, B) activated and non-activated cells and of (C, D) dividing and non-dividing cells were averaged. Error bars, s.e.m.; n ≥ 15; *p < 0.05.
5.3.6 Control experiments Influence of Fura-loading on the survival- and activation rate To ensure that Fura-loading did influence neither the survival- nor the activation rate, the cells were loaded with the dye as described in the methods section and transferred into an antibody-coated microwell. Alternatively, the cells remained unloaded or were seeded in an uncoated well. After over night incubation, their vitality and activation state was analyzed. As shown in Fig. 5-17 A, loading of the cells with Fura-2 neither affected the vitality of stimulated (96.0% ± 0.7%) nor that of unstimulated cells (97.1% ± 0.1%) compared to stimulated and unstimulated cells without Fura-loading (96% ± 1% and 97.8 ± 0.1%, respectively). In the same way, neither the antibody-induced expression of CD69 in the stimulated nor the spontaneous activation rate in the unstimulated cells were affected by Fura-2 loading (Fig. 5-17 B): after over night incubation on an antibody-coated surface, unloaded or loaded cells showed activation rates of 89% ± 6% and 92% ± 4%, respectively, while the amount of spontaneously activated cells after their cultivation in uncoated wells was 2% ± 1% and 3% ± 1%.
63
5 Results
¯¯¯¯¯¯¯¯¯¯¯¯¯¯¯¯¯¯¯¯¯¯¯¯¯¯¯¯¯¯¯¯¯¯¯¯¯¯¯¯¯¯¯¯¯¯¯¯¯¯¯¯¯¯¯¯¯¯¯¯¯¯¯¯¯¯¯¯¯¯¯¯¯
Fig. 5-17: Influence of the Fura-loading on (A) the vitality and (B) the activation state of Jurkat T cells. T cell activation in Fura-loaded or unloaded T cells was triggered by their incubation in an antibody-coated microwell. Alternatively, the cells were left unstimulated by their cultivation in an uncoated well. After 16 - 24 h their vitality and activation state was analyzed. Error bars, s.e.m.; n = 2.
Calcium imaging after contact formation with uncoated beads Next, the detected Ca2+ transients in the bead-stimulated single cells (see section 5.3.3) were excluded to be elicited by non-specific interactions between the cell and the functionalized microbeads. For that, single Furaloaded cells were contacted in the DEP chip with uncoated microbeads while their cytosolic Ca2+ level was recorded (n = 8). As shown in Fig. 5-18 A, this did not induce major alterations of the cellular Ca2+ level. For comparison, Fig. 5-18 B shows 8 representative Ca2+ transients elicited by contact formation with antibody-coated beads.
Fig. 5-18: Ca2+ signals after contact formation with antibody-coated and uncoated microbeads. According to the pair formation procedure described in section 5.3.2, single Fura-loaded T cells were contacted with antibody-coated or uncoated microbeads in the DEP chip. Immediately after the bead presentation, the cytosolic Ca2+ level was analyzed for a period of 5 min. (A) Ca2+ traces of cells that were contacted with uncoated beads (n = 8). (B) Eight representative Ca2+ traces elicited by contact formation with antibody-coated beads.
64
5.4 Impact of the chip manipulation procedure on the cell physiology
¯¯¯¯¯¯¯¯¯¯¯¯¯¯¯¯¯¯¯¯¯¯¯¯¯¯¯¯¯¯¯¯¯¯¯¯¯¯¯¯¯¯¯¯¯¯¯¯¯¯¯¯¯¯¯¯¯¯¯¯¯¯¯¯¯¯¯¯¯¯¯¯¯
5.4
Impact of the chip manipulation procedure on the cell physiology
5.4.1 DEP manipulation A very important question in context with the DEP manipulation of live cells is whether the electric field exposure impairs the cell physiology. Especially complex manipulation tasks, like the specific stimulation of single cells with functionalized microbeads, necessitate information about tolerable exposure times or electric field strengths, in order to design the optimal experimental procedure. Influence of the electric field strength on the vitality-, activation- and proliferation rate To test the influence of the applied electrode voltage during DEP manipulation on the cell physiology, single Jurkat T cells were brought into the chip and dielectrophoretically directed to the zigzag electrode. Here, they were retained against the fluid flow for 30 s before they were moved to the exit of the fluidic system and collected in an anti-CD3/anti-CD28-coated microwell. After over night incubation in the microwell, their vitality, activation- and proliferation state was analyzed. As illustrated in Fig. 5-19, neither the amount of vital, nor that of activated or proliferated cells decreased with the applied electrode voltage. For an electrode voltage of 1.5 V, the tested parameters were at 94%, 75% and 31%, respectively (n = 16). In contrast, manipulation of the cells at 3.0 V did not reduce these values (100%, 82% and 41%, n = 18). The other electrode voltages (1.8 V, 2.2 V and 2.6 V) showed similar values for the tested parameters.
Fig. 5-19: Influence of the applied electrode voltage on the physiology of DEP-manipulated cells. Single Jurkat T cells were directed to the hook electrode where they were dielectrophoretically retained against the fluid flow at different electrode voltages for 30 s. After this, they were transported to the sampling outlet, deposited into an antibody-coated microwell and cultivated over night (note, that due to the different manipulation steps the overall electric field exposure time added up to 1 - 2 min.). Their vitality, activation- and proliferation states were analyzed the following day.
Influence of the electric field exposure time on the vitality-, activation- and proliferation rate Next, tolerable electric field exposure times were evaluated for single Jurkat T cells. For that, the cells were directed to the zigzag electrode where they were incubated for 20 or 60 min. under no field exposure or field exposure condition (see Tab. 4-4), before they were moved to the exit of the system and deposited into an antibody-coated microwell. Alternatively, the selected cells were immediately directed to the exit without retention in the zigzag (0 min.). The manipulated cells were cultivated for 16 - 24 h before their vitality, proliferation and activation states were analyzed. 65
5 Results
¯¯¯¯¯¯¯¯¯¯¯¯¯¯¯¯¯¯¯¯¯¯¯¯¯¯¯¯¯¯¯¯¯¯¯¯¯¯¯¯¯¯¯¯¯¯¯¯¯¯¯¯¯¯¯¯¯¯¯¯¯¯¯¯¯¯¯¯¯¯¯¯¯ Without an additional incubation step in the chip system, 94% of the DEP-manipulated single cells were vital the next day. The same amount (94%) was activated, while 78% of all manipulated cells had proliferated during over night incubation (Fig. 5-20, 0 min., n = 18). After having been incubated for 20 min. without electric field exposure, the cells showed reduced parameters the next day (71%, 43% and 29%, n = 7). Incubating the cells for the same duration under field exposure condition (n = 7) led to similar values as under no field exposure condition, albeit a slightly reduced amount of vital cells (57%) was detected. A different situation was observed after 60 min. incubation. Without electric field exposure, the tested parameters (67%, 50% and 17%, n = 7) were in the same range like those after 20 min. incubation time under no field exposure condition. In contrast, a 60 min. exposure to electric fields strongly reduced the amount of vital, activated and proliferated cells (29%, 14% and 0%, n = 6).
Fig. 5-20: Impact of prolonged DEP manipulation on the vitality, activation- and proliferation states of Jurkat cells. Single T cells were brought into the microchip and DEP-sorted to the exit of the channel (0 min., n = 18), where they were extracted from the microfluidic system and deposited into an antibody-coated microwell. Where indicated, the sorting procedure within the chip was interrupted by an incubation step at the zigzag electrode under no field exposure or field exposure condition for durations of 20 min. (n = 7) or 60 min. (n ≥ 6). The isolated cells were incubated over night before their vitality, activation- and proliferation states were analyzed.
Influence of the electric field on the cytosolic Ca2+ level When cells are brought into external electric fields, physiological parameters like vitality, proliferation and activation state can be impaired, depending on the exposure time (see previous section). Ca2+ imaging experiments with DEP-manipulated cells reveal if these fields also act on the level of the cytosolic Ca2+concentration. Negligible Ca2+ spiking was observed in cells that had not been exposed to electric fields after introduction into the microchannel (0 kV m-1; 0 µl h-1, Fig. 5-21 A). Cells retained at the zigzag electrode against the fluid flow showed spontaneous Ca2+ spikes as shown in Fig. 5-21 B, albeit these spikes were clearly different from the signal elicited by contact formation with an antibodycoated microbead (Fig. 5-21). In order to investigate the nature of these spontaneous Ca2+ spikes further, the cytosolic Ca2+ level of Fura-loaded Jurkat T cells was monitored while they were exposed to electric fields of different strengths, frequencies and for different exposure times. For that, the cells were directed to a zigzag electrode and held dielectrophoretically against the fluid flow at high-field mode or low-field mode (100 kV m-1; 14.4 µl h-1 and 40 kV m-1; 0.7 µl h-1, respectively, see Tab. 4-4) for 5 min. Alternatively, cells that had not been exposed to electric fields (0 V; 0 µl h-1) were examined. At the same time, their cytosolic Ca2+ concentration was monitored. Spiking of the cells was quantified by calculating the statistical variance of the recorded Ca2+ traces (see section 4.5.5). As shown in Fig. 5-21 D, the mean variance of the analyzed Ca2+
66
5.4 Impact of the chip manipulation procedure on the cell physiology
¯¯¯¯¯¯¯¯¯¯¯¯¯¯¯¯¯¯¯¯¯¯¯¯¯¯¯¯¯¯¯¯¯¯¯¯¯¯¯¯¯¯¯¯¯¯¯¯¯¯¯¯¯¯¯¯¯¯¯¯¯¯¯¯¯¯¯¯¯¯¯¯¯ traces strongly depended on the applied electric field strength. Without any electric field exposure, the cells showed only little spiking, indicated by a mean variance of 12 nM2 ± 3 nM2 (n = 20). In contrast, manipulation at low- and high-field mode led to values of 110 nM2 ± 70 nM2 (n = 14) and 500 nM2 ± 100 nM2 (n = 15), respectively. Next, the influence of the exposure time on the cytosolic Ca2+ level was tested. In order to mimic the manipulation procedure during bead stimulation (see section 4.6.3), the cells were directed to a zigzag electrode and held under the high-field mode against the fluid flow. After 15, 30, or 60 s, the configuration was changed from high-field mode to low-field mode for the rest of the trial period. Alternatively, cells were held at the zigzag electrode over the complete trial period at low-field mode (Fig. 5-21 E, 0 s) or at high-field mode (Fig. 5-21 E, 300 s), respectively. Analysis of the obtained Ca2+ traces revealed mean variances of 50 ± 40 nM2, 200 ± 100 nM2, 80 ± 50 nM2 and 600 ± 200 nM2 for 0 s, 15 s, 30 s and 60 s exposure times at high-field condition, respectively (Fig. 5-21 E, n ≥ 15). Prolonged exposure to high electric fields had no additional effect on irregular spiking (500 ± 130 nM2, n = 15, Fig. 5-21 E, 300 s).
Fig. 5-21: Influence of the DEP manipulation on the cytosolic Ca2+ level of Jurkat T cells. Furaloaded T lymphocytes were held at the zigzag electrode for 5 min. at different parameter conditions for fluid flow and electric field strength (see text for details) while their intracellular Ca2+ concentration was monitored. For quantitative analysis, the variance of each Ca2+ trace was calculated and averaged over all cells at a particular condition. (A) Exemplary brightfield image and corresponding Ca2+ trace of a cell that was not, or (B) was exposed to electric fields. The distance d to the electrode is an important parameter for estimating the electric field strength experienced by the cell. d varies with the fluid flow and the applied electrode voltage. (C) Image of a bead-contacted T cell and typical Ca2+ trace due to bead-stimulation. Scale bar, 10 µm. (D - F) Quantification of Ca2+ spiking in cells that were exposed to electric fields at different strengths (D), for different exposure times (E) and at different frequencies (F) (see text for details). Error bars, s.e.m.; n ≥ 14. (G) Square deviations of the mean Ca2+ signal averaged over all cells that were exposed to high electric fields for 60 s (see E, 60 s). Cells were exposed to high electric fields only during the first minute of the experiment. After that, the field strength was switched to a lower value. Note that variations in the Ca2+ signals mainly occurred after exposure of the cells to high electric fields was over.
67
5 Results
¯¯¯¯¯¯¯¯¯¯¯¯¯¯¯¯¯¯¯¯¯¯¯¯¯¯¯¯¯¯¯¯¯¯¯¯¯¯¯¯¯¯¯¯¯¯¯¯¯¯¯¯¯¯¯¯¯¯¯¯¯¯¯¯¯¯¯¯¯¯¯¯¯ Electric fields affect cells in two ways: (i) due to ohmic warming they induce thermal stress and (ii) they alter the cellular membrane potential as a function of the inverse of the field frequency. To clarify which of these two aspects is responsible for the irregular Ca2+ spiking, the cells were manipulated at different field frequencies (1, 3 and 5 MHz). The manipulation procedure was similar to the one used to expose the cells to high electric fields for 60 s – the cells were directed to a zigzag electrode and held at high-field mode against the fluid flow. After 60 s, the parameters were changed from high-field to low-field mode for the rest of the trial period. Fig. 5-21 F clearly shows a strong frequency dependence of the Ca2+ spiking. The mean variance of the Ca2+ traces decreased from 600 ± 200 nM2 (1 MHz, n = 26) to 170 ± 80 nM2 (3 MHz, n = 19) and 130 ± 40 nM2 (5 MHz, n = 20). Interestingly, spiking of the cells does not occur simultaneously with the exposure to the high electric fields. Fig. 5-21 G shows the square deviation from the mean Ca2+ level at different time points, averaged over all tested cells of the 60 s condition in Fig. 5-21 E. Spiking of the cells mainly occurred after the high field had already been switched off again.
5.4.2 Microfluidic environment Besides the electric fields applied for DEP manipulation, another important factor that possibly affects the physiology of the chip-manipulated cells is the microfluidic environment. The low vitality rates of cells that had been subjected to the on-chip activation protocol (see section 5.2.4) suggest that the environmental conditions in the microchannels have to be considered when cells are to be incubated in the DEP-Chips over prolonged times. In the following experiments, the basic conditions for a successful cultivation of the cells within the chips were examined in more detail. Cultivation of Jurkat T cells in different DEP chips To test, if Jurkat T cells can be cultivated in the DEP chips, 4 × 10⁵ cells ml-1 were introduced into different lots of DEP chips or into a PDMS-based microchannel (MicCell). The fluidic system was sealed and the chips were transferred to an incubator over night. After this, the vitality of the cells was analyzed by brightfield microscopy. The results are shown in Fig. 5-22. Cultivating the cells in the MicCell led to a mean survival rate of 50% ± 20% (n = 5). After their cultivation in different DEP chips, the cells showed survival rates of either roughly 50% (DEP 4, 40% ± 20%, n = 3; DEP 1, 50% ± 30%, n = 3; DEP 2, 59% ± 7%, n = 5) or less than 10% (DEP 3, 7% ± 3%, n = 3; DEP 5, 2% ± 2%, n = 3; DEP 6, 0.7% ± 0.7%, n = 3). Apparently, the survival rate strongly depended on the DEP chip used for cultivation. This strongly suggests that intrinsic properties of the individual chips were responsible for the varying vitality of the cultivated cells.
Fig. 5-22: Cultivation of Jurkat T cells in different DEP chips. 4 × 10⁵ cells ml-1 were cultivated over night in six different DEP chips or in a PDMS-based microchannel (MicCell). After this, the vitality of the cells was analyzed by brightfield microscopy. Error bars, s.e.m.; n ≥ 3. 68
5.4 Impact of the chip manipulation procedure on the cell physiology
¯¯¯¯¯¯¯¯¯¯¯¯¯¯¯¯¯¯¯¯¯¯¯¯¯¯¯¯¯¯¯¯¯¯¯¯¯¯¯¯¯¯¯¯¯¯¯¯¯¯¯¯¯¯¯¯¯¯¯¯¯¯¯¯¯¯¯¯¯¯¯¯¯ Extensive washing as possible strategy to render the DEP chips biocompatible The observed differences in the biocompatibility of individual chips could be due to variability of the manufacturing process. Possibly, residues of cytotoxic chemicals could have been left within some chips, while others were sufficiently free of them. It was tested, if cleaning the chips by extensive washing can help to render them biocompatible. For that, the microchannel of a chip that had been shown before to be cytotoxic (DEP 3, see Fig. 5-22) was flushed with 2.6 l distilled water containing detergent (0.5% Tween 20) at a flow rate of 27 ml h-1. After this, the fluid was changed to pure distilled water (3.6 l at the same flow rate) to completely wash out the used detergent from the chip. Before and after this, Jurkat T cells were cultivated in the chip as described before. The subsequent analysis of the survival rate revealed no difference between the biocompatibility of the chip before (7%, ± 3%, n = 3) and after the washing step (7%, ± 2%, n = 4). Outgassing as possible strategy to render the DEP chips biocompatible Another method to remove possible cytotoxic chemicals from a microsystem is evaporation. As this effect depends on the temperature and the ambient pressure, a DEP chip that had previously been shown to be cytotoxic (DEP 5, see Fig. 5-22) was incubated for six days in a vacuum drying oven at 60 °C and 10 - 20 mbar. Before and after the vacuum treatment, L929 fibroblasts were cultivated in the chip over night and analyzed for their vitality in the microscope after this. Alternatively, a biocompatible chip (DEP 4, see Fig. 5-22) was used as a control for L929 cultivation. Fig. 5-23 A-C show brightfield images of fibroblasts cultivated in the chip (A) before and (B) after its treatment in the vacuum oven or (C) in the control chip. While most of the cells in the control chip were spread and attached to the surface, incubation in DEP 5 caused cell rounding and detachment, whether it had been treated in the vacuum oven or not. The vitality rates of the cells are shown in Fig. 5-23 D. While 50% ± 10% (n = 6) of all cells in the control chip were vital after over night incubation, the survival rates of DEP 5 were 0.8% (n = 1) and 0% (n = 1) before and after the vacuum treatment, respectively.
Fig. 5-23: Cultivation of L929 cells in DEP chips before and after outgassing. It was tested, if the treatment of the DEP chips in a vacuum oven for six days at 60 °C and 10 - 20 mbar can render them biocompatible. For that, L929 cells were cultivated over night in the (cytotoxic) DEP 5 chip (see Fig. 5-22) before (n = 1) and after (n = 1) treatment of the chip in a vacuum drying oven. Alternatively, the cells were cultivated in the DEP 4 chip (n = 6), the biocompatibility of which had been proven before (see Fig. 5-22). The vitality of the cells was analyzed the following day. (A) Incubating the cells in DEP 5 made most cells round and detach from the ground, which indicated cell damage. (B) L929 cultivated in the same chip after its treatment in the vacuum oven. After over night incubation in the chip the cells showed the same morphology like those in (A). (C) In contrast, cells that had been cultivated in the control chip were spread and attached to the surface, which is an indicator for healthy cells. Scale bar, 200 µm. (D) Quantification of the survival rates. Error bar, s.e.m. 69
5 Results
¯¯¯¯¯¯¯¯¯¯¯¯¯¯¯¯¯¯¯¯¯¯¯¯¯¯¯¯¯¯¯¯¯¯¯¯¯¯¯¯¯¯¯¯¯¯¯¯¯¯¯¯¯¯¯¯¯¯¯¯¯¯¯¯¯¯¯¯¯¯¯¯¯ Cultivation of Jurkat T cells under suppressed gas exchange The used microchannels are made from glass, which suppresses gas exchange between the chips and the environment. Because mammalian cells are aerobic organisms, they consume the dissolved oxygen in the culture medium during their cultivation. In hermetic microchannels, this could lead to an undersupply of oxygen and, thus, cause cell damage. Estimating this effect theoretically was difficult because controversial values for the oxygen consumption of living T cells are reported in literature. Instead, it was evaluated experimentally. In this context, 4 × 10⁵ ml-1 T cells were cultivated over night in capillaries (diameter, ca. 0.5 mm) which were hermetically sealed or left open (control) after the cells had been introduced. Before this, the cell culture medium used was either aerated in the incubator or degassed by heating or ultrasonic treatment. The vitality of the cells was analyzed the following day. As shown in Fig. 5-24, cultivation in medium degassed by either heating or ultrasonic treatment did not reduce the vitality (99% in both cases) compared to cultivation in aerated medium (94%) or in unsealed capillaries (control, 90%).
Fig. 5-24: Cultivation of Jurkat T cells in degassed medium. 4 × 10⁵ ml-1 T cells were cultivated over night in hermetically sealed capillaries to prevent environmental gas exchange. Before this, the culture medium used had been degassed by heating or ultrasonic treatment or had been aerated in the incubator. Alternatively, cultivating the cells was performed in unsealed capillaries (control). The vitality of the cells was evaluated the following day by brightfield microscopy (n = 1).
5.5
Stability of the bead coating
Achieving a high control over the stimulus presentation by bead-coated antibodies requires the IgG molecules to be immobilized on the beads and to not desorb during the experimental procedure. However, coupling them covalently to the bead surface resulted in erratic activation potentials of the beads which made them useless for the efficient stimulation of single cells in the chip (data not shown). Thus, the antibodies were coupled non-covalently to protein A beads which made the stability of the coating accord to the law of mass action. An important question arising from this fact is to which extent the bead-coupled antibodies desorb during the T cell activation experiments described in section 5.2 and 5.3, and if the desorbed antibodies induce physiological reactions that interfere with those elicited by the applied bead stimulus. First, it was experimentally tested, if antibodies desorb from the beads and elicit physiological reactions like T cell activation or cytosolic Ca2+ transients. These reactions were contrasted to those
70
5.5 Stability of the bead coating
¯¯¯¯¯¯¯¯¯¯¯¯¯¯¯¯¯¯¯¯¯¯¯¯¯¯¯¯¯¯¯¯¯¯¯¯¯¯¯¯¯¯¯¯¯¯¯¯¯¯¯¯¯¯¯¯¯¯¯¯¯¯¯¯¯¯¯¯¯¯¯¯¯ that were elicited when T cells were exposed to defined concentrations of soluble anti-CD3 and anti-CD28. After that, the antibody desorption from the beads was quantified theoretically, which necessitated information about both the binding properties of the protein A-antibody interaction as well as the coating efficiency of the beads.
5.5.1 Influence of desorbing antibodies on the physiology of Jurkat T cells Influence on the cytosolic Ca2+ level First, it was tested how the cytosolic Ca2+ level in beadstimulated single cells (see section 5.3.3) was affected by antibody dissociation from the presented microbeads. For that, Fura-loaded T cells were directed to the zigzag element z2 (see Fig. 5-14 B) where they were retained for 5 min. against the fluid flow. At the same time, an antibody-coated bead or an uncoated bead (type A, see material section) was held upstream in zigzag element z1. Fig. 5-25 A and B show 8 Ca2+ traces of each case. The Ca2+ signals of cells that were held downstream of an antibody-coated microbead showed strong spiking. It was considerably higher than in the control group with an uncoated bead held upstream of the cells. To quantify the Ca2+ spiking, the mean variance of the traces was estimated (Fig. 5-25 C). It was 400 ± 100 nM2 (n = 46) in cells that were held downstream of a coated bead and 80 ± 60 nM2 in cells of the control group (n = 8).
Fig. 5-25: Cytosolic Ca2+ transients induced by antibodies that have desorbed from functionalized microbeads. (A) Single Fura-loaded T cells were held for 5 min. against the fluid flow in the zigzag electrode z2 while at the same time an antibody-coated microbead was held upstream in z1. The cytosolic Ca2+ level was analyzed simultaneously. Exemplary Ca2+ traces of 15 cells are shown. (B) In the control group, the cells were subjected to the same experimental procedure with an uncoated bead having been held in zigzag electrode z1. (C) Quantification of the Ca2+ spiking by estimating the mean variance of the Ca2+ traces. Scale bar, s.e.m.
Influence on the activation state of the T cells For evaluating, if desorbed antibodies interfere with the activating signal transmitted by the functionalized beads, antibody-coated beads were incubated in culture medium over night prior to separately adding beads and supernatant to Jurkat T cells. After 16 - 24 h, the rate of activated T cells was analyzed. Besides activation with the incubated beads, the cells were mixed with freshly prepared beads or left unstimulated. For the experiments, beads of two different manufacturers (G.Kisker, Germany, Type A; Micromod, Germany, Type B) were used. Fig. 5-26 shows the resulting activation rates. Freshly prepared functionalized beads of both manufacturers had a strong potential to activate T cells (100%, n = 1 and 95 % ± 3%, n = 2 for 71
5 Results
¯¯¯¯¯¯¯¯¯¯¯¯¯¯¯¯¯¯¯¯¯¯¯¯¯¯¯¯¯¯¯¯¯¯¯¯¯¯¯¯¯¯¯¯¯¯¯¯¯¯¯¯¯¯¯¯¯¯¯¯¯¯¯¯¯¯¯¯¯¯¯¯¯ Beads A and B, respectively), even after their incubation in culture medium over night (94% and 91.2% ± 0.1%). However, antibody dissociation was different between the two bead types. While the supernatant of beads A activated 51% ± 2% (n = 2) of all vital cells, the activation rate of supernatant B was only 4% ± 3% (n = 3). In contrast, the spontaneous activation rate was 0.5% ± 0.5% (n = 2) in cells without beads.
Fig. 5-26: T cell activation induced by antibodies desorbed from functionalized microbeads. AntiCD3/anti-CD28-coated microbeads of two different suppliers A and B (see materials section) were freshly prepared or had been incubated for one day in cell culture medium. The beads and the cell culture supernatant were separately added to Jurkat T cells. Alternatively, the cells remained unstimulated. After over night incubation of the cell suspensions, the T cell activation rates were analyzed the next day. Scale bars, s.e.m.
5.5.2 Sensitivity of Jurkat T cells to low concentrations of soluble antibodies To get an impression of the particular antibody concentration the cells were exposed to in the experiments described in the previous section, the response behavior of Jurkat T cells exposed to low concentrations of soluble anti-CD3 and anti-CD28 was investigated. For that, Fura-loaded T cells were mixed with cell culture medium containing anti-CD3 and anti-CD28 at different concentrations or cell culture medium without antibodies (control group). While the elicited calcium signals were analyzed ca. 10 min. after exposure of the cells to the antibody solutions, the activation state of the cells was evaluated after an additional incubation step in the antibodycontaining solutions over night. Fig. 5-27 A shows the calcium traces of 15 cells for each case. While a strong reaction was detected in cells that were incubated in 10 nM, the signals got weaker with decreasing amount of IgG. The lowest reactions were detected with antibody concentrations of 1 pM while no response was observed with 100 fM or less. The calcium traces were quantified by calculating their variances and averaging them over of all cells of one condition (see section 4.5.5). The results are shown in Fig. 5-27 B. While the variance was below 5 nM2 for the control group and for antibody concentrations of up to 100 fM, it increased with higher IgG concentrations to 100 nM2 ± 60 nM2 at 1 pM, 500 nM2 ± 200 nM2 at 10 pM and 1800 nM2 ± 700 nM2 at 10 nM.
72
5.5 Stability of the bead coating
¯¯¯¯¯¯¯¯¯¯¯¯¯¯¯¯¯¯¯¯¯¯¯¯¯¯¯¯¯¯¯¯¯¯¯¯¯¯¯¯¯¯¯¯¯¯¯¯¯¯¯¯¯¯¯¯¯¯¯¯¯¯¯¯¯¯¯¯¯¯¯¯¯
Fig. 5-27: T cell response behavior after exposition to low concentrations of anti-CD3/anti-CD28. (A) Fura-loaded T cells were incubated in cell culture medium containing different concentrations of the antibodies or pure culture medium (control). In each case, the [Ca2+]i of 15 cells was monitored over a period of 5 min. (B) Quantification of the Ca2+ signals in (A). The mean statistical variance of all traces of one condition was calculated as described in the methods section. Error bars, s.e.m. (C) T cell activation rates after over night incubation of the cells in culture medium containing antiCD3/anti-CD28 at different concentrations or without antibodies (control).
Additionally, the cells were analyzed for their activation state the following day (n = 1 for each antibody concentration). As shown in Fig. 5-27 C, the activation rate of unstimulated cells was 3.4% (Control). While antibody concentrations of up to 1 pM did not induce a higher activation rate than this, the lowest concentration tested that induced more T cell activation than pure cell culture medium was 10 pM (9.4%). Higher concentrations induced higher activation rates (100 pM, 55.7%; 10 nM, 64.7%). A Gauss error function was fitted to the data.
5.5.3 Theoretical quantification of the antibody desorption from the beads Evaluation of the binding constant for the protein A - antibody interaction The kinetics for both the anti-CD3 (mouse IgG1) and the anti-CD28 (mouse IgG2a) association to (and dissociation from) protein A were measured by SPR technology. In this context, a protein A-coated surface was exposed to antibody solutions of different concentrations followed by incubation in control buffer without IgG. Simultaneously, the covering of the surface with the IgG molecules was analyzed. The results are shown in Fig. 5-28. During the exposure step with the antibody solutions, the coating of the surface with IgG increased monotonously until the medium containing IgG was changed to control buffer. From that time point, the amount of surface-coupled antibodies decreased again. Anti-CD3 (Fig. 5-28 A) covered the chip much slower than anti-CD28 (Fig. 5-28 B) at similar antibody concentrations. The rate of the antibody coating increased with the used IgG-concentration in the medium. From the course of the IgG covering at different antibody solutions, the association- and dissociation rate constants for the protein A - antibody interaction were calculated by fitting a Langmuir model (1:1) to the data (see methods section). Note, that in the case of anti-CD28 only the traces for IgG concentrations of 14.2 nM and lower were included 73
5 Results
¯¯¯¯¯¯¯¯¯¯¯¯¯¯¯¯¯¯¯¯¯¯¯¯¯¯¯¯¯¯¯¯¯¯¯¯¯¯¯¯¯¯¯¯¯¯¯¯¯¯¯¯¯¯¯¯¯¯¯¯¯¯¯¯¯¯¯¯¯¯¯¯¯ for the fit. The results are shown in Tab. 5-2. While the tested anti-CD3 (mouse IgG1) had a comparatively low affinity to protein A (KD = 4.3 × 10⁻⁸ M), the KD of anti-CD28 (mouse IgG2a) was much smaller (KD = 1.9 × 10⁻⁹ M). Interestingly, the different affinities of both antibodies to protein A were mainly due to their different association rate constants (ka = 8.2 × 10³ and 2.8 × 10⁵ M-1 s-1 for anti-CD3 and anti-CD28, respectively), while their dissociation constants (kd = 3.5 × 10⁻⁴ and 5.3 × 10⁻⁴ s-1) were in the same range.
Fig. 5-28: Binding kinetics of the protein A - IgG interaction. Protein A-coated slides were exposed to antibody solutions of different concentrations while the antibody binding of the surface was analyzed (response units, a.u.). After 240 s, the antibody solution was replaced by buffer without IgG. (A) Binding kinetics of the anti-CD3 antibody (mouse IgG1). (B) Binding kinetics of the antiCD28 antibody (mouse IgG2a).
Tab. 5-2: Thermodynamic characteristics for the interaction between anti-CD3 (mouse IgG1) and anti-CD28 (mouse IgG2a) with protein A. The values were obtained from the experimental data shown in Fig. 5-28. Note, that for evaluating the binding characteristics of anti-CD28 only the traces for IgG concentrations of 14.2 nM and below were used. This enhanced the quality of the fit. Moreover, the antibody concentrations used for coating the beads were usually in that range. Rmax represents the maximum coverage at saturation (in response units) while the Chi2-value is the mean of the square of the difference between the fit and the original curve, i.e., it indicates how close the fit is (as a rule of thumb, the value for Chi2 should be lower than 10% of that for Rmax).
Anti-CD3 Anti-CD28
ka / M-1 s-1
kd / s-1
KD / M
KA / M-1
Rmax
Chi2
8.2 × 10³
3.5 × 10⁻⁴
4.3 × 10⁻⁸
2.3 × 10⁷
136
1.74
5
-4
-9
8
233
1.56
2.8 × 10
5.3 × 10
1.9 × 10
5.3 × 10
Estimation of the coating efficiency of the beads Antibody-coated beads were produced by -1 incubating them in 2 µg ml anti-CD3 and anti-CD28 (13.5 nM in each case, see methods section). The efficiency of the antibody coupling to the protein A beads can be derived from the Langmuir 1:1 binding model (see methods section). It is a very simple and widely used model in which the antibodies reversibly bind to the protein A beads with the association and dissociation rate constants obtained in Tab. 5-2 and according to the law of mass action. The competitive adsorption of the two antibodies to the protein A-coated bead surface can be expressed by two binding reactions using the following symbols: CD3 = anti-CD3, CD28 = anti-CD28, PA = IgG binding site on the protein A bead, CD3PA = anti-CD3-protein A complex, CD28PA = anti-CD28-protein A complex, and ka3, kd3, ka28 and kd28 = association and dissociation rate constants of anti-CD3 and anti-CD28, respectively. 74
5.5 Stability of the bead coating
¯¯¯¯¯¯¯¯¯¯¯¯¯¯¯¯¯¯¯¯¯¯¯¯¯¯¯¯¯¯¯¯¯¯¯¯¯¯¯¯¯¯¯¯¯¯¯¯¯¯¯¯¯¯¯¯¯¯¯¯¯¯¯¯¯¯¯¯¯¯¯¯¯ ka3
CD3 + PA ⇌ CD3PA kd3
ka28
CD28 + PA ⇌ CD28PA kd28
To simplify the equations, the concentrations of free (unbound) antibodies in the assay were set to constants equal to their respective initial concentrations. The binding reactions and the conservation of mass lead to the following equations: d[CD3]/dt = [CD3][PA] ka3 -[CD3PA] kd3 d[CD28]/dt = [CD28][PA] ka28 -[CD28PA] kd28 [PA] = N - [CD3PA] - [CD28PA] with [PA] = the concentration of free IgG binding sites and N = the total concentration of IgG binding sites in the assay. At equilibrium, d[CD3]/dt = d[CD28]/dt = 0 which leads to [CD3PA] = [CD3][PA] ka3 kd3-1 and [CD28PA] = [CD28][PA] ka28 kd28-1. Thus, [PA] = N - [CD3][PA] ka3 kd3-1 - [CD28][PA] ka28 kd28-1 or [PA] = N (1+ [CD3] ka3 kd3-1 + [CD28] ka28 kd28-1)-1. With 5.0 × 10⁻¹⁸ mol IgG binding sites per bead (personal communication with Ms. Grüttner, Micromod, Germany and Mr. Kisker, G. Kisker, Germany) and 8.0 × 10⁵ beads ml-1, N was 4.0 × 10⁻⁹ M. ka3, kd3, ka28 and kd28 were obtained from Tab. 5-2. Hence, [PA] = 4.7 × 10⁻¹⁰ M from which [CD3PA] and [CD28PA] were calculated as 1.5 × 10⁻¹⁰ and 3.4 × 10⁻⁹ M, respectively. Thus, 11.8% of the IgG binding sites were unoccupied, while 3.7% and 84.4% were coupled to anti-CD3 and anti-CD28 molecules, respectively. The number of IgG molecules per bead was 1.1 × 10⁵ and 2.6 × 10⁶ for anti-CD3 and anti-CD28, respectively. Antibody desorption from functionalized beads when incubated in culture medium The evaluation of the antibody density on the bead surface described above allowed estimating the amount of antibody desorption from the functionalized microbeads when they are incubated in a well with fresh culture medium (analogous to the experiments described in section 5.5.1). For that, a system of equations was set up, based on the same principles as for estimating the bead coating efficiency. Since (i) the initial antibody concentration in the culture medium = 0 and (ii) initially, all antibodies in the assay were coupled to the beads, the conservation of mass required the amount of bead-coupled antibodies at the equilibrium ([CD3PA]eq, [CD28PA]eq) to equal the sum of the initially bound ([CD3PA]ini, [CD28PA]ini) and the desorbed IgG molecules ([CD3]eq, [CD28]eq). I
[CD3PA]eq = [CD3PA]ini − [CD3]eq
II
[CD 28PA]eq = [CD 28PA]ini − [CD 28]eq 75
5 Results
¯¯¯¯¯¯¯¯¯¯¯¯¯¯¯¯¯¯¯¯¯¯¯¯¯¯¯¯¯¯¯¯¯¯¯¯¯¯¯¯¯¯¯¯¯¯¯¯¯¯¯¯¯¯¯¯¯¯¯¯¯¯¯¯¯¯¯¯¯¯¯¯¯ In the same way, the number of free binding sites at equilibrium ([PA]eq) was expressed by the sum of the initially free binding sites ([PA]ini) plus the amount of the desorbed antibodies. III
[ PA]eq = [ PA]ini + [CD3]eq + [CD 28]eq
According to the law of mass action, the ratio between occupied and free IgG binding sites at the equilibrium was described by IV
V
[CD3PA]eq [ PA]eq
= [CD3]eq ⋅ K A3
[CD 28 PA]eq [ PA]eq
= [CD 28]eq ⋅ K A28
with the association constants KA3 and KA28 for anti-CD3 and anti-CD28, respectively. I / IV - III and II / V - III led to Ia
[CD 28]eq =
IIa
[CD 28]eq =
[CD3PA]ini − [CD3]eq [CD3]eq ⋅ K A3
− [ PA]ini − [CD3]eq
[CD 28PA]ini − [CD 28]eq [CD 28]eq ⋅ K A28
− [ PA]ini − [CD3]eq
Transformation of IIa and the use of the new variable
ku =
[CD3PA]ini − [CD3]eq [CD3]eq ⋅ K A3
led to Ib
[CD 28]eq = k u − [ PA]ini − [CD3]eq
IIb
[ PA]ini + [CD3]eq + [CD 28]eq −
[CD 28PA]ini − [CD 28]eq [CD 28]eq ⋅ K A28
=0
and after introduction of Ib into IIb to
[ PA]ini + [CD3]eq + k u − [ PA]ini − [CD3]eq −
[CD 28 PA]ini − k u + [ PA]ini + [CD3]eq
(k
u
− [ PA]ini − [CD3]eq ) ⋅ K A28
which was only dependent on a single variable, [CD3]eq, and was further transformed to
ku −
76
[CD 28PA]ini − k u + [ PA]ini + [CD3] eq k u ⋅ K A28 − [ PA]ini ⋅ K A28 − [CD3] eq ⋅ K A28
= 0.
=0
5.5 Stability of the bead coating
¯¯¯¯¯¯¯¯¯¯¯¯¯¯¯¯¯¯¯¯¯¯¯¯¯¯¯¯¯¯¯¯¯¯¯¯¯¯¯¯¯¯¯¯¯¯¯¯¯¯¯¯¯¯¯¯¯¯¯¯¯¯¯¯¯¯¯¯¯¯¯¯¯ As a derivate of equation IIb (which, in turn, is a derivate of equation III), this describes the conservation of mass as a function of [CD3]eq. The left term of the equation was called f(x) with x = [CD3]eq. It was solved graphically for f(x) = 0 (Fig. 5-29 A) with KA3 = 2.3 × 10⁷ M-1, KA28 = 5.3 × 10⁸ M-1 (see Tab. 5-2), [PA]ini = 2.9 × 10⁻¹⁰ M, [CD3PA]ini = 9.1 × 10⁻¹¹ M and [CD28PA]ini = 2.1 × 10⁻⁹ M. The initial amount of bead-associated IgG molecules in the assay ([CD3PA]ini and [CD28PA]ini ) was calculated from the amount of antibodies coupled to a single bead (see above) and a bead concentration in the assay of 4.9 × 10⁵ ml-1 (see section 4.4.3). Additionally, the corresponding anti-CD28 concentration was calculated from eq. Ia (blue graph, Fig. 5-29 A). The function has two nulls (see Fig. 5-29 A), one of which corresponds to a negative anti-CD28 concentration and, thus, is of no relevance. The second null is at [CD3]eq ≈ 88 pM with a corresponding [CD28]eq of ca. 1.1 nM (arrows, Fig. 5-29 A).
Fig. 5-29: Quantification of the IgG dissociation from antibody-coated microbeads. (A) The concentration of IgG molecules desorbed from antibody-coated microbeads that have been mixed with cell culture medium was calculated at the equilibrium, according to the binding kinetics obtained for anti-CD3 and anti-CD28. The conservation of mass required the amount of antibodies initially coupled to the beads to equal the sum of the dissociated and bead-coupled antibodies at equilibrium. f(x) is derived from the Langmuir binding model 1:1 and describes the deviation to this model as a function of the free anti-CD3 concentration in the medium. The corresponding anti-CD28 concentration is shown by the blue curve. Both, the amount of anti-CD3 and that of anti-CD28 in the medium were estimated from the graph at f(x) = 0 (arrows). See text for details. (B) Antibody concentration experienced by a cell that is held downstream of an antibody-coated microbead in the DEP chip. The fluid flow (white arrows) transports desorbed antibodies from the bead towards the cell. On their way, the IgG molecules diffuse perpendicular to the flow direction which makes their concentration profile across the microchannel (red lines) spread according to a gauss curve of width σ = (2Dtdiff)0.5 (with D = IgG diffusion constant and tdiff = diffusion time). At the position of the cell, tdiff = d v-1 with v = flow velocity and d = distance between the bead and the cell. See text for details.
Taken all together, the over night incubation of antibody-coated beads in fresh culture medium made the IgG concentration of the supernatant level off at 88 pM (anti-CD3) and 1.1 nM (antiCD28). Thus, 88 pM : 91 pM = 97% of the initially coupled anti-CD3 and 1.1 nM : 2.1 nM = 52% of the initially coupled anti-CD28 had been dissociated from the beads at equilibrium. Antibody desorption from functionalized beads when flowed with culture medium To estimate the antibody concentration a cell experienced when dielectrophoretically held downstream of an antibody-coated microbead against the fluid flow, the dimensions of the microchannel as well as the fluidic parameters have to be considered. A scheme of the experimental setup used for investigating the influence of desorbing antibodies on the cytosolic Ca2+ concentration (see section 5.5.1) is depicted in Fig. 5-29 B. The cell and the bead were retained at the consecutively 77
5 Results
¯¯¯¯¯¯¯¯¯¯¯¯¯¯¯¯¯¯¯¯¯¯¯¯¯¯¯¯¯¯¯¯¯¯¯¯¯¯¯¯¯¯¯¯¯¯¯¯¯¯¯¯¯¯¯¯¯¯¯¯¯¯¯¯¯¯¯¯¯¯¯¯¯ arranged zigzag elements z1 and z2 against the fluid flow (v = 4.4 µm s-1), indicated by the white arrows. The distance d between the bead and the cell was ca. 140 µm. Flushing the bead with fresh cell culture medium caused immobilized antibodies to detach from the bead surface according to their dissociation constants kd3 and kd28 (3.5 × 10⁻⁴ s-1 and 5.3 × 10⁻⁴ s-1, respectively). The number of desorbed antibodies during the whole experimental procedure (IgGs) was described by
IgGs = IgGini − IgGini (1 − k d ) exp t
(5.1)
with the number of antibodies initially coupled to beads IgGini = 1.1 × 10⁵ for anti-CD3 and IgGini = 2.6 × 10⁶ for anti-CD28 (see section 5.5.3) and the duration of the experimental procedure texp = 600 s. The fluid flow continuously transported the desorbed antibodies towards zigzag element z2 with the cell stored there. On their way, the antibodies diffused perpendicular to the fluid flow which made the profile of the normalized IgG concentration across the microchannel c(x, td) (indicated by the red curves in Fig. 5-29 B) broaden according to the fundamental solution of Fick’s second law:
c ( x, t d ) =
1 4πDt d
e
−
x2 4 Dt d
(5.2)
with the diffusion constant for IgG molecules D = 4 × 10-11 m2 s-1, the diffusion time td and the lateral displacement x. The quotient of the distance d and the fluid flow v defined the diffusion time which was td = 31.5 s for d = 140 µm. The number of antibodies IgGc present in the vicinity of the cell (with radius r = 5 µm) was calculated from r
IgGc = IgGs ⋅ ∫ c( x, t140 ) ⋅ dx
(5.3)
−r
Finally, the mean antibody concentration the cell was exposed to was estimated by dividing IgGc by the volume V the cell was flushed with during the whole experimental procedure. V was calculated from
V = 2rht exp v
(5.4)
with r = 5 µm, h = the channel height (30 µm), texp = 600 s and v = 4.4 µm s-1. As a result, IgGc experienced by the cell was estimated to be approximately 3.5 pM for anti-CD3 and 110 pM for anti-CD28.
78
5.6 Further applications
¯¯¯¯¯¯¯¯¯¯¯¯¯¯¯¯¯¯¯¯¯¯¯¯¯¯¯¯¯¯¯¯¯¯¯¯¯¯¯¯¯¯¯¯¯¯¯¯¯¯¯¯¯¯¯¯¯¯¯¯¯¯¯¯¯¯¯¯¯¯¯¯¯
5.6
Further applications
5.6.1 Activation of primary T cells with APCs The protocol for the activation of single Jurkat T cells with antibody-coated microbeads established in section 5.2.2 was transferred to a more physiologically relevant cell system. In this context, the same manipulation procedure as for contacting Jurkat T cells and beads was used for pairing primary OT-I T cells with APCs of the FSDC cell line loaded with OVA257-264 peptide. To ensure the integrity of the FSDC surface proteins the cells were detached from their culture dish nonenzymatically before they were transferred to the DEP chip. The simultaneous DEP manipulation of both cell types was possible. This allowed clustering them at arbitrary numerical ratios (see Fig. 5-30). Unfortunately, the formed clusters were unstable and dissociated before they could be extracted from the microfluidic system. Thus, T cell activation on a single-cell level could not be induced in OT-I cells.
Fig. 5-30: Clusters of primary T cells and APCs at the zigzag electrode. For contacting OT-I T cells (arrowheads) with loaded FSDC cells (arrows) at different numerical ratios, the same pair formation procedure as for Jurkat T cells and microbeads was used. Scale bar, 20 µm.
5.6.2 Contact formation between stem cells and somatic cells The previous sections have shown that the DEP chips can be used to induce cellular interactions on a single-cell level. Beyond that, contacting single cells with each other could also be used to create a specific microenvironment for e.g. stem cells. Since the differentiation of these cells is assumed to be mediated by cellular interactions in the stem cell niche, the clustering of stem cells with other somatic cell types could mimic the environmental conditions in their niche and, thus, could help to control differentiation processes in these cells. To point out the potential of the DEP chips for this task, adult stem cells from a GFP expressing mouse (pancreatic stellate-like cells, PSLC) and FSDC cells were clustered together with cells from the neuroendocrine cell line Neuro-2a. For that, the cells were introduced into the microchannel through three separate inlets (Fig. 5-31 A) and subsequently directed to the same holding position of a zigzag electrode where they formed triplets (Fig. 5-31 F). Since only the GFP-expressing stem cells were visible in the fluorescence microscope (Fig. 5-31 B), they could be distinguished from the other cells in the cluster. After initial tests have successfully shown the feasibility of the approach, future experiments will reveal if the cluster formation procedure can be used to control differentiation processes in these cells.
79
5 Results
¯¯¯¯¯¯¯¯¯¯¯¯¯¯¯¯¯¯¯¯¯¯¯¯¯¯¯¯¯¯¯¯¯¯¯¯¯¯¯¯¯¯¯¯¯¯¯¯¯¯¯¯¯¯¯¯¯¯¯¯¯¯¯¯¯¯¯¯¯¯¯¯¯
Fig. 5-31: Contact formation between stem cells and two types of somatic cells. (A) GFP-expressing adult stem cells (Pancreatic stellate-like cells, PSLC, green arrow), cells of the Fetal skin dendritic cell line (FSDC, yellow arrow) and Neuro-2a cells (red arrow) enter the chip through three different inlets. First, a PSLC is directed to the hook electrode. Since the cell is constitutively expressing GFP, it can easily be distinguished from other cell types by fluorescence microscopy. (B) Fluorescence image of the cell in (A). (C-F) Directing the FSDC and the Neuro-2a cells to the same holding position of the zigzag electrode formed a triplet of the PSLC and the two somatic cells. Scale bar, 100 µm.
5.6.3 Contact formation between stem cells and functionalized nanobeads Inducing cellular interactions is not the only way to influence the microenvironment of stem cells in vitro. Alternatively, differentiation-mediating signals can be coupled to nanoparticles and be presented to the cells by incubating them in the bead suspension. Unfortunately, the use of standard cell culture methods disallows controlling the incubation time or separating the cells from excessive nanobeads after the incubation step. To overcome these limitations, the manipulation of stem cells and nanobeads was performed in the DEP chips. Particle manipulation Functionalized (magnetic) nanobeads, cells of the mouse pluripotent mES cell line E14Tg2A and stem cell medium were introduced into the chip through separate inlets so that the cells and the medium moved close to the channel walls (Fig. 5-32 G). In contrast, the beads moved in between. Deflection of the cells towards the opposite side of the microchannel made them cross the stream of nanobeads for a defined period of time depending on the flow rate (Fig. 5-32 A and B). Because the DEP force is a function of the particle radius, the nanobeads were not affected by the electric fields and passed the electrode structures. While excessive nanobeads were directed to the waste outlet, the bead-contacted stem cells were moved to the exit of the system (Fig. 5-32 C) and collected in a gelatin-coated 96 well plate (Fig. 5-32 D). The nanobeads had been coated before with either of three proteins: SPARC, LIF or BSA. While SPARC has been reported to induce cardiogenesis in mES cells, LIF is known to suppress differentiation processes in these cells. BSA-coated beads were used as a negative control.
80
5.6 Further applications
¯¯¯¯¯¯¯¯¯¯¯¯¯¯¯¯¯¯¯¯¯¯¯¯¯¯¯¯¯¯¯¯¯¯¯¯¯¯¯¯¯¯¯¯¯¯¯¯¯¯¯¯¯¯¯¯¯¯¯¯¯¯¯¯¯¯¯¯¯¯¯¯¯ Alternatively to the manipulation on the chip, the cells were incubated with the nanobeads in a standard reaction tube. After the incubation time was over, excessive nanobeads were magnetically separated from the cell suspension and discarded while the cells were transferred to a gelatincoated 96 well plate.
Fig. 5-32: Contact formation of mES cells with functionalized nanobeads. (A) Cells, nanobeads and stem cell medium were introduced into the chip through separate inlets. This made both, cells and medium flow near the channel walls while the nanobeads moved in between. By means of DEP manipulation the cells were shifted across the microchannel which made them dip into the nanobead solution for a short period of time. Due to their small size, the nanobeads were not affected by the DEP forces and passed the electrode structures. While waste particles were directed to the waste outlet, the manipulated cells were guided to the exit of the fluidic system where they were collected into a microwell for further cultivation. (B) Brightfield microscopy image of the manipulation process described in (A). Scale bar, 300 µm. (C) Separation of excess nanobeads from the manipulated stem cells. While the nanobeads moved straight on to the waste outlet, the beadcontacted stem cells were directed to the exit of the system. Diligent fluidic control ensured that the separated cells did not contaminate with waste particles. (D) Chip manipulated stem cells after their extraction from the microfluidic system into a microwell. Scale bar, 150 µm. (E) Cells after four days of cultivation in the microwell. The cells grow up in small colonies that soon converge and cover the whole well. Scale bar, 100 µm. (F) Cluster of beating heart muscle cells on day 13 of cultivation. In the course of their cultivation the cells differentiated into cardiomyocytes and formed clusters of synchronously beating heart muscle cells. The beating area is marked red. Scale bar, 50 µm. (G) Fluidic layout.
Analysis of stem cell differentiation After having been collected in a microwell, the beadcontacted cells were cultivated further. On the ninth day of cultivation and on the five following days, the cells were analyzed for beating clusters of heart muscle cells (Fig. 5-32 F). The amount of the clusters was evaluated for each well and averaged over all wells of one condition. The results are shown in Fig. 5-33. In the case of cells that had been manipulated in the reaction tube, the exposition to SPARC-coated beads (n = 10) caused a considerably higher amount of beating 81
5 Results
¯¯¯¯¯¯¯¯¯¯¯¯¯¯¯¯¯¯¯¯¯¯¯¯¯¯¯¯¯¯¯¯¯¯¯¯¯¯¯¯¯¯¯¯¯¯¯¯¯¯¯¯¯¯¯¯¯¯¯¯¯¯¯¯¯¯¯¯¯¯¯¯¯ clusters than the incubation in BSA-coated beads (n = 5, Fig. 5-33 B). A different situation was observed in cells that had been manipulated in the DEP chip (Fig. 5-33 A). Here, the values were in the same range, whether the cells had been exposed to BSA- or SPARC-coated beads (n = 9 and n = 16, respectively). However, cardiogenesis was not diminished after LIF exposition (n = 16): the amount of beating heart muscle clusters was even higher than for the BSA- or SPARC-contacted cells. Unfortunately, the examination of the cells that had been exposed to LIF beads in the reaction tube was not possible because the cells did not grow after seeding (n = 6). While the highest amount of beating cardiomyocytes among the chip-manipulated cells was 2.5 ± 0.9 well-1 (LIF exposition, day 13) incubating the cells with SPARC-coated beads in the reaction tube led to values of up to 3 ± 1 well-1, 4 ± 1 well-1 and 3 ± 1 well-1 (days 12, 13 and 14, respectively).
Fig. 5-33: Analysis of cardiogenesis in LIF- BSA- or SPARC-exposed mES cells. The cells were contacted with LIF- BSA- or SPARC-coated nanobeads by either mixing the two particle suspensions (B) in a reaction tube or by (A) mixing cells and beads in the DEP chip. After the incubation step, the cells were separated from excess nanobeads and cultivated further in microwells. On the ninth day of cultivation and on the five following days, the wells were analyzed for beating stem cell clusters. The number of beating clusters was evaluated for each well and averaged over all wells of one condition. Error bars, s.e.m.
82
5.6 Further applications
¯¯¯¯¯¯¯¯¯¯¯¯¯¯¯¯¯¯¯¯¯¯¯¯¯¯¯¯¯¯¯¯¯¯¯¯¯¯¯¯¯¯¯¯¯¯¯¯¯¯¯¯¯¯¯¯¯¯¯¯¯¯¯¯¯¯¯¯¯¯¯¯¯
83
6 Discussion
¯¯¯¯¯¯¯¯¯¯¯¯¯¯¯¯¯¯¯¯¯¯¯¯¯¯¯¯¯¯¯¯¯¯¯¯¯¯¯¯¯¯¯¯¯¯¯¯¯¯¯¯¯¯¯¯¯¯¯¯¯¯¯¯¯¯¯¯¯¯¯¯¯
6
Discussion
6.1
Particle manipulation
6.1.1 Pair formation procedure The main topic of the present study was to develop a protocol for the controlled stimulation of individual T cells with surface-modified microbeads and the analysis of the induced cellular reactions on a single-cell level. For this, a DEP-based microfluidic system was employed. Besides the contact formation procedure, a method for the release of the formed cell-bead pairs from the microfluidic system was established. This made the cells available for a broad spectrum of downstream analyses and allowed correlating short-term responses to the bead stimulus with later signaling events during the activation process of individual T cells. The control over the exact time point of the stimulus presentation and the ability to release the manipulated objects from the device is the central advancement of the technique and distinguishes it from many other approaches based on either hydrodynamic [Faley S et al., 2008; Skelley AM et al., 2009], mechanical [Lomakina EB and Waugh RE, 2004; Xu G and Shao JY, 2008], optical [Wei XB et al., 1999], or adhesive forces [Patrick SM et al., 2000; Kim S et al., 2001; Rosenthal A et al., 2007]. The application of nDEP forces allowed manipulating the cells in standard cell culture medium with high conductivity (see Fig. 3-1). Moreover, it also provided handling of the cells without touching them. This is of utmost importance when investigating surface-mediated signal transduction processes, since any ill-defined physical contact with the cell membrane runs the risk of initiating non-specific intracellular signaling pathways. While other approaches allow studying hundreds or thousands of signaling events in parallel [Rosenthal A et al., 2007; Faley S et al., 2008], only one cell was stimulated in the reaction chamber of the DEP chips at a time. The time necessary for selecting a T cell and a bead, forming contact between the two particles, and isolating the cell-bead pair in a microplate added up to approximately 5 to 10 min. This makes the technique currently allow analyzing roughly 30 to 50 cell-bead pairs per day. However, automation of the procedure seems feasible, since the use of only a few electrode elements and not more than three parameter configurations for hydrodynamic flow and electrode voltages was necessary for a highly efficient particle manipulation (see methods section). The combination of automation with parallelization (either in a single chip or by employing an array of chips) or simply the use of higher flow rates could be possible strategies to enhance the throughput of the system. In contrast to the analysis of thousands of cells in one reaction chamber at a time, their serial investigation excludes paracrine signaling between neighboring cells during the experimental procedure. This is advantageous, since such signaling could interfere with the applied stimulus [Faley S et al., 2008].
84
6.1 Particle manipulation
¯¯¯¯¯¯¯¯¯¯¯¯¯¯¯¯¯¯¯¯¯¯¯¯¯¯¯¯¯¯¯¯¯¯¯¯¯¯¯¯¯¯¯¯¯¯¯¯¯¯¯¯¯¯¯¯¯¯¯¯¯¯¯¯¯¯¯¯¯¯¯¯¯ The high temporal and spatial resolution of the particle manipulation as well as its high dynamic range allow precisely positioning the cells at the scale of micrometers and seconds, respectively, and at the same time transporting them very quickly over distances of several millimeters or analyzing them for hours and days. The possibility to control the microchannel temperature (see section 5.2.4) at physiological levels ensures maintaining physiological processes even under prolonged incubation periods of the cells in the chip. Since the medium in the channel can be changed within a few minutes (depending on the fluid flow, see section 5.2.4), the cells can repeatedly be exposed to various chemical stimuli or reagents during their incubation. Taking all these things together makes the chip not only a potent tool for the precisely controlled pair formation of microscale objects but also a versatile platform for single-cell analysis that is able to manipulate, stimulate and analyze selected single cells precisely and on highly diverging time scales.
6.1.2 Single-cell isolation For the release of the microscale objects from the fluidic system, considerable optimization was necessary. A major contributing factor to the successful isolation proved to be the time from the pairs reaching the sheath flow to the gathering of the droplet in a microplate at the exit of the tubing system (see methods section). Depending on the sheath flow rate, this time had to be determined carefully to ensure that the gathered droplet contained the cell-bead pair of interest. Failed isolation was mainly due to dissociation of the cell-bead pairs as a result of shear stress during the acceleration process. Only a few approaches have been shown to manage the isolation of single cells from a microfluidic system. Although the release of microbeads from a dynamic microarray has been described in context with a very interesting approach for a micro-scaled array chip [Tan WH and Takeuchi S, 2007; Kim YJ et al., 2008]), the authors did not provide detailed information about the mechanism or the efficiency of the particle isolation from their system.
6.1.3 Further applications It is obvious that Jurkat T cells and the microbeads used here can be replaced with arbitrary mammalian cell types. Hence, the described pair formation procedure opens up a wide spectrum of possible applications, especially because of the ability to release the manipulated objects from the chip and to make them available for further analyses on DNA-, RNA- or protein expression level or for their further cultivation or even transplantation. In clinical research, working on physiological cell models is strongly desirable. Since primary cells more closely model in vivo responses compared to immortalized T cell lines [Faley S et al., 2008], the DEP chips were also used to stimulate T cells from genetically modified mice (OT-I cells) with dendritic cells (FSDC) presenting a specific antigen (see section 5.6.1). Unfortunately, selectively clustering the OT-I cells and the peptide-loaded FSDC did not result in stable aggregates. Although the formation of stable and prolonged contacts between T cells and APC is not necessary to initiate T cell signaling, it is still required for effective T cell proliferation and differentiation [Acuto O and Cantrell D, 2000]. The ineffective pair formation was surprising, because T cells and APC usually 85
6 Discussion
¯¯¯¯¯¯¯¯¯¯¯¯¯¯¯¯¯¯¯¯¯¯¯¯¯¯¯¯¯¯¯¯¯¯¯¯¯¯¯¯¯¯¯¯¯¯¯¯¯¯¯¯¯¯¯¯¯¯¯¯¯¯¯¯¯¯¯¯¯¯¯¯¯ form stable contacts within a few seconds to one minute [Acuto O and Cantrell D, 2000]. This is much shorter than the contact times employed in the DEP chips (up to five minutes). Beyond that, the clustering of more than two cells or particles was accomplished in this work (see section 5.6.2). A GFP-expressing adult stem cell (PSLC) was contacted with a FSDC cell and a Neuro-2a cell. The clustering of different cell types might be useful for creating a specific microenvironment for the cells. As cellular processes such as migration, growth and gene expression are triggered or influenced by the biomolecular three-dimensional organization of neighboring surfaces [Folch A and Toner M, 2000] this could help to regulate differentiation processes in e.g. stem cells in vitro. Alternatively, it could also be used for the presentation of excitatory or inhibitory stimuli to a target cell at a controlled temporal regime while its reaction is monitored simultaneously.
6.2
Correlation of short- and long-term responses to the applied bead stimulus
As described in section 5.2, working with the DEP chips allowed triggering of T cell activation on a single-cell level. Although all of the manipulated T cells had been treated equally and received the same activating stimulus, only 77% of the analyzed vital cells showed CD69 expression afterwards (Fig. 5-10). It is well known that individual cells, even though identical in appearance, can differ in the expression level of particular genes, the concentration of a critical metabolite or a specific ion [Sims CE and Allbritton NL, 2007]. This can influence their individual reaction to a given stimulus so that the recorded response patterns are probably unique in each individual cell. Further experiments were performed to elucidate, if the observed heterogeneities are already evident on the stage of the cytosolic Ca2+ signals. Although it is widely accepted that the Ca2+ signal encodes informational content in its frequency, amplitude and organization [Grafton G and Thwaite L, 2001; Lewis RS, 2001; Sims CE and Allbritton NL, 2007], relatively little is known about the concrete relationship of its shape with gene expression, protein expression or cytokine production. The experimental results of this work confirm that the dynamics of the cytosolic Ca2+ level provide useful information about later reactions of the cell. In contrast to earlier studies, working with DEP chips did not require genetically modifying [Negulescu PA et al., 1994; Dolmetsch RE et al., 1998] or artificially adhering the cells to a substrate [Dolmetsch RE et al., 1997; Dolmetsch RE et al., 1998]. The rising time of the Ca2+ signals were found to serve as an early indicator for a later activation of the cells (Fig. 5-16 A). Interestingly, only the time between the initial and the maximum peak but not the overall Ca2+ influx integrated over that time were significantly different in activated and non-activated cells (21 µM ± 3 µM and 15 µM ± 2 µM, respectively, p > 0.05, data not shown). Considering that T cell activation requires prolonged intracellular signaling over several hours [Wulfing C et al., 1997; Rachmilewitz J and Lanzavecchia A, 2002; Gallo EM et al., 2006], a decelerated Ca2+ mobilization could accompany decelerated Ca2+ elimination and, thus, could account for sustained Ca2+ signaling. However, to resolve open questions about long-lasting Ca2+ release, it will be necessary to measure Ca2+ concentrations in T cells over a time course of hours or days, as proposed by Quintana et al. [Quintana A et al., 2005]. On a single-cell level, this could be met by the on-chip activation protocol, provided the biocompatibility problems of the DEP chips 86
6.2 Correlation of short- and long-term responses to the applied bead stimulus
¯¯¯¯¯¯¯¯¯¯¯¯¯¯¯¯¯¯¯¯¯¯¯¯¯¯¯¯¯¯¯¯¯¯¯¯¯¯¯¯¯¯¯¯¯¯¯¯¯¯¯¯¯¯¯¯¯¯¯¯¯¯¯¯¯¯¯¯¯¯¯¯¯ described in section 5.4.2 can be solved. Practical issues like dye leakage from the cells could easily be bypassed by re-incubating the cells in fresh dye from time to time. This could be managed by subjecting the cells to a Fura-staining protocol similar to the protocol for antibody staining onchip (see section 5.2.4). Besides T cell activation, the proliferation state of the cells was correlated with the previously recorded Ca2+ signals. Dividing cells showed a significant higher maximum peak than non-dividing cells (Fig. 5-16 C). The finding is consistent with the work of Quintana et al., who detected a correlation between the magnitude of the Ca2+ signal elicited by CD3 stimulation and actindependent morphological changes in T cells [Quintana A et al., 2009]. Shape changes of the beadcontacted cells were also observed in the present work. They sometimes were followed by cell division within five minutes after bead contact (data not shown). The data confirm that motility, polarity as well as the proliferation of T cells are strongly related to the cytosolic Ca2+ concentration [Gallo EM et al., 2006; Schwarz EC et al., 2007]. In contrast to the rising time and maximum peak height, no other tested parameter correlated with any of the later reactions of the cells, including the response latency. This parameter was previously reported to depend on the strength of the applied stimulus [Wulfing C et al., 1997; Wei XB et al., 1999; Patrick SM et al., 2000]. In accordance with Wei [Wei XB et al., 1999], a strong variability of the response latencies between individual cells was detected. Although each of them had received the same, highly defined stimulus, the values ranged from 4 s to 143 s (data not shown). This suggests that the value of this parameter is not only a function of the applied bead stimulus but also depends on the physiological state of the analyzed cell. As response latencies are supposed to be mainly determined by the time a given number of TCR-antibody complexes are formed, the same approach could also be used for measuring cell-specific membrane parameters like the TCR density [Wei XB et al., 1999]. The feasibility to combine the analysis of short- and long-term responses in context with intercellular communication on a single-cell level makes this technique outstanding from other approaches to investigate cell signaling events, whether they depend on electric [Toriello NM et al., 2005], hydrodynamic [Faley S et al., 2008; Skelley AM et al., 2009], mechanical [Lee PJ et al., 2005] or optical [Eriksson E et al., 2007; Oddos S et al., 2008] forces. The potential of the system for investigating cellular interactions could be even enhanced by combining it with laser tweezers [Reichle C et al., 2001]. This might enable disassembling the previously formed cell-cell or cellbead pairs after defined contact times. Thus, the influence of the contact duration or the contact frequency between the T cell and the APC (or the functionalized microbead) on the T cell activation (in terms of Ca2+ mobilization, gene and protein expression, cytokine production or proliferation) could be investigated with high reliability [Friedl P and Gunzer M, 2001; Kim S et al., 2001].
87
6 Discussion
¯¯¯¯¯¯¯¯¯¯¯¯¯¯¯¯¯¯¯¯¯¯¯¯¯¯¯¯¯¯¯¯¯¯¯¯¯¯¯¯¯¯¯¯¯¯¯¯¯¯¯¯¯¯¯¯¯¯¯¯¯¯¯¯¯¯¯¯¯¯¯¯¯
6.3
Impact of the chip manipulation procedure on the cell physiology
6.3.1 Influence on the vitality Maintaining the vitality of single cells ex vivo is difficult. They are very sensitive to their environmental conditions and do only survive in special culture medium compositions as shown by limiting dilution assays with conditioned cell culture medium (Fig. 5-4). Moreover, the cavity that was used for their cultivation had to be thoroughly selected (Fig. 5-5). This shows that working with single cells requires the careful adjustment of their ambient conditions for any given experimental setup. Considering the fragility of these cells when cultivated individually, the influence of the chip manipulation procedure on their physiology was investigated, too. As shown in Fig. 5-10, the manipulation procedure does not affect the vitality of the cells to a large extent, which was proven by two facts: (i) the activation probability of the chip-manipulated cells was only marginally decreased as compared to cells that had been incubated with antibody-coated beads in a microwell (see Fig. 5-10 B and Fig. 5-3 E). (ii) The survival rates of cells manipulated in the chip were in the same range as that of single cells cloned by limiting dilution (Fig. 5-10 A). The data is consistent with previous studies in which eukaryotic cells were manipulated by DEP forces without showing a major reduction of their viability [Fuhr G et al., 1994; Muller T et al., 2003; Kern H et al., 2004; Hunt TP and Westervelt RM, 2006; Jaeger MS et al., 2008; Kortmann H et al., 2009]. As shown in Fig. 5-10 A, the vitality of the bead-contacted single cells was slightly reduced compared to that of non-contacted cells. Interestingly, a similar phenomenon was also observed in the bead stimulation experiments with standard cell culture methods. Here, 98.5% ± 0.5% of the cells that had been incubated in a microwell with uncoated beads, but only 86% ± 2% of the cells with antibody-coated beads were vital the following day (p < 0.05, see Fig. 5-3 E). In contrast, activating the cells on a planar surfaces resulted in similar survival rates for stimulated and unstimulated cells (96% ± 1%, and 97.8% ± 0.1%, respectively, Fig. 5-2 G). Thus, the reduced vitality of the bead-stimulated cells does neither seem to be a consequence of activating T cells per se, nor of stimulating them in the chip. It is rather an effect that occurred in context with the bead stimulation of the cells. Complex manipulation tasks like the aggregation of two or more cells in context with the analysis of e.g. intercellular communication or electrofusion require the manipulation forces to have little or no effect on the vitality of the cells, even under prolonged exposure times. In the first instance, several electrode voltages were tested for the DEP manipulation of the cells (see section 5.4.1). Even voltages of 3 V did not reduce the vitality, activation- or proliferation rates as compared to the manipulation at 1.5 V (which was used for contacting cells and beads, as described previously). In another experimental setup, it was tested whether prolonged exposure times of 20 or 60 min. affected the cell physiology. It turned out that the DEP manipulation did not affect the vitality of the cells as long as the electric field exposure time was below 20 min. (Fig. 5-20). Nevertheless, the manipulation times within the channel should still be as short as possible because the cells showed reduced vitality rates even after their mere incubation in the chip system. 88
6.3 Impact of the chip manipulation procedure on the cell physiology
¯¯¯¯¯¯¯¯¯¯¯¯¯¯¯¯¯¯¯¯¯¯¯¯¯¯¯¯¯¯¯¯¯¯¯¯¯¯¯¯¯¯¯¯¯¯¯¯¯¯¯¯¯¯¯¯¯¯¯¯¯¯¯¯¯¯¯¯¯¯¯¯¯ The reduced vitality after a prolonged microchannel incubation was most evident in cells that had been obtained in the on-chip activation protocol. These cells were massively damaged after over night incubation in the chip (see section 5.2.4). Since a negative effect of the manipulation procedure in the chips could be excluded (see above), only aspects of the cultivation step could be responsible for the observed effects. First, the nutrition supply of the cell in the chip was considered. In a standard cell culture flask with 2 × 10⁵ cells ml-1, the amount of culture medium available for each single cell is 5 nl (approximately 104 times its own volume). This is enough to feed the cell for at least two days and to dilute its produced metabolites to physiologically uncritical concentrations. Compared to that, the volume of the central microchannel is almost 20 times bigger (2000 × 1500 × 30 µm = 90 nl, see Fig. 6-1 A) which is more than adequate for incubating a single cell for one day. The dispersion of nutrients and metabolites in standard cell culture is mediated by both diffusion and convection, while in microchannels (under no flow conditions) the absence of large liquid-air interfaces provides an environment largely free of convection. Consequently, the transport of molecules is primarily diffusive [Yu HM et al., 2007]. Since for distances in the micrometer range the diffusion time of small molecules like glucose or lactate (diffusion coefficients in aqueous solution D = 6.75 × 10⁻¹⁰ and 1.03 × 10⁻⁹ m2 s-1, respectively, [Lide DR, 2004]) is in the range of seconds (see Fig. 6-1 B), an undersupply of nutrients can be excluded.
Fig. 6-1: Nutrient supply during the cultivation of single cells on-chip. (A) Dimensions of the central channel. The amount of culture medium available to a single cell in the microchannel is 90 nl and, thus, almost 20 times bigger than that for a cell under standard cell culture conditions with 2 × 10⁵ cells ml-1 (5 nl, circle). Scale bar, 200 µm. (B) Diffusion of lactate and glucose. The transport of nutrients and metabolites in the microchannel under no-flow conditions is mediated by diffusion. For distances in the micrometer range and for small molecules like glucose or lactate, this is in the range of seconds.
T cells are aerobic organisms which makes them not only depend on an organic energy source, but also on oxygen which they need for an efficient conversion of nutrients into ATP. Since the gas exchange between the microchannel and the environment was prevented by the chip material, the only oxygen that was available for respiration was that initially dissolved in the channel medium. The oxygen concentration in the (previously degassed) channel medium was unclear as well as the oxygen consumption of living T cells, since values for that are controversially reported in literature [Beltran B et al., 2002; Souid AK et al., 2003; Tao ZM et al., 2006]. Thus, the eventual need for an external oxygen supply was experimentally evaluated. Ultimately, cultivating the T cells under reduced gas exchange in glass capillaries did not affect their survival rate, even when previously degassed medium was used for their cultivation (see Fig. 5-24).
89
6 Discussion
¯¯¯¯¯¯¯¯¯¯¯¯¯¯¯¯¯¯¯¯¯¯¯¯¯¯¯¯¯¯¯¯¯¯¯¯¯¯¯¯¯¯¯¯¯¯¯¯¯¯¯¯¯¯¯¯¯¯¯¯¯¯¯¯¯¯¯¯¯¯¯¯¯ Further experiments showed that the survival rate of the T cells strongly depended on the chip charge used for their microchannel cultivation. This suggests some chips per se having a cytotoxic influence on the cells, either by disadvantageous material properties or by e.g. chemical residuals left over from the fabrication process. Since even a degassing treatment in a vacuum chamber or extensive washing (see section 5.4.2) did not render the cytotoxic DEP chips biocompatible, the material used for their fabrication itself was assumed to impair the cell vitality. The chips were made from D263 glass (Schott, Germany), the negative photo resist SU-8 (MicroChem Corp., USA), titanium and platinum, SiO2 and the epoxy resin adhesive PD955PY (Heraeus, Germany). Any of these components had previously been used for cell cultivation which shows their biocompatibility [Jager EWH et al., 2002; Voskerician G et al., 2003; Yeon JH and Park JK, 2005; Hiromoto S et al., 2008]. Thus, it is unlikely that they per se caused cell damage. Beyond that, each of the chips (whether it was biocompatible or cytotoxic) was made from the same material which also argued against this assumption. Alternatively, the modalities of processing the material should be taken into consideration. For example, different conditions for coating, curing, tempering or cleaning particular workpieces could lead to slight variations in their chemical or mechanical properties that influence the biocompatibility or cytotoxicity of the chips. Maybe enhancing the uniformity and the reproducibility of the chip manufacturing process is a possible strategy to solve the biocompatibility problem of the chips and, thus, let them completely show their exceptional potential for single-cell analysis.
6.3.2 Influence on the cytosolic Ca2+ level As discussed above, a short electric field exposure did not impair the vitality, activation or proliferation of the cells. However, they showed irregular Ca2+ spiking after having been brought into the DEP field (see Fig. 5-21 A-C). On closer examination, these non-specific Ca2+ responses turned out to depend on the electric field strength, exposure time and field frequency. The latter observation suggests that spiking is caused by E-field-induced shifts in the membrane potential and not by temperature rises, because only effects on the membrane potential are frequency-dependent [Glasser H and Fuhr G, 1998; Jaeger MS et al., 2007]. Since T lymphocytes are not supposed to possess voltage-gated Ca2+ channels [Stokes L et al., 2004; Badou A et al., 2006], it is no option that Ca2+ influx is caused by a direct activation of such channels. In contrast, a plausible reason for transient Ca2+ influx is electroporation of the cell membrane. Poration of biological membranes occurs when transmembrane potentials reach a critical value so that membrane disruptions are induced. While Glasser and Maswiwat observed threshold levels between 0.5 and 1 V [Glasser H and Fuhr G, 1998; Maswiwat K et al., 2008], Weaver reported an enhanced probability for pore formation at transmembrane potentials of as low as 200 mV [Weaver JC, 2003]. To estimate the induced transmembrane potential in the experiments, the E-field in the microchannel was numerically calculated at high-field and at low-field mode (Fig. 6-2 A, B). Since the field strength decays somewhat more than proportional with the distance to the electrodes, the position of the cell in the microchannel has to be taken into consideration. A dielectrophoretically retained cell is trapped at the position where hydrodynamic and DEP forces balance each other. Hence, the distance d between the cell and the electrode structure (Fig. 5-21 B) depends on the flow velocity in the microchannel and the applied electrode voltage. As the analysis of the brightfield images revealed, d was 13.3 µm and 18.9 µm at high-field and at low-field mode, 90
6.3 Impact of the chip manipulation procedure on the cell physiology
¯¯¯¯¯¯¯¯¯¯¯¯¯¯¯¯¯¯¯¯¯¯¯¯¯¯¯¯¯¯¯¯¯¯¯¯¯¯¯¯¯¯¯¯¯¯¯¯¯¯¯¯¯¯¯¯¯¯¯¯¯¯¯¯¯¯¯¯¯¯¯¯¯ respectively. Thus, the average field strength that a cell experienced was 29.0 kV m-1 at high-field and 7.4 kV m-1 at low-field condition. For both field strengths, the corresponding shift of membrane potential ΔΨind was calculated according to eq. (3.7) with a cell radius r = 5 µm, an area-specific membrane capacitance C = 1 µF cm-2, a cytosolic electric conductivity σin = 0.55 S m-1 and an electric conductivity of the surrounding cell culture medium σout = 1.4 S m-1. The calculated shift in the membrane potential (which has to be added to or subtracted from the resting potential of approx. - 30 mV [Fraser SP et al., 2004], respectively) at the frequencies used was only between 26 mV (5 MHz, low-field mode) and 167 mV (1 MHz, high-field mode, Fig. 6-2 D). Nevertheless, irregular Ca2+ spiking due to electric field exposure was observed in all conditions. Apparently, the mean transmembrane potentials were lower than the critical values proposed above, but local shifts could have been higher, especially at areas close to the electrodes and with the field lines entering the cell perpendicular to the membrane. Interestingly, Ca2+ spikes due to high field exposure mainly occurred, after the high-field mode already had been switched to low-field mode again (Fig. 5-21 G). This suggests that effects with a delayed response time may be responsible for Ca2+ spiking upon DEP field exposure. Since the formation of membrane pores is reported to occur on much shorter time scales [Chen C et al., 2006] (i.e., in the range of several ns), Ca2+ influx could also be due to biochemical signal transduction processes triggered by voltagesensitive proteins in the cell membrane [Bezanilla F, 2008].
Fig. 6-2: Quantification of the electric field experienced by the cells during DEP manipulation and its influence on the cellular membrane potential. (A,B) Side view of the microchannel at zigzag electrode z2 (see also Fig. 4-1 C, D and E). The electric field strength in the channel was numerically calculated for electrode voltages of 1.2 V (A) and 3.0 V (B), respectively. Bright colors represent high electric field strengths. The distance of a cell (dashed circle) to the electrode at low-field and at high-field mode was obtained from the analysis of the corresponding brightfield images. The asymmetry in the E-field is due to the zigzag-shaped electrodes not extending normal through the paper plane. (C) Dependence of electric field exposure on the distance d between the cell and the zigzag electrode z2. (D) Dependence of the induced membrane potential shift on the field frequency. The graph was calculated from equation (3.7) with the electric field strengths for high-field and for low-field mode obtained from (C) (see text).
One possibility to minimize the described side effects of DEP manipulation is to drive the electrodes at high field frequencies. Since – in the MHz range – this reduces DEP forces and 91
6 Discussion
¯¯¯¯¯¯¯¯¯¯¯¯¯¯¯¯¯¯¯¯¯¯¯¯¯¯¯¯¯¯¯¯¯¯¯¯¯¯¯¯¯¯¯¯¯¯¯¯¯¯¯¯¯¯¯¯¯¯¯¯¯¯¯¯¯¯¯¯¯¯¯¯¯ ultimately leads to pDEP (depending on the electrical conductivity of the surrounding medium, see Fig. 3-1), the exposure times of the cells to high electric fields were kept (in the bead stimulation experiments) at a minimum (below 30 s). This ensured that irregular Ca2+ spiking remained moderate and – most importantly – clearly discriminable from the typical bead-induced Ca2+ signal (Fig. 5-21 A-C).
6.4
Stability of the bead coating
The bead-stimulation experiments described above were performed with microbeads that had been coated with antibodies against CD3 and CD28. The molecules were coupled to the beads noncovalently via protein A. Since dissociating antibodies could interfere with the bead-stimulus, an important issue was to estimate the stability of the bead-coating throughout experimentation. In a first series of experiments, T cells were flushed with or incubated in cell culture medium that had been exposed to antibody-coated microbeads before. The elicited physiological reactions like intracellular Ca2+ signaling or T cell activation were analyzed and compared with the cellular responses after incubation in culture medium containing antibodies of defined concentrations. Moreover, the binding properties of the antibodies to the protein A were evaluated. From this, the coating efficiency and the extent of the antibody dissociation from the beads were estimated theoretically.
6.4.1 Analysis of the binding constants for the protein A-IgG interaction Protein A was coupled to a sensor chip and exposed to different concentrations of anti-CD3 or antiCD28 (mouse IgG1 and mouse IgG2a, respectively) while the association of the IgG molecules to the surface was monitored with an SPR biosensor. The dissociation of the molecules was analyzed by washing the antibody-covered sensor chip with fresh buffer. Although the interaction between protein A and IgG is known to be heterogeneous [Jendeberg L et al., 1995], the association and dissociation constants for both types of antibodies were estimated by fitting a Langmuir (1:1) binding model to the data of the sensorgram (see Fig. 5-28). This returned the apparent rates for a ligand that binds to a surrogate homogeneous receptor with kinetics that would generate approximately the same time courses as its binding to the heterogeneous one. In the case of IgG2a (anti-CD28), only IgG concentrations up to 14.2 nM were included in the fit, because the antibody concentrations for coating the beads usually were in that range. The low Chi2 values (< 1% of Rmax, see Tab. 5-2) show that this model provided an acceptable fit to the data. Possibly, this was because most of the antibodies predominantly bound to only a single type of target binding site at these concentrations. In contrast, the binding curves of anti-CD3 (IgG1) suggested a more pronounced heterogeneity of its interaction with protein A, even for low antibody concentrations (see Fig. 5-28). However, the software used was not able to fit such complex interaction patterns so that the simple Langmuir model was also employed in this case. Because of the low signal-to-noise-ratio at concentrations in the lower nM range, all tested antibody concentrations were included in this fit. Since the Chi2 values obtained were in the range of 1% of Rmax, the fit anyhow provided sufficient information about the binding rate constants of anti-CD3 to protein A.
92
6.4 Stability of the bead coating
¯¯¯¯¯¯¯¯¯¯¯¯¯¯¯¯¯¯¯¯¯¯¯¯¯¯¯¯¯¯¯¯¯¯¯¯¯¯¯¯¯¯¯¯¯¯¯¯¯¯¯¯¯¯¯¯¯¯¯¯¯¯¯¯¯¯¯¯¯¯¯¯¯
6.4.2 Antibody desorption from functionalized beads that are incubated in culture medium Mixing Jurkat T cells with cell culture medium that had been exposed to antibody-coated beads of type A strongly activated the cells (see Fig. 5-26). This shows that antibodies do desorb from the beads when incubated in fresh cell culture medium. The theoretical estimation of the amount of antibody desorption showed that the bead-exposed medium contained 88 nM anti-CD3 and 1.1 nM anti-CD28 in these experiments. According to Fig. 5-27 C, the incubation of Jurkat T cells in culture medium containing 88 nM of anti-CD3 was shown to activate approximately 52% of the cells (note, that the concentration of anti-CD28 is not further considered, since it has only costimulatory effects). This is consistent with the results obtained in section 5.5.1, where 51% of the cells were activated after incubation in cell culture medium that had been exposed to antibodycoated beads of type A. In contrast to bead type A, the supernatant of bead type B had a considerably lower activating potential than theoretically anticipated (4%, see Fig. 5-26). This could have been due to a lower antibody binding capacity of the beads than asserted by the manufacturer. The theoretical estimation also showed that 97% of the initially coupled anti-CD3 and 52% of the initially coupled anti-CD28 had been dissociated from the beads after over night incubation in the cell culture medium. Interestingly, the incubated beads of type A still activated 94% of the cells, which is almost twice the activation rate of the cells exposed to the medium containing the desorbed antibodies (51%). This corroborates the previously reported strong activating potential of immobilized anti-CD3, as compared to its soluble form [van Lier RA et al., 1989]. An important question in context with the bead stimulation of single cells (see section 5.2) is, whether the surface-mediated stimulus by the bead contact was predominated by desorbed antibodies from the single bead. For that the number of antibodies coated to a single bead has to be considered (which was 1.1 × 10⁵ and 2.6 × 10⁶ for anti-CD3 and anti-CD28, respectively, see section 5.5.3). Even when the phenomenon of the rebinding of dissociated antibodies is neglected and it is assumed that 100% of the bead-coupled antibodies detach during the over night incubation of the cell-bead pair (which was incubated in 100 µl of conditioned medium, see methods section), the IgG concentration in the well will not exceed 1.9 × 10⁻¹⁵ and 4.2 × 10⁻¹⁴ M for anti-CD3 and anti-CD28, respectively. These values are far below the critical concentration at which soluble antibodies induce a detectable amount of T cell activation (ca. 10-12 M, see Fig. 5-27 C). Thus, the antibodies in solution are not assumed to interfere with the surface-mediated stimulus to the T cell.
6.4.3 Antibody desorption from functionalized beads that are flowed with culture medium The calcium imaging experiments in the DEP chips revealed irregular Ca2+ spiking in cells that were held downstream of an antibody-coated microbead. In contrast, this effect was considerably lower when the cells were held downstream of an uncoated bead (see Fig. 5-25). In the following will be discussed, if the observed effects are due to desorbing antibodies from the functionalized bead surface.
93
6 Discussion
¯¯¯¯¯¯¯¯¯¯¯¯¯¯¯¯¯¯¯¯¯¯¯¯¯¯¯¯¯¯¯¯¯¯¯¯¯¯¯¯¯¯¯¯¯¯¯¯¯¯¯¯¯¯¯¯¯¯¯¯¯¯¯¯¯¯¯¯¯¯¯¯¯ The antibody concentration to which a cell was exposed to in these experiments was calculated to 3.5 pM anti-CD3 and 110 pM anti-CD28 (see section 5.5.3). Although anti-CD28 can mobilize intracellular Ca2+ [Nunes J et al., 1993; Kovacs B et al., 2005], its potential to enhance the cytosolic Ca2+ level in Jurkat cells is much weaker than that of anti-CD3 [Nunes J et al., 1993]. Thus, the anti-CD3 concentration was primarily considered further. The amount of Ca2+ spiking in cells that were held downstream of an antibody-coated bead was 400 nM2. This value was compared with the extent of Ca2+ spiking in cells that had been exposed to defined antibody concentrations in a microwell. As shown in Fig. 5-27 B, irregular Ca2+ spiking between 100 and 500 nM2 was provoked by concentrations of anti-CD3 (and anti-CD28) between 1 and 10 pM. Thus, the theoretically estimated concentration of anti-CD3 (3.5 pM) agrees with the experimental data. As a consequence, detachment of the bead-coupled antibodies is assumed to influence the cytosolic Ca2+ level in cells held in the zigzag electrode downstream of an antibody-coated bead. The discussed experiments point out both, a drawback and another applicability of the system. On the one hand, the stimulation of the T cells with non-covalently coated beads provides only limited control over the activating stimulus due to antibody desorption from the particles. From this perspective, the antibodies should be coupled to the beads covalently rather than adsorptively, even if the activation state of the stimulated single cells does not appear to be affected by the desorbed molecules. On the other hand, the same procedure could be used to investigate paracrine signaling between two individual cells, e.g. between an APC and a T cell [Faley S et al., 2008].
6.5
Stem cell differentiation with functionalized nanoparticles
In addition to their use for triggering T cell activation on a single-cell level, the DEP chips were employed for controlling the differentiation state of mES cells. For that, the cells were contacted with functionalized nanobeads, separated from unbound particles and released from the fluidic system for further cultivation. This setup provided a high control over the incubation time in the temporal range of seconds. Since the separation efficiency of cells and unbound beads was very good, waste particles were largely prevented from contaminating the released cells (see Fig. 5-32 C). Compared to that, the magnetic separation of cells and waste beads used in the control experiments was considerably less effective. Thus, accidentally deposited nanobeads were primarily observed in the wells with cells of the control group (data not shown) while the wells with chip-manipulated cells were practically free of them (see Fig. 5-32 D). As shown in Fig. 5-33 A, incubating the cells in the nanobead suspension on-chip had no influence on their differentiation state. The chip-manipulated cells showed erratic cardiomyocyte differentiation, whether they had been incubated in BSA-, LIF- or SPARC-coated nanobeads. The fact that the wells with LIF-contacted cells contained just as many or even more cardiomyocyte clusters than those with cells exposed to BSA- or SPARC-coated beads shows that the observed cardiomyogenesis was primarily due to spontaneous differentiation processes in these cells but triggered by the bead stimuli. Compared to that, cells of the control group (which had been mixed with the beads in a reaction tube) showed a more pronounced difference in their cardiomyocyte differentiation, depending on their exposure to BSA- or SPARC-coated beads. Here, the SPARCcontacted cells showed a considerably higher differentiation rate that those that were contacted with BSA-coated beads (Fig. 5-33 B).
94
6.5 Stem cell differentiation with functionalized nanoparticles
¯¯¯¯¯¯¯¯¯¯¯¯¯¯¯¯¯¯¯¯¯¯¯¯¯¯¯¯¯¯¯¯¯¯¯¯¯¯¯¯¯¯¯¯¯¯¯¯¯¯¯¯¯¯¯¯¯¯¯¯¯¯¯¯¯¯¯¯¯¯¯¯¯ The observed differences in the strength of cardiomyogenesis observed in the chip-manipulated and in the control cells could be due to the contamination with excess nanobeads evident in the control cells, but not in those that had been manipulated in the chip. According to that, the incubation step of ca. 30 s could have been too short to initiate a sufficient number of cell-bead contacts to either trigger (SPARC-beads) or suppress (LIF-beads) stem cell differentiation. Since the chipmanipulated cells had been separated efficiently from waste nanobeads after the incubation step, they apparently did not receive any further bead contact. In contrast, cells of the control group were contaminated with excess nanobeads and, thus, might have been stimulated by the nanobeads even after the incubation step. Unfortunately, the effect the LIF-coated beads on the cardiomyocyte differentiation in the control cells could not be investigated. A reduced cardiomyogenesis in these cells could have confirmed the described hypothesis. Although cardiomyocyte differentiation in mouse ES cells was not induced (or suppressed) by the protocol employed, it was shown that the DEP chips enable initiating the interaction between nanoparticles and cells and the control of the incubation time. A major goal of using nanoparticles for biomedical applications is to control drug delivery to specified target areas in the organism [Farokhzad OC et al., 2006]. A key aspect in this context is the development of integrated drug delivery systems to monitor and control the cellular responses to the applied pharmaceutical stimuli [Li J and Kleinstreuer C, 2009]. Microfluidic systems have been used before for controlled drug delivery [Wang F et al., 2008] and for exposing cells to functionalized nanoparticles [Farokhzad OC et al., 2005]. However, very few systems have been described before to manage these tasks with suspended cells.
95
7 Conclusion
¯¯¯¯¯¯¯¯¯¯¯¯¯¯¯¯¯¯¯¯¯¯¯¯¯¯¯¯¯¯¯¯¯¯¯¯¯¯¯¯¯¯¯¯¯¯¯¯¯¯¯¯¯¯¯¯¯¯¯¯¯¯¯¯¯¯¯¯¯¯¯¯¯
7
Conclusion
In the current study, a process line has been presented for initiating and monitoring cell- or surfacemediated signal transduction processes at different temporal regimes and on a single-cell level. It utilizes a DEP-based microfluidic system that provides the manipulation of cells and particles at very high spatiotemporal resolution and without the need of contacting the cell membrane. The system was used for triggering T cell activation on a single-cell level. For this, single T cells were contacted with surface-modified microbeads that mimic the activating signal of an APC by presenting antibodies directed against the TCR-associated kinase CD3 and the costimulatory molecule CD28. Unrestricted optical access provided the observation of immediate cellular reactions like a rapid rise in the cytosolic Ca2+ concentration (i.e., short-term response) upon the stimulus presentation. After Ca2+ imaging, the manipulated cells were released from the microfluidic system. Diligent fluidic control ensured that only the cells of interest reached the outlet of the microchannel system which enabled their individual deposition into a well of a cell culture plate. This made them available for further cultivation and allowed for the analysis of cell division and the expression of the activation marker molecule CD69 as a crucially important late activation step (i.e., long-term response), the following day. Since the identity of each individual cell was preserved throughout the whole experimental procedure, both short and long-term responses to the bead stimulus could be correlated with each other. It turned out that the temporal profile of the Ca2+ traces between both activated and non-activated cells as well as dividing and non-dividing cells differed significantly. This shows that the pattern of Ca2+ signals in T cells can provide early information about a later reaction of the cell. For maintaining the vitality of single cells during and after DEP manipulation, experimental conditions were identified which had the lowest possible impact on the physiology of the cells. Neither a short-term manipulation of about one minute with different electrode voltages nor a 20 min. electric field exposure prior to single-cell cultivation had an effect on both vitality and proliferation rate. On the contrary, the cells showed irregular Ca2+ transients when exposed to the DEP fields only. These Ca2+ signals were clearly discriminative from the bead-induced Ca2+ transients and depended on exposure time, electric field strength and field frequency. Since only effects on the membrane potential but not ohmic warming are frequency-dependent, the observed effects were most likely due to electroporation or biochemical signal transduction processes triggered by some voltage-sensitive proteins in the cell membrane. In order to reduce these sideeffects of the DEP manipulation, the electric field exposure time in the bead-stimulation experiments was kept at a minimum. Driving the electrodes at higher field frequencies would have been another possibility, but that would have undesirably reduced the DEP forces in the experimental setup. Besides the careful adjustment of the electric field parameters, considerable optimization of the culture conditions was required. In this context, the use of conditioned cell culture medium and a particular type of culture vessel proved to be essential for a successful cultivation of the single-cells in standard cell culture plates. On the other hand, certain cell damages resulted from the prolonged incubation periods during the on-chip cultivation of single cells in the microchannel environments of the DEP chips. As the extent of such damaging effects of the chip environment differed between different lots of DEP chips, the way in which they were manufactured might be decisive for their 96
7 Conclusion
¯¯¯¯¯¯¯¯¯¯¯¯¯¯¯¯¯¯¯¯¯¯¯¯¯¯¯¯¯¯¯¯¯¯¯¯¯¯¯¯¯¯¯¯¯¯¯¯¯¯¯¯¯¯¯¯¯¯¯¯¯¯¯¯¯¯¯¯¯¯¯¯¯ biocompatibility. Hence, optimization of the fabrication process might be a possible strategy to solve this problem. The IgG molecules of the anti-CD3/anti-CD28 presenting microbeads were coupled to the surface of the beads non-covalently via immobilized protein A. In order to estimate the reliability of the activating stimulus in the bead stimulation experiments, the stability of the antibody coating was evaluated. For this purpose, the binding characteristics of the protein A-IgG interaction were measured by SPR technology. From this, the coating efficiency and the extent of antibody desorption from the bead surface during the experimental procedure were theoretically estimated. While the amount of desorbing antibodies was high enough to elicit unspecific Ca2+ transients in the bead-stimulated single cells, they were not expected to influence later activation events. For achieving the greatest possible spatiotemporal control over the activating stimulus, covalent coupling of the antibodies to the bead surface is still recommended. The setup is extremely versatile with regard to the cellular system analyzed, since it could be applied to the assembly of arbitrary cells and cell-sized particles. In this line, the pair formation procedure has been employed for stimulating primary T cells with APC instead of the artificial microbeads. Moreover, it has been used for clustering triplets of stem cells and two types of somatic cells. The latter could help to define the microenvironment of the stem cell which seems to be a key requirement in controlling differentiation processes. The high flexibility of the approach is further stressed by the possibility to individually isolate the cells from the microfluidic system after their manipulation. This offers a broad spectrum of possible downstream analyses. As an extension, a detailed examination of the cells at RNA-, DNA- or protein expression level is conceivable, so also is their further cultivation or even transplantation. In addition to this, the investigation of the immediate cellular reaction upon stimulation is not restricted to Ca2+ imaging alone. Instead, the DEP chips allow the investigation of a multitude of cellular reactions that are accessible by highresolution microscopy. Against the backdrop of qualifying this approach for a biomedical application, robustness and reproducibility could be further improved as this assay format is capable of complete automation. To sum up, the present work gives an extensive description of a process line for the investigation of cell-signaling events on a single-cell level. It provides the foundation for an enabling technology that will offer new possibilities to unravel the mechanisms underlying intercellular communication and, thus, will help to understand the related signal transduction processes in greater depth.
97
8 References
¯¯¯¯¯¯¯¯¯¯¯¯¯¯¯¯¯¯¯¯¯¯¯¯¯¯¯¯¯¯¯¯¯¯¯¯¯¯¯¯¯¯¯¯¯¯¯¯¯¯¯¯¯¯¯¯¯¯¯¯¯¯¯¯¯¯¯¯¯¯¯¯¯
8
References
Abidor IG, Arakelian VB, Pastushenko VF, Tarasevich MR, Chernomordik LV (1978): [Electrical breakdown of lipid bilayer membranes]. Dokl Akad Nauk SSSR 240 (3):733-736. Acuto O, Cantrell D (2000): T cell activation and the cytoskeleton. Ann Rev Immunol 18 165-184. Andersson H, van den Berg A (2004): Microtechnologies and nanotechnologies for single-cell analysis. Curr Opin Biotech 15 (1):44-49. Arrol HP, Church LD, Bacon PA, Young SP (2008): Intracellular calcium signalling patterns reflect the differentiation status of human T cells. Clin Exp Immunol 153 (1):86-95. Ashkin A, Dziedzic JM, Yamane T (1987): Optical trapping and manipulation of single cells using infrared laser beams. Nature 330 (6150):769-771. Badou A, Jha MK, Matza D, Mehal WZ, Freichel M, Flockerzi V, Flavell RA (2006): Critical role for the beta regulatory subunits of Cav channels in T lymphocyte function. Proc Natl Acad Sci U S A 103 (42):15529-15534. Baniyash M (2004): Tcr zeta-chain downregulation: Curtailing an excessive inflammatory immune response. Nat Rev Immunol 4 (9):675-687. Bautista DM, Hoth M, Lewis RS (2002): Enhancement of calcium signalling dynamics and stability by delayed modulation of the plasma-membrane calcium-ATPase in human T cells. J Physiol-London 541 (3):877-894. Beebe DJ, Mensing GA, Walker GM (2002): Physics and applications of microfluidics in biology. Annu Rev Biomed Eng 4 261-286. Beier KC, Hutloff A, Dittrich AM, Heuck C, Rauch A, Buchner K, Ludewig B, Ochs HD, Mages HW, Kroczek RA (2000): Induction, binding specificity and function of human ICOS. Eur J Immunol 30 (12):3707-3717. Beltran B, Quintero M, Garcia-Zaragoza E, O'Connor E, Esplugues JV, Moncada S (2002): Inhibition of mitochondrial respiration by endogenous nitric oxide: A critical step in Fas signaling. Proc Natl Acad Sci U S A 99 (13):8892-8897. Bernhardt JH (1992): Non-ionizing radiation safety: radiofrequency radiation, electric and magnetic fields. Phys Med Biol 37 (4):807-844. Bezanilla F (2008): How membrane proteins sense voltage. Nat Rev Mol Cell Bio 9 (4):323-332. Blank M, Goodman R (2009): Electromagnetic fields stress living cells. Pathophysiology Boettcher M, Jaeger M, Kirschbaum M, Muller T, Schnelle T, Duschl C (2008): Gravitation-driven stress-reduced cell handling. Anal Bioanal Chem 390 (3):857-863. Braschler T, Demierre N, Nascimento E, Silva T, Oliva AG, Renaud P (2008): Continuous separation of cells by balanced dielectrophoretic forces at multiple frequencies. Lab Chip 8 (2):280-286. Braschler T, Johann R, Heule M, Metref L, Renaud P (2005): Gentle cell trapping and release on a microfluidic chip by in situ alginate hydrogel formation. Lab Chip 5 (5):553-559. Breslauer DN, Lee PJ, Lee LP (2006): Microfluidics-based systems biology. Mol Biosyst 2 (2):97112. Castellanos MC, Munoz C, Montoya MC, Lara-Pezzi E, Lopez-Cabrera M, de Landazuri MO (1997): Expression of the leukocyte early activation antigen CD69 is regulated by the transcription factor AP-1. J Immunol 159 (11):5463-5473.
98
8 References
¯¯¯¯¯¯¯¯¯¯¯¯¯¯¯¯¯¯¯¯¯¯¯¯¯¯¯¯¯¯¯¯¯¯¯¯¯¯¯¯¯¯¯¯¯¯¯¯¯¯¯¯¯¯¯¯¯¯¯¯¯¯¯¯¯¯¯¯¯¯¯¯¯ Chen C, Smye SW, Robinson MP, Evans JA (2006): Membrane electroporation theories: a review. Med Biol Eng Comput 44 (1-2):5-14. Chiou PY, Ohta AT, Wu MC (2005): Massively parallel manipulation of single cells and microparticles using optical images. Nature 436 (7049):370-372. Choi J, Sawant SG, Couch DB, Ho IK, Farley JM (1995): Continuous Measurement of Changes in Intracellular Calcium Concentration in Mouse Splenic T Cells Attached to a Glass Substrate. J Biomed Sci 2 (4):379-383. Cooper MA (2002): Optical biosensors in drug discovery. Nat Rev Drug Discov 1 (7):515-528. Curtsinger J, Deeths MJ, Pease P, Mescher MF (1997): Artificial cell surface constructs for studying receptor-ligand contributions to lymphocyte activation. J Immunol Methods 209 (1):47-57. Dal Maschio M, Canato M, Pigozzo FM, Cipullo A, Pozzato G, Reggiani C (2009): Biophysical effects of high frequency electrical field (4-64 MHz) on muscle fibers in culture. Basic Applied Myology 19 (1):49-56. De Maio A (1999): Heat shock proteins: facts, thoughts, and dreams. Shock 11 (1):1-12. Desai SP, Voldman J: Measuring the impact of dielectrophoresis on cell physiology using a highcontent screening platform. The 12th International Conference on Miniaturized Systems for Chemistry and Life Sciences, µTAS 2008, San Diego, California, USA. Dittrich PS, Schwille P (2003): An integrated microfluidic system for reaction, high-sensitivity detection, and sorting of fluorescent cells and particles. Anal Chem 75 (21):5767-5774. Dolmetsch RE, Lewis RS, Goodnow CC, Healy JI (1997): Differential activation of transcription factors induced by Ca2+ response amplitude and duration. Nature 386 (6627):855-858. Dolmetsch RE, Xu KL, Lewis RS (1998): Calcium oscillations increase the efficiency and specificity of gene expression. Nature 392 (6679):933-936. Duschl C, Geggier P, Jaeger M, Stelzle M, Muller T, Schnelle T, Fuhr G: Versatile chip-based tools for the controlled manipulation of microparticles in biology using high frequency electromagnetic fields. In: Andersson H, van den Berg A: Lab-on-Chips for Cellomics. 2004. pp. 83-122, Kluwer Academic Publishers, Dordrecht. Eriksson E, Scrimgeour J, Graneli A, Ramser K, Wellander R, Enger J, Hanstrop D, Goksor M (2007): Optical manipulation and microfluidics for studies of single cell dynamics. J Opt aPure Appl Op 9 (8):S113-S121. Ernst O, Lieske A, Jaeger M, Lankenau A, Duschl C (2007): Control of cell detachment in a microfluidic device using a thermo-responsive copolymer on a gold substrate. Lab Chip 7 (10):1322-1329. Faley S, Seale K, Hughey J, Schaffer DK, VanCompernolle S, McKinney B, Baudenbacher F, Unutmaz D, Wikswo JP (2008): Microfluidic platform for real-time signaling analysis of multiple single T cells in parallel. Lab Chip 8 (10):1700-1712. Farokhzad OC, Cheng JJ, Teply BA, Sherifi I, Jon S, Kantoff PW, Richie JP, Langer R (2006): Targeted nanoparticle-aptamer bioconjugates for cancer chemotherapy in vivo. Proc Natl Acad Sci U S A 103 (16):6315-6320. Farokhzad OC, Khademhosseini A, Yon SY, Hermann A, Cheng JJ, Chin C, Kiselyuk A, Teply B, Eng G, Langer R (2005): Microfluidic system for studying nanoparticles and microparticles the interaction of with cells. Anal Chem 77 (17):5453-5459. Feske S, Giltnane J, Dolmetsch R, Staudt LM, Rao A (2001): Gene regulation mediated by calcium signals in T lymphocytes. Nat Immunol 2 (4):316-324. Folch A, Toner M (2000): Microengineering of cellular interactions. Annu Rev Biomed Eng 2: 227256. 99
8 References
¯¯¯¯¯¯¯¯¯¯¯¯¯¯¯¯¯¯¯¯¯¯¯¯¯¯¯¯¯¯¯¯¯¯¯¯¯¯¯¯¯¯¯¯¯¯¯¯¯¯¯¯¯¯¯¯¯¯¯¯¯¯¯¯¯¯¯¯¯¯¯¯¯ Foletta VC, Segal DH, Cohen DR (1998): Transcriptional regulation in the immune system: all roads lead to AP-1. J Leukoc Biol 63 (2):139-152. Fraser SP, Diss JK, Lloyd LJ, Pani F, Chioni AM, George AJ, Djamgoz MB (2004): T-lymphocyte invasiveness: control by voltage-gated Na+ channel activity. FEBS Lett 569 (1-3):191-194. Frauwirth KA, Thompson CB (2002): Activation and inhibition of lymphocytes by costimulation. J Clin Invest 109 (3):295-299. Friedl P, Gunzer M (2001): Interaction of T cells with APCs: the serial encounter model. Trends Immunol 22 (4):187-191. Fuhr G, Glasser H, Muller T, Schnelle T (1994): Cell manipulation and cultivation under a.c. electric field influence in highly conductive culture media. Biochim Biophys Acta 1201 (3):353360. Gallo EM, Cante-Barrett K, Crabtree GR (2006): Lymphocyte calcium signaling from membrane to nucleus. Nat Immunol 7 (1):25-32. Gimsa J, Haberland L: Electric and magnetic fields in cells and tissues. In: Bassani F, Liedl J, Wyder P: Encyclopedia of condensed matter physics. 2005. Vol. 2, pp. 6-14, Elsevier Ltd. Gimsa J, Marszalek P, Loewe U, Tsong TY (1991): Dielectrophoresis and electrorotation of neurospora slime and murine myeloma cells. Biophys J 60 (4):749-760. Glaser R: Biophysics. 1st ed., 2001. Springer Verlag, Berlin, Heidelberg. Glasser H, Fuhr G (1998): Cultivation of cells under strong ac-electric field - differentiation between heating and trans-membrane potential effects. Bioelectroch Bioener 47 (2):301-310. Grafton G, Thwaite L (2001): Calcium channels in lymphocytes. Immunology 104 (2):119-126. Grier DG (2003): A revolution in optical manipulation. Nature 424 (6950):810-816. Grynkiewicz G, Poenie M, Tsien RY (1985): A New Generation of Ca2+ Indicators with Greatly Improved Fluorescence Properties. J Biol Chem 260 (6):3440-3450. Hayashi T, Mo JH, Gong X, Rossetto C, Jang A, Beck L, Elliott GI, Kufareva I, Abagyan R, Broide DH, Lee J, Raz E (2007): 3-Hydroxyanthranilic acid inhibits PDK1 activation and suppresses experimental asthma by inducing T cell apoptosis. Proc Natl Acad Sci U S A 104 (47):18619-18624. Hellmich W, Greif D, Pelargus C, Anselmetti D, Ros A (2006): Improved native UV laser induced fluorescence detection for single cell analysis in poly(dimethylsiloxane) microfluidic devices. J Chromatogr A 1130 (2):195-200. Hellmich W, Pelargus C, Leffhalm K, Ros A, Anselmetti D (2005): Single cell manipulation, analytics, and label-free protein detection in microfluidic devices for systems nanobiology. Electrophoresis 26 (19):3689-3696. Hertz HM (1995): Standing-Wave Acoustic Trap for Nonintrusive Positioning of Microparticles. J Appl Phys 78 (8):4845-4849. Hiromoto S, Ziegler J, Yamamoto A (2008): Morphological change of fibroblast cells on titanium and platinum cultured at anodic and cathodic potentials. Zairyo-to-Kankyo 57 (9):400-408. Holdorf AD, Lee KH, Burack WR, Allen PM, Shaw AS (2002): Regulation of Lck activity by CD4 and CD28 in the immunological synapse. Nat Immunol 3 (3):259-264. Hong JW, Studer V, Hang G, Anderson WF, Quake SR (2004): A nanoliter-scale nucleic acid processor with parallel architecture. Nat Biotechnol 22 (4):435-439. Huang Y, Wang XB, Becker FF, Gascoyne PR (1997): Introducing dielectrophoresis as a new force field for field-flow fractionation. Biophys J 73 (2):1118-1129.
100
8 References
¯¯¯¯¯¯¯¯¯¯¯¯¯¯¯¯¯¯¯¯¯¯¯¯¯¯¯¯¯¯¯¯¯¯¯¯¯¯¯¯¯¯¯¯¯¯¯¯¯¯¯¯¯¯¯¯¯¯¯¯¯¯¯¯¯¯¯¯¯¯¯¯¯ Hultstrom J, Manneberg O, Dopf K, Hertz HM, Brismar H, Wiklund M (2007): Proliferation and viability of adherent cells manipulated by standing-wave ultrasound in a microfluidic chip. Ultrasound Med Biol 33 (1):145-151. Hunt TP, Westervelt RM (2006): Dielectrophoresis tweezers for single cell manipulation. Biomed Microdevices 8 (3):227-230. Hutloff A, Dittrich AM, Beier KC, Eljaschewitsch B, Kraft R, Anagnostopoulos I, Kroczek RA (1999): ICOS is an inducible T-cell co-stimulator structurally and functionally related to CD28. Nature 397 (6716):263-266. Ionescu-Zanetti C, Shaw RM, Seo JG, Jan YN, Jan LY, Lee LP (2005): Mammalian electrophysiology on a microfluidic platform. Proc Natl Acad Sci U S A 102 (26):9112-9117. Jaeger MS (2005): Über die Manipulation biogener und artifizieller Mikro- und Nanoobjekte in Mikroelektrodensystemen. PhD Thesis, Humboldt-Universität zu Berlin, Berlin. Jaeger MS, Muller T, Schnelle T (2007): Thermometry in dielectrophoresis chips for contact-free cell handling. J Phys D Appl Phys 40 (1):95-105. Jaeger MS, Uhlig K, Schnelle T, Muller T (2008): Contact-free single-cell cultivation by negative dielectrophoresis. J Phys D Appl Phys 41 (17):175502. Jager EWH, Immerstrand C, Peterson KH, Magnusson KE, Lundstrom I, Inganas O (2002): The cell clinic: Closable microvials for single cell studies. Biomed Microdevices 4 (3):177-187. Jendeberg L, Persson B, Andersson R, Karlsson R, Uhlen M, Nilsson B (1995): Kinetic-Analysis of the Interaction between Protein-a Domain Variants and Human Fc Using Plasmon Resonance Detection. J Mol Recognit 8 (4):270-278. Kentsch J, Durr M, Schnelle T, Gradl G, Muller T, Jaeger MS, Normann A, Stelzle M (2003): Microdevices for separation, accumulation, and analysis of biological micro- and nanoparticles. IEE Proc Nanobiotechnol 150 (2):82-89. Kern H, Klein-Vehne A, Pfennig A, Mueller T, Kauselmann G, Zevnik B, Gradl G: ElektraTM - a system for automated analysis and single cell isolation of embryonic stem cells. Annual Meeting of the International Society for Stem Cell Research (ISSCR), 2004, Boston, USA. Kim K, Liu XY, Zhang Y, Sun Y (2008): Nanonewton force-controlled manipulation of biological cells using a monolithic MEMS microgripper with two-axis force feedback. J Micromech Microeng 18 (5):055013. Kim S, Braunstein NS, Leonard EF, Thomas JL (2001): Controlling duration of contact between T cells and antigen-presenting cells. J Immunol Methods 249 (1-2):73-84. Kim YJ, Chung J, Lee HK, Yoon E: Microfluidic array chip for single-cell isolation using two-way pneumatic actuation. IEEE International Conference on Micro Electro Mechanical Systems, MEMS 2008, Tucson, Arizona, USA. Kortmann H, Chasanis P, Blank LM, Franzke J, Kenig EY, Schmid A (2009): The Envirostat - a new bioreactor concept. Lab Chip 9 (4):576-585. Kovacs B, Riley JL, Finkel TH (2005): Ligation of CD28 alone by its natural ligand, CD86, induces lipid raft polarization in human CD4 T-cells. Retrovirology 2 7848-7854. Lee H, Purdon AM, Westervelt RM (2004): Manipulation of biological cells using a microelectromagnet matrix. Appl Phys Lett 85 (6):1063-1065. Lee PJ, Hung PJ, Shaw R, Jan L, Lee LP (2005): Microfluidic application-specific integrated device for monitoring direct cell-cell communication via gap junctions between individual cell pairs. Appl Phys Lett 86 (22):223902. Lewis RS (2003): Calcium oscillations in T-cells: mechanisms and consequences for gene expression. Biochem Soc Trans 31: 925-929.
101
8 References
¯¯¯¯¯¯¯¯¯¯¯¯¯¯¯¯¯¯¯¯¯¯¯¯¯¯¯¯¯¯¯¯¯¯¯¯¯¯¯¯¯¯¯¯¯¯¯¯¯¯¯¯¯¯¯¯¯¯¯¯¯¯¯¯¯¯¯¯¯¯¯¯¯ Lewis RS (2001): Calcium signaling mechanisms in T lymphocytes. Annu Rev Immunol 19: 497521. Li J, Kleinstreuer C (2009): Microfluidics analysis of nanoparticle mixing in a microchannel system. Microfluid Nanofluid 6 (5):661-668. Li PC, Harrison DJ (1997): Transport, manipulation, and reaction of biological cells on-chip using electrokinetic effects. Anal Chem 69 (8):1564-1568. Lide DR: Handbook of chemistry and physics. 85th ed., 2004. CRC Press, Boca Raton, London, New York, Washington D.C. Lindquist S (1986): The heat-shock response. Annu Rev Biochem 55 1151-1191. Lomakina EB, Waugh RE (2004): Micromechanical tests of adhesion dynamics between neutrophils and immobilized ICAM-1. Biophys J 86 (2):1223-1233. Macian F (2005): NFAT proteins: key regulators of T-cell development and function. Nat Rev Immunol 5 (6):472-484. Markx GH (2008): The use of electric fields in tissue engineering: A review. Organogenesis 4 (1):11-17. Markx GH, Dyda PA, Pethig R (1996): Dielectrophoretic separation of bacteria using a conductivity gradient. J Biotechnol 51 (2):175-180. Maswiwat K, Wachner D, Gimsa J (2008): Effects of cell orientation and electric field frequency on the transmembrane potential induced in ellipsoidal cells. Bioelectrochemistry 74 (1):130141. Mietchen D, Schnelle T, Muller T, Hagedorn R, Fuhr G (2002): Automated dielectric single cell spectroscopy - temperature dependence of electrorotation. J Phys D Appl Phys 35 (11):12581270. Mittal N, Rosenthal A, Voldman J (2007): NDEP microwells for single-cell patterning in physiological media. Lab Chip 7 (9):1146-1153. Muller T, Pfennig A, Klein P, Gradl G, Jaeger M, Schnelle T (2003): The potential of dielectrophoresis for single-cell experiments. IEEE Eng Med Biol Mag 22 (6):51-61. Muller T, Schnelle T, Gradl G, Shirley SG, Fuhr G (2000): Microdevice for cell and particle separation using dielectrophoretic field-flow fractionation. J Liq Chromatography Rel Tech 23 (1):47-59. Negulescu PA, Shastri N, Cahalan MD (1994): Intracellular calcium dependence of gene expression in single T lymphocytes. Proc Natl Acad Sci U S A 91 (7):2873-2877. Neuman KC, Block SM (2004): Optical trapping. Rev Sci Instrum 75 (9):2787-2809. Nunes J, Klasen S, Franco MD, Lipcey C, Mawas C, Bagnasco M, Olive D (1993): Signaling through CD28 T Cell Activation Pathway Involves an Inositol Phospholipid-Specific Phospholipase-C Activity. Biochem J 293 835-842. Oddos S, Dunsby C, Purbhoo MA, Chauveau A, Owen DM, Neil MAA, Davis DM, French PMW (2008): High-Speed High-Resolution Imaging of Intercellular Immune Synapses Using Optical Tweezers. Biophys J 95 (10):L66-L68. Ong WL, Tang KC, Agarwal A, Nagarajan R, Luo LW, Yobas L (2007): Microfluidic integration of substantially round glass capillaries for lateral patch clamping on chip. Lab Chip 7 (10):1357-1366. Park HY, Qiu XY, Rhoades E, Korlach J, Kwok LW, Zipfel WR, Webb WW, Pollack L (2006): Achieving uniform mixing in a microfluidic device: Hydrodynamic focusing prior to mixing. Anal Chem 78 (13):4465-4473.
102
8 References
¯¯¯¯¯¯¯¯¯¯¯¯¯¯¯¯¯¯¯¯¯¯¯¯¯¯¯¯¯¯¯¯¯¯¯¯¯¯¯¯¯¯¯¯¯¯¯¯¯¯¯¯¯¯¯¯¯¯¯¯¯¯¯¯¯¯¯¯¯¯¯¯¯ Parry RV, Rumbley CA, Vandenberghe LH, June CH, Riley JL (2003): CD28 and inducible costimulatory protein Src homology 2 binding domains show distinct regulation of phosphatidylinositol 3-kinase, Bcl-x(L), and IL-2 expression in primary human CD4 T lymphocytes. J Immunol 171 (1):166-174. Patrick SM, Kim S, Braunstein NS, Thomas JL, Leonard EF (2000): Dependence of T cell activation on area of contact and density of a ligand-coated surface. J Immunol Methods 241 (12):97-108. Peng XY, Li PC (2004): A three-dimensional flow control concept for single-cell experiments on a microchip. 2. Fluorescein diacetate metabolism and calcium mobilization in a single yeast cell as stimulated by glucose and pH changes. Anal Chem 76 (18):5282-5292. Pohl HA: Dielectrophoresis. 1978. Cambridge University Press, Cambridge. Quintana A, Griesemer D, Schwarz EC, Hoth M (2005): Calcium-dependent activation of Tlymphocytes. Pflug Arch Eur J Phy 450 (1):1-12. Quintana A, Kummerow C, Junker C, Becherer U, Hoth M (2009): Morphological changes of T cells following formation of the immunological synapse modulate intracellular calcium signals. Cell Calcium 45 (2):109-122. Rachmilewitz J, Lanzavecchia A (2002): A temporal and spatial summation model for T-cell activation: signal integration and antigen decoding. Trends Immunol 23 (12):592-595. Ramos A, Morgan H, Green NG, Castellanos A (1998): Ac electrokinetics: a review of forces in microelectrode structures. J Phys D Appl Phys 31 (18):2338-2353. Reichle C, Sparbier K, Muller T, Schnelle T, Walden P, Fuhr G (2001): Combined laser tweezers and dielectric field cage for the analysis of receptor-ligand interactions on single cells. Electrophoresis 22 (2):272-282. Roman GT, Chen Y, Viberg P, Culbertson AH, Culbertson CT (2007): Single-cell manipulation and analysis using microfluidic devices. Anal Bioanal Chem 387 (1):9-12. Ros A, Hellmich W, Regtmeier J, Duong TT, Anselmetti D (2006): Bioanalysis in structured microfluidic systems. Electrophoresis 27 (13):2651-2658. Rosenthal A, Macdonald A, Voldman J (2007): Cell patterning chip for controlling the stem cell microenvironment. Biomaterials 28 (21):3208-3216. Sancho D, Gomez M, Sanchez-Madrid F (2005): CD69 is an immunoregulatory molecule induced following activation. Trends Immunol 26 (3):136-140. Schmitz B, Radbruch A, Kummel T, Wickenhauser C, Korb H, Hansmann ML, Thiele J, Fischer R (1994): Magnetic Activated Cell Sorting (Macs) - a New Immunomagnetic Method for Megakaryocytic Cell Isolation - Comparison of Different Separation Techniques. Eur J Haematol 52 (5):267-275. Schnelle T, Muller T, Fuhr G (1999): Dielectric single particle spectroscopy for measurement of dispersion. Med Biol Eng Comput 37 (2):264-271. Schwarz EC, Kummerow C, Wenning AS, Wagner K, Sappok A, Waggershauser K, Griesemer D, Strauss B, Wolfs MJ, Quintana A, Hoth M (2007): Calcium dependence of T cell proliferation following focal stimulation. Eur J Immunol 37 (10):2723-2733. Seger U (2006): Electrical cell manipulation in microfluidic systems. PhD Thesis, École Polytechnique Fédérale de Lausanne, Lausanne. Shi J, Mao X, Ahmed D, Colletti A, Huang TJ (2008): Focusing microparticles in a microfluidic channel with standing surface acoustic waves (SSAW). Lab Chip 8 (2):221-223. Sims CE, Allbritton NL (2007): Analysis of single mammalian cells on-chip. Lab Chip 7 (4):423440.
103
8 References
¯¯¯¯¯¯¯¯¯¯¯¯¯¯¯¯¯¯¯¯¯¯¯¯¯¯¯¯¯¯¯¯¯¯¯¯¯¯¯¯¯¯¯¯¯¯¯¯¯¯¯¯¯¯¯¯¯¯¯¯¯¯¯¯¯¯¯¯¯¯¯¯¯ Skelley AM, Kirak O, Suh H, Jaenisch R, Voldman J (2009): Microfluidic control of cell pairing and fusion. Nat Methods 6 (2):147-152. Smith-Garvin JE, Koretzky GA, Jordan MS (2009): T cell activation. Annu Rev Immunol 27 591619. Souid AK, Tacka KA, Galvan KA, Penefsky HS (2003): Immediate effects of anticancer drugs on mitochondrial oxygen consumption. Biochem Pharmacol 66 (6):977-987. Stokes L, Gordon J, Grafton G (2004): Non-voltage-gated L-type Ca2+ channels in human T cells Pharmacology and molecular characterization of the major alpha pore-forming and auxiliary beta-subunits. J Biol Chem 279 (19):19566-19573. Stryer L: Biochemie. 2. korr. Nachdruck, 1994. Spektrum Akademischer Verlag, Berlin, Heidelberg, Oxford. Takayama S, McDonald JC, Ostuni E, Liang MN, Kenis PJA, Ismagilov RF, Whitesides GM (1999): Patterning cells and their environments using multiple laminar fluid flows in capillary networks. Proc Natl Acad Sci U S A 96 (10):5545-5548. Takayama S, Ostuni E, LeDuc P, Naruse K, Ingber DE, Whitesides GM (2003): Selective chemical treatment of cellular microdomains using multiple laminar streams. Chem Biol 10 (2):123-130. Tan WH, Takeuchi S (2007): A trap-and-release integrated microfluidic system for dynamic microarray applications. P Natl Acad Sci USA 104 (4):1146-1151. Tanase M, Felton EJ, Gray DS, Hultgren A, Chen CS, Reich DH (2005): Assembly of multicellular constructs and microarrays of cells using magnetic nanowires. Lab Chip 5 (6):598-605. Tao ZM, Withers HG, Penefsky HS, Goodisman J, Souid AK (2006): Inhibition of cellular respiration by doxorubicin. Chem Res Toxicol 19 (8):1051-1058. Toriello NM, Douglas ES, Mathies RA (2005): Microfluidic device for electric field-driven singlecell capture and activation. Anal Chem 77 (21):6935-6941. van Lier RA, Brouwer M, Rebel VI, van Noesel CJ, Aarden LA (1989): Immobilized anti-CD3 monoclonal antibodies induce accessory cell-independent lymphokine production, proliferation and helper activity in human T lymphocytes. Immunology 68 (1):45-50. Viola A, Schroeder S, Sakakibara Y, Lanzavecchia A (1999): T lymphocyte costimulation mediated by reorganization of membrane microdomains. Science 283 (5402):680-682. Voldman J (2006a): Electrical forces for microscale cell manipulation. Annu Rev Biomed Eng 8 425-454. Voldman J (2006b): Engineered systems for the physical manipulation of single cells. Curr Opin Biotech 17 (5):532-537. Voskerician G, Shive MS, Shawgo RS, von Recum H, Anderson JM, Cima MJ, Langer R (2003): Biocompatibility and biofouling of MEMS drug delivery devices. Biomaterials 24 (11):19591967. Wang F, Wang H, Wang J, Wang HY, Rummel PL, Garimella SV, Lu C (2008): Microfluidic delivery of small molecules into mammalian cells based on hydrodynamic focusing. Biotechnol Bioeng 100 (1):150-158. Wang L, Flanagan LA, Jeon NL, Monuki E, Lee AP (2007): Dielectrophoresis switching with vertical sidewall electrodes for microfluidic flow cytometry. Lab Chip 7 (9):1114-1120. Weaver JC (2003): Electroporation of biological membranes from multicellular to nano scales. IEEE Trans Dielectr Electr Insul 10 (5):754-768. Weaver JC (2000): Electroporation of cells and tissues. IEEE Trans Plasma Sci 28 (1):24-33.
104
8 References
¯¯¯¯¯¯¯¯¯¯¯¯¯¯¯¯¯¯¯¯¯¯¯¯¯¯¯¯¯¯¯¯¯¯¯¯¯¯¯¯¯¯¯¯¯¯¯¯¯¯¯¯¯¯¯¯¯¯¯¯¯¯¯¯¯¯¯¯¯¯¯¯¯ Wei XB, Tromberg BJ, Cahalan MD (1999): Mapping the sensitivity of T cells with an optical trap: Polarity and minimal number of receptors for Ca2+ signaling. Proc Natl Acad Sci U S A 96 (15):8471-8476. Wheeler AR, Throndset WR, Whelan RJ, Leach AM, Zare RN, Liao YH, Farrell K, Manger ID, Daridon A (2003): Microfluidic device for single-cell analysis. Anal Chem 75 (14):3581-3586. Wiklund M, Gunther C, Lemor R, Jaeger M, Fuhr G, Hertz HM (2006): Ultrasonic standing wave manipulation technology integrated into a dielectrophoretic chip. Lab Chip 6 (12):1537-1544. Wiklund M, Toivonen J, Tirri M, Hanninen P, Hertz HM (2004): Ultrasonic enrichment of microspheres for ultrasensitive biomedical analysis in confocal laser-scanning fluorescence detection. J Appl Phys 96 (2):1242-1248. Winslow MM, Crabtree GR (2005): Decoding calcium signaling. Science 307 (5706):56-57. Wu ZG, Liu AQ, Hjort K (2007): Microfluidic continuous particle/cell separation via electroosmotic-flow-tuned hydrodynamic spreading. J Micromech Microeng 17 (10):19921999. Wulfing C, Rabinowitz JD, Beeson C, Sjaastad MD, McConnell HM, Davis MM (1997): Kinetics and extent of T cell activation as measured with the calcium signal. J Exp Med 185 (10):18151825. Xu G, Shao JY (2008): Human neutrophil surface protrusion under a point load: location independence and viscoelasticity. Am J Physiol-Cell Ph 295 (5):C1434-C1444. Xuan XC, Li DQ (2005): Focused electrophoretic motion and selected electrokinetic dispensing of particles and cells in cross-microchannels. Electrophoresis 26 (18):3552-3560. Yeon JH, Park JK (2005): Cytotoxicity test based on electrochemical impedance measurement of HepG2 cultured in microfabricated cell chip. Anal Biochem 341 (2):308-315. Yin ZZ, Noren D, Wang CJ, Hang R, Levchenko A (2008): Analysis of pairwise cell interactions using an integrated dielectrophoretic-microfluidic system. Mol Syst Biol 4: 232. Yu HM, Alexander CM, Beebe DJ (2007): Understanding microchannel culture: parameters involved in soluble factor signaling. Lab Chip 7 (6):726-730.
105
List of tables
¯¯¯¯¯¯¯¯¯¯¯¯¯¯¯¯¯¯¯¯¯¯¯¯¯¯¯¯¯¯¯¯¯¯¯¯¯¯¯¯¯¯¯¯¯¯¯¯¯¯¯¯¯¯¯¯¯¯¯¯¯¯¯¯¯¯¯¯¯¯¯¯¯
List of tables Tab. 4-1: Electric and hydrodynamic parameter configuration for the post-chip activation protocol. ................................................................................................................................... 42 Tab. 4-3: Electric and hydrodynamic parameter configuration for on-chip activation protocol. ... 42 Tab. 4-2: Electric and hydrodynamic parameter configuration for the correlation of short- and long term responses to the applied bead stimulus. ............................................................ 43 Tab. 4-4: Electric and hydrodynamic parameter configuration for analyzing the influence of DEP manipulation on the cell physiology.......................................................................... 44 Tab. 4-5: Electric and hydrodynamic parameter configuration for contacting mES cells with functionalized nanobeads. ......................................................................................... 44 Tab. 5-1: Amount of introduced liquid necessary for exchanging the channel medium ................ 59 Tab. 5-2: Thermodynamic characteristics for the interaction between anti-CD3 (mouse IgG1) and anti-CD28 (mouse IgG2a) with protein A. ................................................................. 74
List of figures Fig. 2-1: Objective targets of the present thesis............................................................................... 5 Fig. 3-1: Real part of the Clausius-Mossotti factor........................................................................ 10 Fig. 3-2: Microfluidic phenomena emerging from laminar flow conditions in a microchannel.... 16 Fig. 3-3: Signal transduction upon TCR engagement.................................................................... 19 Fig. 4-1: Design and function of the DEP chip.............................................................................. 27 Fig. 4-2: The tubing system ........................................................................................................... 27 Fig. 4-3: Experimental setup of the system. .................................................................................. 28 Fig. 4-4: Recovery of single cells after their deposition into microwells ...................................... 30 Fig. 4-5: Typical setup of an SPR experiment............................................................................... 33 Fig. 4-6: Preparation of a protein A-coated SPR sensor chip. ....................................................... 34 Fig. 4-7: Evaluation of the T cell vitality by brightfield and fluorescence microscopy ................ 37 Fig. 4-8: The ratiometric Ca2+ indicator Fura-2. ............................................................................ 38 Fig. 4-9: In vitro calibration of Fura-2........................................................................................... 39 Fig. 4-10: Configuration of the tubing system for different types of DEP chips............................. 41 Fig. 4-11: Temperature control of the microchannel. ...................................................................... 45 Fig. 5-1: Activation of primary T cells with APCs........................................................................ 48 Fig. 5-2: Activation of Jurkat T cells with antibodies against CD3 and CD28. ............................ 49 Fig. 5-3: Activation of Jurkat T cells with anti-CD3/anti-CD28-coated microbeads .................... 50 Fig. 5-4: Suitability of different medium compositions for single-cell cultivation ....................... 51 Fig. 5-5: Suitability of different culture plates for single-cell cultivation ..................................... 51
106
List of figures
¯¯¯¯¯¯¯¯¯¯¯¯¯¯¯¯¯¯¯¯¯¯¯¯¯¯¯¯¯¯¯¯¯¯¯¯¯¯¯¯¯¯¯¯¯¯¯¯¯¯¯¯¯¯¯¯¯¯¯¯¯¯¯¯¯¯¯¯¯¯¯¯¯ Fig. 5-6: Single-cell cultivation after a short-term incubation step in fresh culture medium ........ 52 Fig. 5-7: Chip design and microfluidic configuration ................................................................... 53 Fig. 5-8: Pair formation procedure ................................................................................................ 54 Fig. 5-9: Efficiency of single-cell isolation from the fluidic system ............................................. 55 Fig. 5-10: Biological analysis of the manipulated Jurkat T cells..................................................... 56 Fig. 5-11: On-chip activation protocol, analysis of vitality and activation state. ............................ 56 Fig. 5-12: Temperature control of the microchannel....................................................................... 57 Fig. 5-13: Live-cell staining on the DEP chip ................................................................................. 58 Fig. 5-14: Particle manipulation on the DEP chip for the analysis of the cytosolic Ca2+ level ....... 60 Fig. 5-15: Analysis of the bead-stimulated T cells after their isolation from the microfluidic system and over night incubation in a microwell .................................................................. 62 Fig. 5-16: Correlation of the short- and long-term responses to the applied bead stimulus ............ 63 Fig. 5-17: Influence of the Fura-loading on (A) the vitality and (B) the activation state of Jurkat T cells............................................................................................................................ 64 Fig. 5-18: Ca2+ signals after contact formation with antibody-coated and uncoated microbeads. .. 64 Fig. 5-19: Influence of the applied electrode voltage on the physiology of DEP-manipulated cells ................................................................................................................................... 65 Fig. 5-20: Impact of prolonged DEP manipulation on the vitality, activation- and proliferation states of Jurkat cells................................................................................................... 66 Fig. 5-21: Influence of the DEP manipulation on the cytosolic Ca2+ level of Jurkat T cells........... 67 Fig. 5-22: Cultivation of Jurkat T cells in different DEP chips ....................................................... 68 Fig. 5-23: Cultivation of L929 cells in DEP chips before and after outgassing. ............................. 69 Fig. 5-24: Cultivation of Jurkat T cells in degassed medium .......................................................... 70 Fig. 5-25: Cytosolic Ca2+ transients induced by antibodies that have desorbed from functionalized microbeads ................................................................................................................ 71 Fig. 5-26: T cell activation induced by antibodies desorbed from functionalized microbeads ....... 72 Fig. 5-27: T cell response behavior after exposition to low concentrations of anti-CD3/anti-CD28. ................................................................................................................................... 73 Fig. 5-28: Binding kinetics of the protein A - IgG interaction ........................................................ 74 Fig. 5-29: Quantification of the IgG dissociation from antibody-coated microbeads ..................... 77 Fig. 5-30: Clusters of primary T cells and APCs at the zigzag electrode........................................ 79 Fig. 5-31: Contact formation between stem cells and two types of somatic cells. .......................... 80 Fig. 5-32: Contact formation of mES cells with functionalized nanobeads. ................................... 81 Fig. 5-33: Analysis of cardiogenesis in LIF- BSA- or SPARC-exposed mES cells........................ 82 Fig. 6-1: Nutrient supply during the cultivation of single cells on-chip........................................ 89 Fig. 6-2: Quantification of the electric field experienced by the cells during DEP manipulation and its influence on the cellular membrane potential. ............................................... 91
107
List of abbreviations
¯¯¯¯¯¯¯¯¯¯¯¯¯¯¯¯¯¯¯¯¯¯¯¯¯¯¯¯¯¯¯¯¯¯¯¯¯¯¯¯¯¯¯¯¯¯¯¯¯¯¯¯¯¯¯¯¯¯¯¯¯¯¯¯¯¯¯¯¯¯¯¯¯
List of abbreviations AC ACF AP-1 APC ATP BSA CD CK1 CRAC CLSM CTL DAG DC DEP DMEM EDC EDTA EGTA EP ER FCS FITC FSDC Fura-2/AM GFP GSK3 HEPES HPLC hsps IgG IL-2 InsP3 ITAM ka KA kd KD kDa LAT LIF MAPK mES cells 108
alternating current area of contact formation Activator protein 1 antigen-presenting cell Adenosine triphosphate bovine serum albumin cluster of differentiation Casein kinase 1 Calcium release-activated calcium confocal laser scanning microscope cytotoxic T lymphocyte Diacylglycerol direct current dielectrophoresis Dulbecco's modified eagle medium 1-Ethyl-3-(3-dimethylaminopropyl)carbodiimide Ethylene diamine tetraacetic acid Ethylene glycol tetraacetic acid electrophoresis endoplasmic reticulum Fetal calf serum Fluorescein isothiocyanate fetal skin dendritic cell line Acetoxymethylester form of Fura-2 Green fluorescent protein Glycogen synthase kinase 3 (4-(2-Hydroxyethyl)-1-piperazineethanesulfonic acid high-performance liquid chromatography Heat-shock proteins Immunglobuline G Interleukin 2 Inositol-1,4,5-trisphosphate Immunoreceptor tyrosine-based activation motifs association rate constant association equilibrium constant dissociation rate constant dissociation equilibrium constant kilodaltons linker for the activation of T cells leukemia inhibitory factor mitogen-activated protein kinase mouse embryonic stem cells
List of abbreviations
¯¯¯¯¯¯¯¯¯¯¯¯¯¯¯¯¯¯¯¯¯¯¯¯¯¯¯¯¯¯¯¯¯¯¯¯¯¯¯¯¯¯¯¯¯¯¯¯¯¯¯¯¯¯¯¯¯¯¯¯¯¯¯¯¯¯¯¯¯¯¯¯¯ MHC nDEP NFAT NF-κB NHS NLS OVA PBL PBS pDEP PDMS PHA PI3K PKC PLC PMA PSC PSLC PtdIns(4,5)P2 RT RU SPARC SPR TCR TGF TNF u.o.s UV ZAP70
major histocompatibility complex negative dielectrophoresis nuclear factor of activated T cells nuclear factor κB N-Hydroxysuccinimide nuclear localization signal Ovalbumine peripheral blood lymphocytes Phosphate-buffered saline positive dielectrophoresis Polydimethylsiloxane Phytohemagglutinin Phosphoinositide 3-kinase Protein kinase C Phospholipase C Phorbol myristate acetate proximal signaling complex pancreatic stellate-like cells Phosphatidylinositol-4,5-bisphosphate room temperature response units secreted protein, acidic and rich in cysteine surface plasmon resonance T cell receptor transforming growth factor tumor necrosis factor unless otherwise specified ultra violet ζ chain-associated protein kinase of 70 kDa
109
List of publications
¯¯¯¯¯¯¯¯¯¯¯¯¯¯¯¯¯¯¯¯¯¯¯¯¯¯¯¯¯¯¯¯¯¯¯¯¯¯¯¯¯¯¯¯¯¯¯¯¯¯¯¯¯¯¯¯¯¯¯¯¯¯¯¯¯¯¯¯¯¯¯¯¯
List of publications Journal articles Kirschbaum M, Jaeger MS, Schenkel T, Breinig T, Meyerhans A, Duschl C. (2008): T cell activation on a single-cell level in dielectrophoresis-based microfluidic devices. J. Chromatogr. A 1202: 83-89 Kirschbaum M, Jaeger MS, Duschl C. Correlating short-term Ca2+ responses with long-term protein expression after activation of single T cells. Lab Chip, submitted. Böttcher M, Jaeger MS, Kirschbaum M, Müller T, Schnelle T, Duschl C. (2008): Gravitationdriven stress-reduced cell handling. Anal. Bioanal. Chem. 390: 857-863
Poster and conference contributions Kirschbaum M, Jaeger MS, Duschl C: Surface-induced activation of single T cells in dielectrophoresis-based microfluidic chips. International Conference for Micro & Nanotechnologies for the Biosciences (NANOTECH-Montreux), Montreux, Switzerland, Nov 1719, 2008. Kirschbaum M, Jäger MS, Duschl C: Measurement of intracellular calcium responses of single cells in a Lab-on-chip environment. International Conference for Micro & Nanotechnologies for the Biosciences (NANOTECH-Montreux), Montreux, Switzerland, Nov 17-19, 2008. Kirschbaum M, Jaeger MS, Duschl C: Touchless collection and manipulation of single cells using a combination of microfluidics and dielectrophoretic fields. 22nd International Symposium on MicroScale Bioseparations & Methods for Systems Biology (msb), Berlin, Germany, March 9-13, 2008. Kirschbaum M, Jaeger MS, Duschl C: Surface-induced control of the development of single cells in microfluidic chips. Final meeting of the CellPROM integrated project of the 6th Framework Programme of the European Commission, Sulzbach, Germany, Feb 27-28, 2008. Jaeger MS, Kirschbaum M, Duschl C: Custom-made microfluidic solutions for the gentle processing of small cell numbers. Nanosensors For Industrial Applications (NANOSENS), Vienna, Austria, Sept 29-30, 2008. Jaeger MS, Boettcher M, Felten M, Kirschbaum M, Marschner C, Duschl C: Dielectrophoresis and microfluidics: Key methods for the manipulation of biological objects ranging from nanoparticles to cells. IMAPS / ACerS 4th International Conference and Exhibition on Ceramic Interconnect and Ceramic Microsystems Technologies (CICMT), Munich, Germany, Apr 21-24, 2008.
110
Appendix
¯¯¯¯¯¯¯¯¯¯¯¯¯¯¯¯¯¯¯¯¯¯¯¯¯¯¯¯¯¯¯¯¯¯¯¯¯¯¯¯¯¯¯¯¯¯¯¯¯¯¯¯¯¯¯¯¯¯¯¯¯¯¯¯¯¯¯¯¯¯¯¯¯
Appendix A1
Cell culture media
Cell culture medium: RPMI 1640, w/o phenol red; HEPES, 25 mM; L-analyl-L-glutamine, 2 mM; Gentamycin, 0.1 mg ml-1; FCS (standard), 10% Conditioned medium: mM Sodium pyruvate
Cell culture medium, 1 part; Jurkat cell culture supernatant, 2 parts; 1
L929 Medium: DMEM, high glucose; Gentamycin, 0.1 mg ml-1; FCS (standard), 10% GIL Medium: RPMI 1640, w/o phenol red; HEPES, 25 mM; L-analyl-L-glutamine, 2 mM; 2Mercaptoethanol, 50 µM; Penicillin/Streptomycin, (100 U / 0.1 mg ml-1); FCS (standard), 10% GIL Medium 60/30: pyruvate, 1 mM
GIL Medium, 1 part; FSDC cell culture supernatant, 2 parts; Sodium
Stem cell medium: Knockout DMEM; L-Glutamin (not stabilized), 2 mM; Non-essential amino acids, 1%; 2-Mercaptoethanol, 100 µM; FCS (embryonic stem cell-screened), 10% Stem cell medium+LIF: Knockout DMEM; L-Glutamin (not stabilized), 2 mM; Non-essential amino acids, 1%; 2-Mercaptoethanol, 100 µM; LIF, 100 U ml-1; Gentamycin, 0.1 mg ml-1; FCS (embryonic stem cell-screened), 10%
A2
Buffers and Solutions
Acetate buffer, adjusted with NaOH to pH 4.5: H2O; Acetic acid, 10 mM EDC/NHS: PBS/EDTA: PBS/T:
A3
H2O; EDC, 400 mM; NHC, 100 mM PBS; EDTA, 2 mM
PBS (sterile filtered); Tween20, 0.005%
Chemicals
2-Mercaptoethanol Acetic acid Anti-CD28 Anti-CD3 Anti-CD69-Alexa 488 Anti-CD69-FITC Anti-CD69-PE BSA DMEM, high glucose EDC EDTA Ethanolamine FCS (embryonic stem cell-screened) FCS (standard) Fura-2/AM
M7154 34255 854.220.000 854.010.000 310916 347823 553237 T844.2 41965 39391 E6758 A2161 SH30070 S0115-314G F1225
Sigma-Aldrich, Germany Sigma-Aldrich, Germany Tepnel Diaclone, France Tepnel Diaclone, France Biolegend, USA BD Biosciences, USA BD Biosciences, USA Carl Roth, Germany Invitrogen Gibco, Germany Sigma-Aldrich, Germany Sigma-Aldrich, Germany AppliChem, Germany Thermo Fisher Hyclone, USA Biochrom, Germany Invitrogen Molecular Probes, Germany 111
Appendix
¯¯¯¯¯¯¯¯¯¯¯¯¯¯¯¯¯¯¯¯¯¯¯¯¯¯¯¯¯¯¯¯¯¯¯¯¯¯¯¯¯¯¯¯¯¯¯¯¯¯¯¯¯¯¯¯¯¯¯¯¯¯¯¯¯¯¯¯¯¯¯¯¯ Gelatin Genatamycin HCl HEPES Knockout-DMEM L-analyl-L-glutamine L-Glutamin (not stabilized) LIF NaOH NHC Non-essential amino acids OVA peptide257-264 PBS Penicillin/Streptomycin Protein A RPMI 1640 Sodium pyruvate Trypsin/EDTA 0.05% Trypsin/EDTA 0.25% Tween20
A4
Consumables
Microplates Standard 96 well plates Glass bottom plates SPR sensor chip Protein A beads (A) Protein A beads (B) 200 nm-beads, coated SPARC, LIF or BSA Laboratory film Petri dish Culture flask
112
48720 Sigma-Aldrich Fluka, Germany A2712 Biochrom, Germany 35327 Sigma-Aldrich Fluka, Germany L1613 Biochrom, Germany 10829.018 Invitrogen, Germany K0302 Biochrom, Germany K0282 Biochrom, Germany ESG1107 Millipore, USA 35274 Sigma-Aldrich Fluka, Germany 56480 Sigma-Aldrich Fluka, Germany K0293 Biochrom, Germany Kindly provided by G. Dadaglio, PhD, Institut Pasteur, Paris, France L1825 Biochrom, Germany A2213 Biochrom, Germany 593202 Merck Calbiochem, Germany F1275 Biochrom, Germany L0473 Biochrom, Germany L2143 Biochrom, Germany L2163 Biochrom, Germany Ferak, Germany
353219 BD Falcon, USA 655180 Greiner Bio-One, Germany 655892 Greiner Bio-One, Germany 11204 Ssens, Netherlands PPs 10.0 PA G.Kisker, Germany 0120104 Micromod, Germany with Kindly provided by R. Strehlow, Fraunhofer IBMT, Potsdam, Germany Parafilm M Alcan Packaging, USA 93100 TPP, Switzerland 90026/90076 TPP, Switzerland
Appendix
¯¯¯¯¯¯¯¯¯¯¯¯¯¯¯¯¯¯¯¯¯¯¯¯¯¯¯¯¯¯¯¯¯¯¯¯¯¯¯¯¯¯¯¯¯¯¯¯¯¯¯¯¯¯¯¯¯¯¯¯¯¯¯¯¯¯¯¯¯¯¯¯¯
A5
Cells
Jurkat T cells, Clone E6-1 FSDC cells E14Tg2A cells Neuro-2a cells OT-I cells PBL PSLC cells
A6
TIB-152 LGC Standards, UK Kindly provided by G. Dadaglio, PhD, Institut Pasteur, Paris, France Kindly provided by Prof. L. Leyns, Vrije Universiteit Brussel, Belgium Kindly provided by C. Brose, Fraunhofer IBMT, St. Ingbert, Germany Kindly provided by G. Dadaglio, PhD, Institut Pasteur, Paris, France Kindly provided by Prof. A. Meyerhans, Universität des Saarlandes, Germany Kindly provided by D. Rapoport, PhD, Fraunhofer IBMT, Lübeck, Germany
Hardware
DEP chips SPR biosensor Ultrasonic bath Fluorescence microscope Fiber-optics illuminator Infrared camera Objective heater Syringe pumps 40 × water immersion objective 60 × oil immersion objective Radio frequency generator CLSM Centrifuge Microcentrifuge Micro-volume syringes 25 µl Syringes 50 µl Syringes HPLC tubing Valves (L-type) Valves (T-type) Septa Electronic shutter
CeProm series Biacore T100 Sonorex Super 10P Cell^R KL1500 Pyroview 380 SP230IWZ UAPO40XW3/340 PLAPON60XO Cytocon 400 LSM510 meta Sigma 3K12 5415D 2600401 2624515 2624615 1527 1120 1121 27096-U Oriel 76993/76995
GeSiM, Germany GE Healthcare, USA Bandelin, Germany Olympus, Germany Schott, Germany DIAS Infrared, Germany Bioptechs, USA WPI, USA Olympus, Germany Olympus, Germany Evotec, Germany Zeiss, Germany B.Braun, Germany Eppendorf, Germany ILS, Germany ILS, Germany ILS, Germany Upchurch scientific, USA Bio-Chem fluidics, USA Bio-Chem fluidics, USA Sigma-Aldrich Supelco, Germany Newport, USA
113
Appendix
¯¯¯¯¯¯¯¯¯¯¯¯¯¯¯¯¯¯¯¯¯¯¯¯¯¯¯¯¯¯¯¯¯¯¯¯¯¯¯¯¯¯¯¯¯¯¯¯¯¯¯¯¯¯¯¯¯¯¯¯¯¯¯¯¯¯¯¯¯¯¯¯¯
A7
Lebenslauf
Persönliche Daten Name
Michael Kirschbaum
Geburtsdatum
2. März 1978
Geburtsort
Freiburg im Breisgau
Familienstand
ledig
Staatsangehörigkeit
deutsch
Ausbildung 06/1997
Abitur, Martin-Niemöller-Schule, Wiesbaden
10/1999 - 04/2004
Studium der Biologie an der Eberhard-Karls-Universität, Tübingen
11/2001
Vordiplomprüfung Biologie
06/2004 - 03/2005
Diplomarbeit am NMI Naturwissenschaftliches und Medizinisches Institut an der Universität Tübingen, Reutlingen: Elektrische und pharmakologische Stimulation zur Freisetzung von Opioiden aus gentechnisch veränderten Neuro-2a Zellen
03/2005
Diplom Hauptprüfung Biologie
03/2006
Beginn der Promotionsarbeit am Fraunhofer-Institut für Biomedizinische Technik IBMT, Potsdam: A microfluidic approach for the initiation and investigation of surfacemediated signal transduction processes on a single-cell level
Beschäftigungsverhältnisse 05/2001 - 07/2003
Tätigkeit als Lehrbeauftragter für das Schulfach Mathematik im Studienkreis, Tübingen
05/2002 - 10/2003
Wissenschaftliche Hilfskraft am Max-Planck-Institut für Biologische Kybernetik, Tübingen
06/2004 – 02/2005
Wissenschaftliche Hilfskraft am NMI Naturwissenschaftliches und Medizinisches Institut an der Universität Tübingen, Reutlingen
10/2005 - 02/2006
Praktikant und Werkstudent am CeDiS Center für Digitale Systeme, Freie Universität, Berlin
seit 03/2006
Wissenschaftlicher Mitarbeiter am Fraunhofer-Institut für Biomedizinische Technik IBMT, Potsdam
114