uncertainty in the data, and demonstrates that high-level design ... Buy back fraction. Fraction of the ... Allocated buy back cost (per as- ... blies returned for recovery that are ...... A final decision on the best strategy requires a more detailed.
IEEE TRANSACTIONS ON ELECTRONICS PACKAGING MANUFACTURING, VOL. 22, NO. 2, APRIL 1999
105
A Model for Optimizing the Assembly and Disassembly of Electronic Systems Peter A. Sandborn, Member, IEEE, and Cynthia F. Murphy
Abstract—This paper presents a methodology that incorporates simultaneous consideration of economic and environmental merit during the virtual prototyping phase of electronic product design. A model that allows optimization of a product life cycle, which includes primary assembly, disassembly, and secondary assembly using a mix of new and salvaged components, is described. Optimizing this particular life cycle scenario is important for products that are leased to customers or subject to product take-back laws. Monte Carlo simulation is used to account for uncertainty in the data, and demonstrates that high-level design and process decisions may be made with a few basic metrics and without highly specific data sets for every material and component used in a product. A web-based software tool has been developed that implements this methodology. Index Terms— Design-for-environment, design-to-cost, disassembly, electronics product take-back, end of life, recycling, virtual prototyping.
NOMENCLATURE Quantities associated with specific process steps and the entire unit assembly: Buy back fraction Fraction of the primary assembly cost paid to reacquire primary assemblies for recovery (per assembly). Cost of performing a single assemCost bly process step (per unit assembly). Allocated buy back cost (per asCost sembly). Cumulative cost of all preceding Cost assembly and test steps (per unit assembly). Cost of manufacturing the primary Cost assembly (per unit assembly). Cost of performing a single test Cost step (per unit assembly). Fraction returned Fraction of the primary unit assemblies returned for recovery that are salvageable.
Manuscript received August 31, 1998; revised February 5, 1999. P. A. Sandborn is with CALCE Electronic Products and Systems Center, University of Maryland, College Park, MD 20742 USA. C. F. Murphy is with Microelectronics and Computer Technology Corporation (MCC), Austin, TX 78759 USA. Publisher Item Identifier S 1521-334X(99)05845-0.
Number of primary unit assemblies Number of secondary unit assemblies
Total number of primary unit assemblies to be manufactured.
Total number of secondary unit assemblies to be manufactured. Fraction of unit assemblies that are Pass fraction passed by a test step. Cumulative probability of defects Quality not being introduced to the unit assembly as a result of all preceding assembly steps. Probability that the unit assembly Quality is not defective at the conclusion of an assembly step. Fraction of unit assemblies enScrap tering the th test step that are scrapped by the th test step. Cumulative fraction of the unit asScrapCum semblies that started the assembly process that have been scrapped after the th test step. Secondary build ratio Ratio of secondary to primary unit assemblies manufactured. Test effectiveness Probability of a test step accurately identifying a defect in a part or unit assembly. Cumulative material used by all Used preceding process steps (per unit assembly). Material used by one assembly step Used (per unit assembly). Total material wasted after a test Waste step (per unit assembly). Total material wasted prior to a test Waste step (per unit assembly). Material wasted by one assembly Waste step (per unit assembly). Quantities associated with specific parts (components/subcomponents of the unit assembly): Cost of attaching a single instance Cost of a part. Cost of a single instance of a new Cost (not salvaged) part. Cost of testing a single instance Cost of a part.
1521–334X/99$10.00 1999 IEEE
106
CostAvg
CostAvg
Defects
Pass fraction Quality
Quality
Quality Quality
Quality
QualityAvg
QualityAvg
Quantity
Used Used UsedAvg
Waste Waste WasteAvg
IEEE TRANSACTIONS ON ELECTRONICS PACKAGING MANUFACTURING, VOL. 22, NO. 2, APRIL 1999
Average cost per single instance of a part (combination of new and salvaged parts). Average cost per single instance of a part recovered from salvaged unit assemblies. Probability of a defect occurring when attaching a single instance of a part to the assembly. Fraction of parts in the secondary assembly that came from salvaged primary assemblies. Fraction of salvaged parts that are passed by a test step. Probability that the current disassembly step does not produce a defect in the part being removed. Cumulative probability of defects not being introduced to a part at each of the preceding assembly steps. Probability that a new part is not defective. Probability that a component is not defective after primary life, prior to disassembly. Probability that a component is not defective after primary life, prior to disassembly. Average probability that a part is not defective (combination of new and salvaged parts). Average probability that a part recovered from a primary assembly and retested is not defective. Quantity (number of instances) of a specific part assembled by an assembly step. Material used when attaching one instance of a part. Material used when fabricating one instance of a part. Average material used when including one instance of a part in the unit assembly. Material wasted when attaching one instance of a part. Material wasted when fabricating one instance of a part. Average material wasted when including one instance of a part in the unit assembly.
1 These quantities are the effective quantities per part, averaged over a large number of parts. New and salvaged parts are assumed to be tested to the same quality level.
I. INTRODUCTION
M
OST products are optimized for manufacturability, and costs are minimized under the assumption of only a single or “primary” life. When the primary life of the product is over, the original equipment manufacturer (OEM) of the product is rarely involved with the product again. With the advent of more stringent product take-back laws in Europe and those on the horizon in the United States [1], OEM’s of many products are being forced to contend with a significant percentage of the products being returned to the OEM at the end of the product’s primary life. OEM’s also contend with the return of products when the product is leased to the customer for a finite period of time. Under these circumstances, the OEM must consider the cost associated with end of life (EOL) scenarios when performing design tradeoffs and considering the product’s life cycle costs. Possible EOL scenarios include resale, remanufacturing, recycling, disposal, and refurbishing. An increasing number of products are being designed with the secondary lives taken into account, e.g., photocopiers [2], telephones, video cassettes recorders, and televisions [3]. For the purposes of the analysis presented here, a secondary life is considered to be the reuse of some or all of the components in the primary assembly to build a second identical product; any of the primary components that are not reused in the secondary assembly are disposed of. The universal application of this approach, not considered in this paper, is the reuse of components in many products including identical, similar, or perhaps significantly different products. The challenge is to determine, on an application specific basis, what subset of components should be reused and what subset should be disposed of in order to minimize system costs. Several interdependent issues must be considered to properly determine the optimum component reuse scenario, including assembly costs, disassembly costs; defects introduced in the assembly, disassembly, and primary life use of the product; and the waste stream associated with the life cycle. Two bodies of existing work are relevant to this paper. The first focuses on cost modeling associated with EOL strategies and the second is aimed at production planning and inventory control. EOL strategies that involve disassembly have been modeled many different ways. Approaches include, “scorecards” [4]; life cycle assessment (LCA) [5]; cost-benefit analysis [6]; activity-based costing (ABC) [7]; decision trees [8]; and high-level financial models [9]. An excellent review of disassembly analysis methods appears in [4]. All of these approaches have merit and have been successfully demonstrated. With the exception of financial models, these methods are usually applied to the disassembly process in isolation, i.e., no attempt is made to concurrently model the primary assembly and the EOL approach to optimize over a broader portion of the product life cycle. In the case of financial models, the entire life cycle is modeled, however, the assembly, disassembly, and testing costs are often characterized as single values, and the models do not include a treatment of specific component yields or address how the component yields are modified by primary use or disassembly processes.
SANDBORN AND MURPHY: OPTIMIZING THE ASSEMBLY AND DISASSEMBLY OF ELECTRONIC SYSTEMS
107
TABLE I INPUTS TO THE MODEL
The second class of existing work falls at the opposite end of the spectrum from the EOL cost models summarized above. These models treat the broader product life cycle, but at the expense of application-specific manufacturing and disassembly details. Several authors have developed rigorous models for production/inventory systems that include remanufacturing and disposal, for examples see [10] and [11]. The relevant concepts included in these efforts are their concurrent treatment of primary product manufacturing and remanufacturing, and the inclusion of production issues such as inventory levels, ordering information, time value of money, and lead time. In the model presented in this paper, actual process models that automatically adapt to changes in component mix and component yields are used for assembly and disassembly modeling. In addition, material use and waste inventories are generated as a result of the process models. The model in this paper also optimizes over the entire primary assembly, disassembly, and secondary assembly life cycle. The objective of the model presented herein is similar to the work presented in [3]; however, this model is specifically designed to optimize component selection. We suggest that the work presented in this paper provides application-specific manufacturing cost, yield, and waste input to the existing high-level financial and cost-benefit models for “remanufacture” EOL scenarios, or as the core of a production/inventory model. The methodology and model presented in this paper are targeted for use during “virtual prototyping” of electronic products. Virtual prototyping takes place at the earliest phases of the system design, prior to the start of traditional CAD activities [12]. Virtual prototyping starts with requirements and constraints, and results in a system specification for how to build the system (bill of materials, technologies, design rules, and materials). One of the characteristics of the virtual prototyping phase of the design process is that detailed descriptive data about the product and the manufacturing processes associated with creating it are not well defined. To obtain meaningful results, we use a Monte Carlo modeling approach that accommodates the characterization of input data as probability distributions. As a result, the outputs
obtained from the models are also probability distributions. This approach allows us to draw valid design conclusions from uncertain design inputs.
II.
MODEL
The model used for this analysis considers four stages in the life cycle of a product: 1) material and component acquisition; 2) primary assembly and test of the product using all new parts; 3) return and disassembly of the product after primary use; 4) secondary assembly and test of an identical product using a mixture of salvaged and new parts. A. Formulation The basic inputs to the model are listed in Table I. The secondary assembly uses the same process inputs as the primary assembly process. The outputs of the model are cost, quality (yield), the amount of waste material generated, and the amount of material contained in the product. Standard accounting methods are used to accumulate cost and quality through the primary assembly processes. Test and/or inspection steps in the assembly processes are characterized by test efficiencies that account for test escapes (defective parts that are not identified during test). In addition, defects introduced to components, other than the component being disassembled, at each disassembly process step can be modeled. If, for example, one part is salvaged only by destroying another, the probability of introducing defects to the destroyed part during disassembly would be 100%. After completion of the disassembly process, components may either be disposed of, or salvaged and used in a secondary build of the product. The secondary assembly uses salvaged components supplemented with new components, the mix of which is driven by: 2 In this model, we assume that the test activities do not erroneously reject good parts.
108
IEEE TRANSACTIONS ON ELECTRONICS PACKAGING MANUFACTURING, VOL. 22, NO. 2, APRIL 1999
1) the ratio of the quantity of secondary products built to the number of original (primary) products built; 2) the fraction of the original product which is available for salvage; 3) the fraction of each individual component that are successfully salvaged during the disassembly process. The cost and quality associated with a primary or secondary component assembly step are given by the following relations. Assuming only one type of part is attached per process step, the cost of an assembly process step associated with a component is (Quantity)(Cost
Cost
CostAvg (1)
significantly and whose primary lives are multiple years. The fraction of salvaged parts that pass the test is given by pass fraction Quality Quality
(Cost (CostAvg
(2)
is the fraction of parts in the secondary assembly where is derived that came from salvaged primary assemblies below). In this model, the cost of a part salvaged from a recovered primary assembly and retested is only the cost of i.e., it does testing a single instance of the part Cost not contain a component cost. This is appropriate because, the cost of obtaining the entire used primary assembly from the customer and performing all required disassembly is used as the starting point for the secondary assembly process and contained within this cost is the cost of obtaining individual salvaged components. Note, even if the OEM purchases the components of interest back from an asset manager or broker, the broker sets the price of the salvaged component based on obtaining the whole assembly from the customer and performing the disassembly. The fraction of parts in the secondary assembly that come from salvaged primary assemblies is computed using fraction returned pass fraction secondary build ratio
(3)
Where “min” indicates that the smaller of the two quantities within the brackets in (3) is used. As denoted in (3), the value of is not allowed to exceed one, i.e., it is assumed that take back is not legislated, and therefore, products whose parts are not required for secondary assemblies are not bought back or disassembled. The ratio of secondary to primary builds is given by secondary build ratio number of secondary unit assemblies number of primary unit assemblies
(5)
where the interpretation of test effectiveness is the probability of the test or inspection activity successfully identifying a defect in a part. The assembly cost for the primary build is computed using only (1). Equations (1)–(5) are used to compute the cost of a process step that assembles a component to the system during the secondary build. The quality of the system after an assembly step is given by
being assembled in (1) The cost of the part CostAvg (primary assembly) or is given by (2) is either Cost for the secondary assembly CostAvg
Quality
Quality
QualityAvg Defects
(6)
During the primary assembly, the part quality QualityAvg is given by Quality the probability that a new component is not defective. During the secondary assembly, the part quality is given by Quality
QualityAvg
QualityAvg
(7)
The quality of a part salvaged from a recovered primary assembly and retested is given by QualityAvg Quality
Quality
Quality
(8)
We also have a need to accumulate materials that are part of the product and materials that are wasted during the fabrication and assembly processes. We inventory the materials in the product and the material wasted and normalize the inventory to a single product. The quantity of material used and wasted by a process step is given by Used Waste
Quantity UsedAvg Quantity WasteAvg
Used Waste
(9a) (9b)
The material added to the product for a part in (9a) is either (primary assembly) or is given by (10a) for the secondary assembly. Equation (10b) gives the analogous relations for material waste UsedAvg WasteAvg
Used Waste
(10a) (10b)
(4)
Note, unlike (2), (10) contains no second term multiplied by the fraction of salvaged parts. In (10), all materials used in, or
The formulations of (3) and (4) are most accurate for mature products with constant annual production or products with year), i.e., the approximations are short primary lives ( less accurate for products whose annual production rates vary
3 The quality predicted by (8) is higher than the quality intuitively found if the test effectiveness referred to the probability that defective parts are identified by the test, instead of the probability that defects are identified by the tests. Equation (8) is derived by accounting for the possibility that a defective part could have more than one defect, but that the identification of any defects, not necessarily all defects, is enough to scrap the part, see [13].
SANDBORN AND MURPHY: OPTIMIZING THE ASSEMBLY AND DISASSEMBLY OF ELECTRONIC SYSTEMS
wasted by, fabricating a salvaged part were already accounted for in the primary assembly the first time the part was acquired. Test operations during assembly have a unique effect on the cost, quality, and waste materials (they do not affect the materials used per assembly). The effective cost of a test step (per unit assembly) is given by Cost pass faction
Cost
Cost
(11)
is the cumulative cost of the assembly where up to but not including the test step. The pass fraction appears in the denominator of (11) so that all the money spent on assemblies that do not pass the test is properly reallocated over the assemblies that pass the test. The fraction of assemblies that are passed by a test operation is similar to (5) pass fraction Quality
(12)
The quality of assemblies passed by the test step is given by Quality
Quality
(13) Test steps do not modify the material content of the assembly, i.e., they neither add nor remove material from assemblies that they pass. However, since test steps scrap defective assemblies, the materials in the scrapped assemblies must be reallocated over the waste inventories associated with all the passed assemblies that continue through the process. The total waste per assembly is modified in the following way, Waste Waste Used
(14)
It is also useful to accumulate the fraction of assemblies that begin the assembly process that are scrapped by test steps throughout the process. The fraction of assemblies entering the th test step that are scrapped by the th test step is given by Scrap
pass fraction
(15)
The cumulative scrap after the th test step is given by ScrapCum
ScrapCum ScrapCum
Scrap (16)
ScrapCum represents the fraction of the assemblies that started the assembly process that have been scrapped after the th test step. The model is not presently designed to accommodate rework processes. A rework operation that followed a test step would repair some of the scrapped assemblies, resulting in a cost rebate and a reduction in the waste allocated to each assembly. Buy back cost is defined as the cost of obtaining the used primary assembly from the customer. It is a combination of possible payment to the customer and any administrative or handling costs required to obtain the primary assembly and return it to the factory. Two buy back options are presently
109
supported. The model will either assume that every primary assembly is repurchased, or that only the number of primary assemblies necessary to accommodate the desired number of secondary assemblies are repurchased. In the first case (all primaries repurchased), the allocated buy back cost per assembly is given by Cost
buy back fraction Cost secondary build ratio
(17a)
if only the minimum number of primary assemblies are repurchased Cost
buy back fraction Cost fraction returned
(17b)
is added to the disassembly cost associated with Cost a single primary assembly and used as the starting cost for a secondary assembly. The model, as currently constructed, assumes that the primary and secondary builds are identical products. While not shown or discussed here, the model could easily be restructured to accommodate a secondary build that produces a similar or a completely different product. B. Uncertainty Analysis The target for the model presented in this paper is the “virtual prototyping” of an electronic product or system. Virtual prototyping is performed at the earliest phases of the design process before detailed physical design (layout and routing) is done, and inputs are often little more than a bill of materials and packaging technology choices. Because minimal information is available at this point in the design, and the information that is available includes substantial uncertainties, a careful treatment of those uncertainties is necessary to obtain meaningful analysis results. In order to facilitate making design and process decisions with only a few basic metrics and without highly specific data input sets for every material and component used in a product, the present model treats uncertainties by allowing each input to the equations outlined in the previous section to be optionally represented as a probability distribution rather than a single fixed value. Supported distributions include normal, lognormal, triangular, and uniform. For example, in the case of the quality of an incoming part, experience with the supplier and the part suggests a most likely value for the incoming yield, but different shipments of parts may have yields that are slightly higher or lower. If distributed values are entered, a Monte Carlo analysis is performed. During the analysis, the model will randomly select values within the defined distributions for a specified number of samples, or as many samples as are necessary to meet a specified confidence level. A triangular distribution (Fig. 1) is included as an option because both the minimum and maximum values that can be produced by the distribution are controllable [14] (the analysis reported in [15] also used triangular distributions). This control is important when modeling inputs where it does not make sense to have any samples in a distribution that are less than zero (which applies to most of the quantities modeled in this paper) or greater than one (or 100%), which
110
IEEE TRANSACTIONS ON ELECTRONICS PACKAGING MANUFACTURING, VOL. 22, NO. 2, APRIL 1999
tool. Each output is potentially represented by a distribution like the one shown in Fig. 3.
III. EXAMPLE ANALYSIS
Fig. 1. Example triangular distribution that can be used to describe input data.
applies to all yield and quality values. Using another type of distribution (normal for example) to represent a yield with a most likely value of 98% would always result in some samples that have values greater than 100% causing the analysis results to be skewed. Alternatively, using a normal distribution and disallowing nonphysical sample values, results in effectively using a distribution that is not a valid probability distribution (i.e., the area under the distribution is not one). There are often known external constraints to the values as well, such as maximum allowable cost imposed by a purchasing department. For these reasons the triangular distribution is very useful. If one or more of the input values are defined as a probability distribution, one or more of the final metrics that describe the system will be a probability distribution rather than a single value. The width of the resulting distribution provides a measure of the sensitivity of the computed metric to the uncertainties in the data inputs. We chose to treat uncertainties using a Monte Carlo method because of its ease of application to our set of equations and its inherent generality. Other related efforts that use Monte Carlo approaches include uncertainty modeling associated with environmental performance scoring [15], and activity-based disassembly cost modeling [7]. Alternative approaches to treating uncertainties in input data have the advantage of being computationally faster, but are not as general; these approaches include embedding probabilistic distribution factors within the analysis [16]. C. Implementation The model was implemented as a web-based software tool using Java. The tool is designed to be accessed over Internet or Intranet connections. This allows for both internal and external sharing of data and information, such as between supplier and manufacturer. Several examples from the tool data input interface are shown in Fig. 2. A process, similar in construction to the one shown in Fig. 2(b), can be defined for disassembly. The disassembly process need not be related to the assembly process. The distributions for input data can be defined independently (i.e., each input can have its own unique distribution). Fig. 3 shows an example output from the analysis
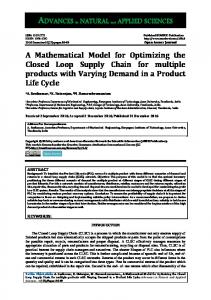
A flat panel display (FPD) was selected to demonstrate the methodology outlined in Section II; however, this methodology is not limited to this particular electronic product or even to electronic products in general. The implementation of the model presented in this paper is bounded by what is within the control of a single manufacturer, but the methodology (and model) could be expanded to capture the entire life cycle of the product. For the sake of simplicity, this example assumes that the only end of life (EOL) activity is reuse of components within an identical product design. In actual use, the model could be expanded to include other secondary products and other EOL processes, including materials recycling. A. Description A flat panel display (FPD) was selected for demonstrating this methodology for a number of reasons. First, it provides an opportunity to examine a product that is expected to increase dramatically in market share, but that has undergone relatively little EOL assessment. Second, the Microelectronics and Computer Technology Corporation (MCC) has conducted detailed studies of FPD’s, which provides a sound data foundation for this analysis [17]. Third, high intrinsic value of certain FPD components (e.g., IC devices and liquid-crystal display assemblies) make this a reasonable target for future efforts to recover value at EOL. A preliminary disassembly analysis of this FPD appeared in [18]. Component description and data was derived from an actual teardown of an FPD [17]. In the case of the FPD being analyzed, the bill of materials actually consists of well over 100 different parts. However, for the purpose of simplifying the analysis, the product was divided into 11 high-level components and the data combined to reflect those divisions. Portions of the FPD were grouped to capture components reflecting the sub-system level at which they might be purchased. These components or sub-components are typically simple to assemble and disassemble (using screws and clamps) and therefore might realistically be salvaged intact for reuse. If the analysis was focused on disassembly for recycling or for reuse in a completely different product, the components would be grouped differently. Fig. 4 illustrates the rough layout of the components used in this analysis. Fig. 5 is a photograph of the interior of the actual FPD. Table II shows the list of components used in the FPD assembly, with the most likely values for the four basic inputs used. The cost and composition (mass) of the components are likely to be known at the time of purchase. However, there may still be some fluctuation. These inputs were therefore entered with 10% triangular distributions. Although the analysis shown here lumps all materials together and gives a cumulative mass, in actual practice the amount of materials of interest would be inventoried separately.
SANDBORN AND MURPHY: OPTIMIZING THE ASSEMBLY AND DISASSEMBLY OF ELECTRONIC SYSTEMS
111
(a)
(b) Fig. 2. Example user interface for entering inputs into the modeling tool. (a) Component input table. The buttons (labeled with “T” for triangular distribution) are associated with the input field to their left. Pressing on these buttons provides the user with the option of including distribution data. (b) Assembly process input table.
The quality of the component may or may not be known. Typically a minimum quality will be specified by the supplier and a most likely value can be estimated by the manufacturer
given any prior experience with the product. In this analysis, the values given in Table II are entered as the most likely value (based on engineering knowledge for this general part
112
IEEE TRANSACTIONS ON ELECTRONICS PACKAGING MANUFACTURING, VOL. 22, NO. 2, APRIL 1999
Fig. 3. Example results output interface for the modeling tool. Distributions may be plotted for any of the result fields.
The waste generated in producing the product may or may not be known; even if it is documented, the data may not be made available from the supplier. Regardless, educated guesses can typically be made for different product families (injection-molded plastic, PWB’s, IC’s, etc.). The accuracy of these values will depend upon the type of data generally available and/or the ability to generate data using predictive models. For the analysis shown, the most likely value has been entered based on the type and mass of component (or parts of the component) and the triangular distribution is set at 25%. B. Primary Assembly Analysis
Fig. 4. Schematic layout of flat panel display (FPD) components used in this analysis.
type), with an upper bound of 100% and a lower bound that makes the distribution symmetric.
Consider only the primary assembly of the FPD first. Performing an analysis with the data described above (10 000 samples evaluated) gives the results shown in Table III. Table III shows that even when the values of waste for incoming components have up to a 25% error, the final result has a relatively low error ( 10% at the 95% confidence level). This is partially due to the use of values for process waste generation from within the company (i.e., during the assembly process) over which the manufacturer has control and for which there is high confidence data. While Table III is a useful illustration of data confidence, the model may also be used to optimize waste (or other metrics) when there are tradeoffs in selecting a particular component. For example, suppose a supplier offers a component with
SANDBORN AND MURPHY: OPTIMIZING THE ASSEMBLY AND DISASSEMBLY OF ELECTRONIC SYSTEMS
113
Fig. 5. Photograph of the flat panel display.
INPUTS
TABLE II FPD ANALYSIS
TO THE
TABLE III OUTPUTS THROUGH PRIMARY ASSEMBLY
lower incoming waste, but lower guaranteed quality. Since the lower quality will result in increased scrap, the designer might wish to determine the amount of component waste reduction required to achieve an overall waste reduction for the product. An example of this type of tradeoff analysis for the backlight
assembly portion of the FPD is presented in Fig. 6. Average incoming waste for the backlight assembly is plotted versus the cumulative FPD waste for two different quality levels. The graph shows that incoming waste for the backlight assembly must drop to less than 85% of the original backlight assembly
114
IEEE TRANSACTIONS ON ELECTRONICS PACKAGING MANUFACTURING, VOL. 22, NO. 2, APRIL 1999
TABLE IV HIGH QUALITY VERSUS LOW COST ASSEMBLY COMPARISON
Fig. 6. Cumulative FPD waste versus the incoming waste for the backlight assembly for two different backlight assembly incoming qualities.
(assuming a 99% to 95% change in incoming quality) in order to decrease the overall waste generation for the FPD. The model may also be used exclusively within the design and manufacturing environment. An example of two different assembly options is used to demonstrate this application. Assume that there are two assembly lines available. One costs an average of $1.50 per step (labor, equipment, and materials). The second costs an average of $3.00 per step but results in two orders of magnitude increase in quality (i.e., 100 ppm defects drops to 1 ppm). As in the example given in material and component acquisition, only the primary assembly is considered. A comparison of the two assembly lines appears in Table IV. In this case, three of the four metrics improved by going to the higher quality assembly, primarily because of decreased scrap. The outgoing quality increases slightly and the number of units that must begin production decreases by more than 5%. Although assembly costs increase by $15, the final cost of producing a flat panel decreases by $89. Total waste drops by 2% (less scrap from test steps). The material consumed does not change because the same amount of material is present in a “passed” assembly in both cases. C. Disassembly and Secondary Assembly Analysis The end-of-life scenario modeled in this paper is a combination of remanufacture and disposal that examines a secondary
build of the same FPD using components from the original build. After the primary units are repurchased or otherwise reacquired by the OEM at some fraction of the original cost (for this analysis assumed to be 5%), the product is disassembled. Since these particular components are fairly simply assembled with screws and clamps, the disassembly is assumed to be equally simple with an average cost of $1.50 per component and greater than 95% yields. It was also assumed that the individual components were in good working order at the time of return with 85% of the electronics functioning and 90% of the display components still usable. The ability to avoid using poor quality components in the secondary product, is reasonably good, with test efficiencies ranging from 80 to 90%. The ratio of secondary to primary builds is 0.25. Given the assumptions above, the four basic metrics were examined for both the primary and secondary build. The cost distributions at the 99% confidence level (3 ) indicate that there is a clear economic advantage to using reclaimed components. Assuming all the primary assemblies are repurchased, the average cost drops from $1972 per unit to $1727 per unit (Fig. 7), when buy back and disassembly costs are allocated to the secondary assemblies. The outgoing quality is approximately unchanged at 99.95%. Total cumulative waste is reduced from 12.7 to 2.2 kg and material consumed drops from 9.0 to 1.1 kg. It can be seen from this example that highly specific data and exact numbers may not be required for basic business decisions. Given the above assumptions and data distributions, it appears that salvage of components from this FPD is worth further consideration. In a real situation, finalization of the design and manufacturing strategy would require more detailed and specific data, but the initial analysis, gives the business unit reason to pursue a more detailed lifecycle assessment. One of the advantages of the methodology presented in this paper is the ability to perform sensitivity analyzes. In order to demonstrate this, the cost to build a flat panel display from salvaged parts is plotted against the buy-back cost [Fig. 8(a)]. Error bars (1 ) are also plotted. The results show that if buy back costs exceed 8% of the primary assembly cost (and all primary assemblies are repurchased), that a secondary assembly using salvaged parts is not economical. The economics of secondary assembly are considerably better if only enough primary assemblies are repurchased to satisfy the secondary assembly requirements (even with 20% buyback costs, the cost to build a refurbished FPD may be lower
SANDBORN AND MURPHY: OPTIMIZING THE ASSEMBLY AND DISASSEMBLY OF ELECTRONIC SYSTEMS
115
Fig. 7. Cost distributions for building a FPD from salvaged parts drops from $1972 to $1727, given the assumptions stated within the text. The distributions shown are for the 99% confidence level (3 � ). TABLE V COMPARISON OF DIFFERENT SALVAGE OPTIONS (MEAN AND STANDARD DEVIATIONS INCLUDED FOR EACH ENTRY)
than the cost to build the original). Fig. 8b shows results if primary and secondary assembly repurchase is mandatory (i.e., a legislated take back situation). In this case, we use the same analysis as shown in Fig. 8(a), but, the primary assembly repurchase cost is combined with the primary assembly, not with the secondary assembly (and an identical repurchase cost is combined with the secondary assembly as they must be taken back too). This figure shows that under forced take back conditions (imposed for both the primary and secondary assemblies), the buy back cost is irrelevant for determining the relative economics of secondary and primary assemblies (i.e., it is always more economical to manufacture secondary assemblies with the assumptions presented). The results presented above assume that all functional components, as listed in Table II, are salvaged and reused.
It is more likely that only the most expensive components (the electronics and/or the display and drivers) would actually be included in a secondary build. A comparison was made between these possible approaches and the results are given in Table V; (the results in Table V assume an equipment lease situation where all primary assemblies are repurchased and no secondary assemblies are repurchased). These outputs support the supposition that it may not be cost effective to reuse the mechanical components (only a slight decrease in secondary cost was realized when the mechanical parts were salvaged). Recycling of these materials might be a better option, which would lessen the impact on the material consumed, which is the only metric to be significantly affected (3.1 kg versus 1.1 kg). Reusing only the electronics appears to be the next most cost-effective approach, but unless the display and backlight assemblies are recycled there is a large
116
IEEE TRANSACTIONS ON ELECTRONICS PACKAGING MANUFACTURING, VOL. 22, NO. 2, APRIL 1999
(a)
(b) Fig. 8. Secondary assembly cost of the FPD versus the primary assembly buy back cost. Error bars represent 1 � . (a) primary assembly repurchase is optional, (b) primary and secondary assembly repurchase is mandatory.
negative impact in the amount of materials consumed (7.4 kg). A final decision on the best strategy requires a more detailed analysis, but this high level assessment highlights the areas of concern and indicates where more detailed data and process information are required. IV. CONCLUSION The approach presented in this paper is not intended to be as accurate as a full and detailed life-cycle assessment and should not be interpreted as a replacement for such. However, it does demonstrate the “80/20 rule,” which says that 80% accuracy can be obtained with 20% of the effort and data. It is
also a means of introducing nonenvironmental experts, such as those in the design and business community, to the inclusion of environmental merit into their decision making process. This methodology can be used to make high-level decisions and illustrates the point that a full life-cycle assessment is not necessarily needed for every product, nor does the product need to be defined in final detail. Cost is typically one of the best known or most easily estimated metrics. Unfortunately it is often not included in lifecycle assessments or DFE. Any uncertainty in the data inputs and corresponding error in the estimation can be captured by using Monte Carlo simulation. As seen in the example of the primary and secondary flat panel display builds, even with a 10% error for all inputs, the final error (at 2 or 95% confidence) is only $105 out of $1973 or 5% for the primary build and $124 out of $1727 or 7% for the secondary build. This metric is absolutely critical in the implementation of DFE into the business environment. As pointed out in [15], Monte Carlo analysis is not intended to model partial information or higher-order uncertainty, and therefore, does not take the place of critical model inputs that may not be known. However, the use of Monte Carlo analysis allows the analyst to bracket and understand the error and potential risk associated with not having detailed data. Minimum quality of incoming parts is typically specified by the supplier and maximum quality is theoretically always 100%. In order to use a triangular distribution and Monte Carlo simulation to account for error, the user needs only to estimate the most likely value for the quality of an incoming component or material. The quality of a process step must be calculated by combining the amount of production scrap for each component with the number of field failures. These two quantities can then be used to estimate test effectiveness. In the present analysis, test effectiveness is entered in order to predict scrap and field failures. The quality metric is expected to be most useful when making comparisons and tradeoffs, as in the assembly example. In these cases, relative values are often as valuable as absolute values for decision making. If sales of the product occur over a significant period of time (i.e., many months or years), then “time value of money” may be a relevant contributor to life cycle costs in tradeoff analyzes that consider product take back. Consider the following simple example: an OEM must either purchase all the parts to satisfy the entire production run for a product upfront before production begins, or gradually over time during production. In the up-front purchase case, the real cost to the OEM of the parts is the amount paid for the parts plus the “opportunity cost” associated with the up-front payment, i.e., the money to make the up-front payment was either borrowed at some interest rate and can not be repaid until the products are sold, or equivalently, the money for the up-front payment is wrapped up in products yet to be sold instead of in the bank earning interest. Whether interest is paid or interest is lost, the opportunity cost must be considered when computing the life cycle cost of the product. In the second case, the OEM may have to contend with inflation that increases the part cost over time. In both cases, remanufacturing leads to additional potential savings because it requires the purchase of a smaller
SANDBORN AND MURPHY: OPTIMIZING THE ASSEMBLY AND DISASSEMBLY OF ELECTRONIC SYSTEMS
117
inventory of parts, thus tying up less money in unsold products and/or creating less exposure to inflation effects. To properly treat the time value of money, a production/inventory model (e.g., [10] or [11]) that includes production volumes, and detailed time lines for primary and secondary manufacturing and product is necessary. This is an analysis which is outside the scope of the model presented here. Waste is typically the least characterized of the metrics presented in the model. For the purpose of demonstrating the methodology, all waste was lumped together. In an actual product design, it would be desirable to categorize the different types of waste, such as by disposal method. The amount of waste generated per product may often be inaccurate and potentially underestimated because it is common to combine waste for the entire facility. The analysis in this paper made high level assumptions about the amount of waste produced in manufacturing components of certain types. Development of more detailed data modules and/or predictive modules for electronic components will be critical for correctly accounting for this metric. Material use is of most interest when the inventory results are incorporated into an impact analysis. In this paper, the material use metric was kept very simple. As in the case of waste, more module and model development for electronic products is needed. However, as in the case of waste, there may be many high level decisions that can be made by simply tracking a small number of materials of interest or concern.
[7] B. A. Bras and J. Emblemev˚ag, “Activity-based costing and uncertainty in designing for the life-cycle,” in Design for X: Concurrent Engineering Imperatives, G. Huang, Ed. London, U.K.: Chapmann & Hall, 1996. [8] M. Simon, “Objective assessment of designs for recycling,” in Proc. 9th Int. Conf. Eng. Design, vol. 2, pp. 832–835, 1993. [9] M. K. Low, D. J. Williams, and C. Dixon, “Manufacturing products with end-of-life considerations: An economic assessment to the routes of revenue generation from mature products,” IEEE Trans. Comp., Packag., Manufact. Technol. C, vol. 21, pp. 4–10, Jan. 1998. [10] D. P. Heyman, “Optimal disposal policies for a single-item inventory system with returns,” Naval Res. Logist. Quart., vol. 24, pp. 385–405, Feb. 1977. [11] E. van der Laan and M. Solomon, “Production planning and inventory control with remanufacturing and disposal,” Eur. J. Oper. Res., vol. 102, pp. 264–278, 1997. [12] P. A. Sandborn and M. Vertal, “Analyzing packaging trade-offs during system design,” IEEE Design Test Comput., vol. 15, pp. 10–19, July–Sept. 1998. [13] T. W. Williams and N. C. Brown, “Defect level as a function of fault coverage,” IEEE Trans. Comput., vol. C-30, pp. 987–988, Dec. 1981. [14] C. F. Murphy, M. Abadir, and P. Sandborn, “Economic analysis of test and known good die or multichip assemblies,” J. Electron. Testing (JETTA), pp. 151–166, 1997. [15] E. Regnier and W. F. Hoffman III, “Uncertainty model for product environmental performance sorting,” in Proc. IEEE Int. Symp. Electron. Environ., 1998, pp. 207–212. [16] E. Zussman, A. Kriwet, and G. Seliger, “Disassembly-oriented assessment methodology to support design for recycling,” Annals Int. Inst. Prod. Eng. Res., vol. 43, no. 1, pp. 9–14, 1994. [17] R. Nolan, “MCC low cost portables report: MCC-DTA-025-96 (P),” Microelectron. Comput. Technol. Corp., 1996. [18] C. F. Murphy, C. Mizuki, and P. A. Sandborn, “Implementation of DFE in the electronics industry using simple metrics for cost, quality, and environmental merit,” in Proc. IEEE Int. Symp. Electron. Environ., 1998, pp. 219–224.
ACKNOWLEDGMENT
Peter A. Sandborn (M’87) received the B.S. degree in engineering physics from the University of Colorado, Boulder, in 1982, and the M.S. degree in electrical science and the Ph.D. degree in electrical engineering, both from the University of Michigan, Ann Arbor, in 1983 and 1987, respectively. He is an Associate Professor in the CALCE Electronic Products and Systems Center (EPSC), University of Maryland, College Park, where his interests include technology tradeoff analysis for electronic packaging, system life cycle and risk economics, hardware/software codesign, and design tool development. Prior to joining the University of Maryland, he was a founder and Chief Technical Officer of Savantage, Austin, TX, and a Senior Member of Technical Staff at the Microelectronics and Computer Technology Corporation, Austin. He is the author of over 50 technical publications and one book on multichip module design. Dr. Sandborn is an Associate Editor of the IEEE TRANSACTIONS ON ELECTRONICS PACKAGING MANUFACTURING.
The authors wish to thank C. Mizuki, G. Pitts, and P. Gilchrist, MCC, P. Spletter, Nu Thena Systems, and J. Smith, Battelle, for their useful discussions and contributions associated with this work, and the MCC Low Cost Portables Project for providing the details of the flat panel display used for the example analysis in this paper. REFERENCES [1] J. A. Stuart, M. K. Low, D. J. Williams, L. J. Turbini, and J. C. Ammons, “Challenges in determining electronics equipment take-back levels,” IEEE Trans. Comp., Packag., Manufact. Technol. C, vol. 21, pp. 225–232, July 1998. [2] V. Berko-Boateng, J. Azar, E. De Jong, and G. A. Yander, “Asset recycle management—A total approach to product design for the environment,” in Proc. IEEE Int. Symp. Electron. Environ., 1993, pp. 138–144. [3] J. A. Stuart, L. J. Turbini, and J. C. Chumley, “Investigation of electronic assembly design alternatives through production modeling of life cycle impacts, costs, and yield,” IEEE Trans. Comp., Packag., Manufact. Technol. C, vol. 20, pp. 317–326, Oct. 1997. [4] T. A. Hanft and E. Kroll, “Ease-of-disassembly evaluation in design for recycling,” in Design for X: Concurrent Engineering Imperatives, G. Q. Huang, Ed. London, U.K.: Chapman & Hall, 1996. [5] R. L. Tummala and B. E. Koenig, “Models for life cycle assessment of manufactured products,” in Proc. IEEE Int. Symp. Electron. Environ., 1994, pp. 94–99. [6] R. W. Chen, D. Navin-Chandra, and F. B. Prinz, “Cost-benefit analysis model of product design for recyclability and its application,” IEEE Trans. Comp., Packag., Manufact. Technol. A, vol. 17, pp. 502–507, Dec. 1994.
Cynthia F. Murphy received the B.S. degree in geology from the College of William and Mary, Williamsburg, VA and the M.S. degree in geology from the University of North Carolina, Chapel Hill. She is a Senior Member of Technical Staff and a Project Manager with the Environmental Programs Division, Microelectronics and Computer Technology Corporation (MCC), Austin TX. During her 11 years at MCC, she has worked in the areas of environmentally conscious manufacture of electronics and in a variety of technologies related to the manufacture of high performance electronics. Much of her focus has been on the economic analysis of electronics systems and she has authored and co-authored numerous papers in this area. In addition, she has worked in reliability and process assessment of multichip modules and their components. Prior to joining MCC, she was employed by Motorola in the Semiconductor Products Sector. She spent four years working as a Process Engineer and then as a Product Engineer. In both job functions her primary responsibilities centered on data collection and statistical analysis.