MNRAS 000, 1–21 (2015)
Preprint 25 December 2015
Compiled using MNRAS LATEX style file v3.0
arXiv:1510.05951v2 [astro-ph.GA] 24 Dec 2015
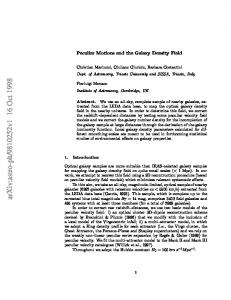
A multiwavelength view of the galaxy cluster Abell 523 and its peculiar diffuse radio source M. Girardi,1,2⋆ W. Boschin,3,4,5 F. Gastaldello,6,7 G. Giovannini,8,9 F. Govoni,10 M. Murgia,10 R. Barrena,4,5 S. Ettori,11,12 M. Trasatti,8,9 V. Vacca10,13 1
Dipartimento di Fisica, Universit` a degli Studi di Trieste, via Tiepolo 11, I-34143 Trieste, Italy Astronomico di Trieste, via Tiepolo 11, I-34143 Trieste, Italy 3 Fundaci´ on G. Galilei - INAF (Telescopio Nazionale Galileo), Rambla J. A. Fern´ andez P´ erez 7, E-38712 Bre˜ na Baja (La Palma), Spain 4 Instituto de Astrof´ ısica de Canarias, C/V´ıa L´ actea s/n, E-38205 La Laguna (Tenerife), Spain 5 Departamento de Astrof´ ısica, Univ. de La Laguna, Av. del Astrof´ısico Francisco S´ anchez s/n, E-38205 La Laguna (Tenerife), Spain 6 INAF-IASF Milano, Via Bassini 15, I-20133 Milano, Italy 7 Department of Physics and Astronomy, University of California at Irvine, 4129 Frederick Reines Hall, Irvine, CA 92697-4575, USA 8 Dipartimento di Fisica e Astronomia, Universit` a degli Studi di Bologna, via Ranzani 1, I-40127 Bologna, Italy 9 INAF-Osservatorio di Radioastronomia, via Gobetti 101, I-40129 Bologna, Italy 10 INAF-Osservatorio Astronomico di Cagliari, Via della Scienza 5, 09047 Selargius, Cagliari, Italy 11 INAF-Osservatorio Astronomico di Bologna, via Ranzani 1, 40127, Bologna, Italy 12 INFN - Sezione di Bologna, viale Berti Pichat 6/2, I-40127, Bologna, Italy 13 Max Planck Institute for Astrophysics, Karl-Schwarzschild-Str. 1, 85748 Garching, Germany 2 INAF-Osservatorio
Accepted XXX. Received YYY; in original form ZZZ
ABSTRACT
We study the structure of the galaxy cluster Abell 523 (A523) at z = 0.104 using new spectroscopic data for 132 galaxies acquired at the Telescopio Nazionale Galileo, new photometric data from the Isaac Newton Telescope, and X-ray and radio data from the Chandra and Very Large Array archives. We estimate the velocity dispersion −1 of the galaxy population, σV = 949+80 −60 km s , and the X-ray temperature of the hot intracluster medium, kT = 5.3 ± 0.3 keV. We infer that A523 is a massive system: M200 ∼ 7 − 9 ×10¹⁴ M⊙ . The analysis of the optical data confirms the presence of two subclusters, 0.75 Mpc apart, tracing the SSW-NNE direction and dominated by the two brightest cluster galaxies (BCG1 and BCG2). The X-ray surface brightness is strongly elongated towards the NNE direction, and its peak is clearly offset from both the BCGs. We confirm the presence of a 1.3 Mpc large radio halo, elongated in the ESE-WNW direction and perpendicular to the optical/X-ray elongation. We detect a significant radio/X-ray offset and radio polarization, two features which might be the result of a magnetic field energy spread on large spatial scales. A523 is found consistent with most scaling relations followed by clusters hosting radio haloes, but quite peculiar in the Pradio -LX relation: it is underluminous in the X-rays or overluminous in radio. A523 can be described as a binary head–on merger caught after a collision along the SSW-NNE direction. However, minor optical and radio features suggest a more complex cluster structure, with A523 forming at the crossing of two filaments along the SSW-NNE and ESE-WNW directions. Key words: galaxies: clusters: general – galaxies: clusters: individual: Abell 523 – galaxies: kinematics and dynamics – radio continuum: general– X-rays: galaxies: clusters.
1
⋆
E-mail:
[email protected]
c 2015 The Authors
INTRODUCTION
Clusters of galaxies are the largest gravitationally bound systems in the Universe, with typical masses of about 1014 1015 M⊙ . Clusters are formed by hierarchical formation pro-
2
M. Girardi et al.
cesses, where smaller units (galaxies, groups and small clusters) formed first and merged under gravitational pull to larger and larger units in the course of time, clusters forming at the intersection of filaments of the large scale structure of the Universe. Merging processes are the subject of multiwavelength studies (e.g., Feretti et al. 2002). Major cluster mergers are among the most energetic events in the Universe since the Big Bang (e.g., Sarazin 2002). An increasing number of galaxy clusters shows the presence of diffuse radio emission on Mpc scale (e.g., Feretti 2005; Ferrari 2008; Venturi 2011; Feretti et al. 2012). The synchrotron emission of these radio sources proves the existence of a large-scale magnetic field and relativistic particles spread out in the cluster. These extended diffuse radio sources are usually classified as relics and haloes, having quite different phenomenological properties (e.g., Giovannini & Feretti 2004; Feretti et al. 2012). For both types of sources, cluster mergers have been proposed as the process responsible for their origin (e.g., Trimble 1993; Feretti 1999; Brunetti & Jones 2015). This scenario is supported by an increasing amount of observational evidence (e.g., Schuecker et al. 2001; Buote 2002; Cassano et al. 2010; Rossetti et al. 2011; Girardi et al. 2011 and references therein). Relics are elongated sources, found at the cluster outskirts, with the major axis roughly perpendicular to the direction of the cluster merger (e.g., van Weeren et al. 2011a). When observed with high angular resolution, they generally show an asymmetric transverse profile, with a sharp edge usually on the side towards the cluster outer edge. These morphologies are in very good agreement with models predicting that these sources are related to large-scale shocks generated during cluster merger events (e.g., Enßlin et al. 1998; Br¨ uggen et al. 2011). Instead, radio haloes have rounder morphologies, are unpolarized and fill the central cluster regions occupied by the X-ray emitting ICM. A close similarity between the radio and the X-ray morphology has been found in a number of clusters hosting a radio halo (e.g., Govoni et al. 2001a). Radio haloes are probably related to turbulent motions of ICM due to merger events (e.g., Brunetti et al. 2009; Brunetti & Jones 2015). There are also diffuse radio emissions with peculiar properties, e.g., relic sources with a roundish structure (Feretti et al. 2006), the relic of 1RXS J0603.3+4214 with an unusual morphology (Ogrean et al. 2013), haloes having offsets between the radio and the X-ray peak (Govoni et. al. 2012). In addition, examples of bridges between relics and haloes have been observed in a few clusters (e.g., Coma cluster – Kim et al. 1989; Abell 2744 – Govoni et al. 2001a), and diffuse radio sources at large distances from a few clusters have been detected (e.g., Abell 2255 – Pizzo et al. 2008; Abell 2256 – van Weeren et al. 2009). An intriguing case is also that of the diffuse source 0809+39 (Brown & Rudnick 2009), where the southern component is possibly associated with an ∼5 Mpc long galaxy filament at z ∼0.04. The present paper is focused on the study of Abell 523 (hereafter A523). A523 hosts an extended and powerful diffuse emission with a maximum linear size of ∼ 1.3 h−1 70 Mpc and a total radio power of P1.4 GHz ∼ 1.5 1024 W/Hz, strongly elongated along the ESE-WNW direction (Giovannini et al. 2011, hereafter G11). G11 classified this radio source as a radio halo because of (i) the radio emission permeates both the merging clumps and (ii) the elongated
structure does not show any morphological feature typical of radio relics such as high brightness filamentary structures or a transverse flux asymmetry (see e.g., van Weeren et al. 2011b). However, the A523 radio halo phenomenology is far from the typical one. In fact, (i) the radio halo is strongly elongated in the direction perpendicular to the likely merging axis (see fig. 3 of G11 and our Fig. 1), while, generally, the opposite phenomenology is observed, with the radio halo being elongated in the same direction as the merger (e.g., Abell 520 - Govoni et al. 2001b; Girardi et al. 2008; Abell 2255 - Govoni et al. 2005; Abell 665 - Giovannini & Feretti 2000). More quantitatively, (ii) A523 is peculiar in its deviation from the typical Pradio − LX relation having a higher radio power or a lower X-ray luminosity than expected given the estimate of the X-ray luminosity from ROSAT data (LX,0.1−2.4 keV ∼ 1 × 1044 erg s−1 , Ebeling et al. 1998; B¨ ohringer et al. 2000). On the basis of data available at that time, G11 analysed the internal structure of A523. The analysis of a colour selected photometric catalogues of galaxies extracted from the SuperCOSMOS Sky Surveys showed that the cluster is bimodal and elongated along the SSW-NNE direction. The analysis of ROSAT X-ray data revealed a bimodal distribution of the hot ICM, with a clear shift between the galaxies and gas distribution, thus suggesting an ongoing merger (see fig. 5 of G11). Unfortunately, so far, only the redshift of the brightest cluster galaxy (hereafter BCG1) has been available and the kinematical analysis based on member galaxies has never been performed. A523 was included in our observational program aimed to study the internal dynamics of clusters with diffuse radio emission (DARC – Dynamical Analysis of Radio Clusters, see Girardi et al. 2011 and refs. therein1 ). We obtained new photometric and spectroscopic data acquired at the Isaac Newton Telescope (INT) and at the Telescopio Nazionale Galileo (TNG). We also analysed very recent, never analysed before, X-ray data from the Chandra archive and radio data from the Jansky Very Large Array (VLA) archive data. This paper is organized as follows. We describe optical observations and present our spectroscopic data catalogue in Section 2, while Section 3 presents our analysis and results based on optical galaxy data. In Sections 4 and 5 we present our analyses and results from X-ray and radio data, respectively. Section 6 is devoted to the interpretation and discussion of the A523 structure based on multiwavelength data. Throughout this paper, we use H0 = 70 km s−1 Mpc−1 and h70 = H0 /(70 km s−1 Mpc−1 ) in a flat cosmology with Ω0 = 0.3 and ΩΛ = 0.7. In the adopted cosmology, 1′ corresponds to ∼ 115 h−1 70 kpc at the cluster redshift. Unless otherwise stated, we indicate errors at the 68% confidence level (hereafter c.l.).
1
see also http://adlibitum.oat.ts.astro.it/girardi/darc, the web site of the DARC project. MNRAS 000, 1–21 (2015)
A multiwavelength view of Abell 523
3
Figure 1. Multiwavelength view of Abell 523. The grey-scale image in background corresponds to the r-band (INT data). Superimposed, with blue colour, we show the smoothed Chandra X-ray image in the 0.5-2 keV energy range (see Sect. 4). Thin magenta contours refer to the high–resolution 1.4 GHz VLA image and highlight the discrete radio sources. Thick red contours refer to the low-resolution 1.4 GHz VLA image (with discrete sources subtracted) and highlight the radio halo (see Sect. 5). Dashed green circles indicate the centres of the two subclusters detected through the 2D-DEDICA analysis applied to the photometric member galaxies (see Sect. 2). Labels refer to specific galaxies discussed in the text. North is up and east is left. At the cluster redshift, the scale of 2′ correspond to ∼ 0.23 h−1 70 Mpc and the FOW of the whole image is 2 × 2 h−1 70 Mpc.
2 2.1
OPTICAL OBSERVATIONS AND DATA SAMPLE Spectroscopic and photometric observations
Multi-object spectroscopic observations of A523 were carried out at the TNG in 2012 December and 2014 January. We MNRAS 000, 1–21 (2015)
4
M. Girardi et al.
used the instrument DOLORES in MOS mode with the LRB Grism2 . In summary, we observed six MOS masks for a total of 210 slits. The total exposure time was 3600 s for three masks, 5400 s for two masks and 7200 s for the last one. Reduction of spectra and radial velocities computation with the cross-correlation technique (Tonry & Davis 1979) were performed using standard IRAF3 tasks, as done with other clusters included in our DARC sample (e.g., Boschin et al. 2012). In two cases (IDs.65 and 110; see Table 1) the redshift was estimated measuring the wavelength location of emission lines in the spectra. Our spectroscopic catalogue lists 132 galaxies in the field of A523. We corrected the nominal velocity errors provided by the cross-correlation technique by multiplying them by a factor of 2.2 as derived from multiple measures of the same targets (e.g., Boschin et al. 2013). Taking into account the above correction, the average value of the cz errors is 72 km s−1 . Our photometric observations were carried out with the Wide Field Camera (WFC), mounted at the prime focus of the 2.5m INT telescope. We observed A523 in g, r and i Sloan-Gunn filters in photometric conditions and a seeing of ∼1.4′′ . The WFC consists of a four–CCD mosaic covering a 33′ ×33′ field of view (FOW), with only a 20 per cent marginally vignetted area. We took nine exposures of 600 s in g filter, and nine frames more of 360 s exposure in r and i filters, respectively. So a total of 5400 s in g filter, and 3240 s in r and i bands. Details on observation procedures and data reduction are described in Barrena et al. (2007). As a final step, we corrected the Galactic extinction Ag = 0.569, Ar = 0.386 and Ai = 0.276 following values listed by NED4 . We estimated that our photometric sample is complete down to g = 22.4 (23.4), r = 21.4 (22.7) and i = 21.2 (22.4) for signal-to-noise ratio S/N = 5 (3) within the observed field.
2.2
Spectroscopic catalogue and notable galaxies
Table 1 lists the velocity catalogue (see also Fig. 2): identification number of each galaxy, ID (Col. 1); right ascension and declination, α and δ (J2000, Col. 2); (dereddened) r magnitude (Col. 3); heliocentric radial velocities, V = cz⊙ (Col. 4) with errors, ∆V (Col. 5). With the exception of one galaxy, INT dereddened magnitudes are available. The cluster galaxy population is dominated by the galaxy ID 75 (BCG1) lying in the northern region. BCG1 also shows an important, diffuse halo slightly elongated towards SSW (see Fig. 3). There is no obvious discrete Xray/radio source associated with this galaxy. The second brightest galaxy ID 56 (BCG2) lies in the southern region. BCG2 is 1.1 mag fainter than the brightest galaxy (BCG1)
2
http://www.tng.iac.es/instruments/lrs is distributed by the National Optical Astronomy Observatories, which are operated by the Association of Universities for Research in Astronomy, Inc., under cooperative agreement with the National Science Foundation. 4 NASA/IPAC Extragalactic Database which is operated by the Jet Propulsion Laboratory, California Institute of Technology, under contract with the National Aeronautics and Space Administration. 3 IRAF
Table 1. Radial velocities of 132 galaxies in the field of A523. For each galaxy, the table lists right ascension and declination, α and δ (J2000); INT dereddened r-band magnitude, r; heliocentric radial velocity, V , with error, ∆V . IDs in italics refer to nonmember galaxies. Galaxy ID 75 is the BCG1. Galaxy ID 56 is the BCG2.
α , δ (J2000) (4h ,+8o )
ID 1 2 3 4 5 6 7 8 9 10 11 12 13 14 15 16 17 18 19 20 21 22 23 24 25 26 27 28 29 30 31 32 33 34 35 36 37 38 39 40 41 42 43
58 58 58 58 58 58 58 58 58 58 58 58 58 58 58 58 58 58 58 58 58 58 58 58 58 58 58 58 58 58 58 58 59 59 59 59 59 59 59 59 59 59 59
47.73,48 49.93,47 52.20,48 52.28,55 53.38,49 53.76,46 54.06,48 54.23,48 54.74,51 54.78,42 54.97,52 55.08,55 55.12,43 55.31,50 55.67,51 56.00,50 56.53,49 56.63,54 57.66,48 57.70,41 57.90,47 57.72,45 57.76,53 57.96,53 58.67,56 58.91,50 58.93,51 59.02,45 59.29,43 59.43,47 59.57,45 59.77,44 00.83,47 00.90,53 01.15,51 01.51,46 01.90,57 02.12,44 02.73,41 02.99,45 03.28,48 03.42,53 03.64,42
21.5 54.6 42.6 44.5 39.4 54.4 21.5 42.9 37.7 57.2 20.4 44.5 54.2 16.4 08.5 27.2 36.2 33.2 49.7 21.6 01.0 41.8 26.1 06.8 09.2 45.2 36.9 10.2 57.7 47.7 19.6 49.6 09.5 59.2 25.6 45.5 15.7 55.8 46.5 12.7 20.1 12.3 33.8
r 19.88 18.26 18.14 17.86 19.50 19.07 17.66 15.73 19.46 17.89 19.60 18.99 18.29 17.82 18.40 17.69 17.11 18.46 17.49 18.20 17.61 18.86 18.59 19.31 20.29 19.46 18.49 17.18 18.68 17.90 19.42 18.23 17.94 19.22 18.65 17.66 17.53 16.96 17.88 17.41 19.91 19.26 18.23
V ( km
∆V s−1 )
135555 42401 30189 32223 31578 30182 41879 41863 31600 29600 32078 42144 32798 29935 32764 31039 43442 42646 31756 29470 41165 63627 47438 47330 10848 30398 30549 23945 31526 32114 31090 30736 32626 51820 29595 40808 20563 32114 30866 32133 31782 41688 31831
112 70 51 68 59 84 44 40 73 55 132 73 35 42 46 86 35 145 44 37 46 77 88 194 101 70 59 75 44 35 73 51 42 101 66 53 73 35 44 44 103 119 35
and only 0.7-0.8 mag brighter than other luminous cluster galaxies. G11 detected nine discrete radio sources in the field of A523 (see their fig. 2), two of them having a measured redshift. The prominent head–tail radio galaxy in the central region of the cluster is the member galaxy ID 68, while in the South a discrete radio source is associated to the cluster member ID 56 (BCG2). Among the discrete radio sources listed by van Weeren et al. (2011a; see their fig. 6), their source A is the head–tail galaxy cited above, source B is a probable background galaxy (by visual inspection of our MNRAS 000, 1–21 (2015)
A multiwavelength view of Abell 523
5
Figure 2. INT r-band image of Abell 523. Open symbols highlight galaxies of our spectroscopic catalogue. Circles and squares indicate cluster members and non-member galaxies, respectively (see Table 1). Labels refer to specific galaxies discussed in the text. North is up and east is left. The FOW of the image is 2 × 2 h−1 70 Mpc.
INT images) and source C is a pointlike source (quasar?) with unknown redshift.
3 3.1
ANALYSIS OF THE OPTICAL DATA Member selection and global properties
As usual in the analysis of DARC clusters, the selection of cluster members was performed in two steps. First, MNRAS 000, 1–21 (2015)
we run the 1D version of the adaptive-kernel method by Pisani (1993; hereafter 1D-DEDICA) on the 132 galaxies of our spectroscopic catalogue. DEDICA is a non-parametric, scale-independent method for density reconstruction. The output of this method gives a list of groups with related statistical significance and their members. The estimate of the (Gaussian) kernel sizes is done through and iterative, optimized procedure. In the case of A523, the 1D-DEDICA method detects the cluster as a peak at z ∼ 0.103 populated
6
M. Girardi et al.
Table 1. Continued.
α , δ (J2000) (4h ,+8o )
ID 44 45 46 47 48 49 50 51 52 53 54 55 56 57 58 59 60 61 62 63 64 65 66 67 68 69 70 71 72 73 74 75 76 77 78 79 80 81 82 83 84 85 86
Table 1. Continued.
59 59 59 59 59 59 59 59 59 59 59 59 59 59 59 59 59 59 59 59 59 59 59 59 59 59 59 59 59 59 59 59 59 59 59 59 59 59 59 59 59 59 59
03.94,56 03.96,47 04.03,41 04.87,45 04.92,46 05.17,43 05.46,52 05.49,42 05.54,45 06.12,45 06.23,45 06.49,44 06.59,43 07.37,48 07.43,49 07.77,41 07.96,50 08.04,50 08.90,45 08.98,43 10.98,51 11.03,53 11.17,48 11.18,52 11.32,48 11.90,54 11.95,44 12.11,43 12.65,50 12.86,46 12.87,53 12.94,49 12.99,49 13.43,47 13.91,44 14.12,50 14.39,49 14.48,43 14.49,47 14.73,50 14.99,55 15.09,51 15.51,48
32.7 15.4 46.7 17.8 56.0 13.5 25.7 41.0 55.1 21.6 11.8 23.5 49.2 54.5 20.7 05.2 49.5 13.3 43.8 51.1 04.0 27.9 35.7 49.6 12.6 49.1 14.0 04.0 01.9 59.4 32.8 41.1 14.2 15.6 06.3 44.6 44.5 32.3 10.9 27.1 57.6 52.1 02.2
r 19.99 17.74 16.52 18.49 19.22 20.50 18.93 18.28 17.64 16.51 17.46 17.11 15.83 18.40 19.00 18.25 18.28 18.00 19.32 18.55 19.71 19.76 16.49 16.35 16.78 18.43 18.45 18.99 16.90 19.00 18.23 14.68 17.98 17.28 18.56 18.25 17.26 19.48 18.48 18.12 20.01 18.81 17.40
V ( km
∆V s−1 )
ID
109090 30926 30757 29903 31911 31887 31665 31131 30677 30894 42229 31001 31222 41700 31071 32278 31089 30776 32360 31380 30561 45429 28498 32901 30143 60294 31502 83329 29941 28631 41920 31053 30890 30127 42410 30403 31107 50143 42176 32894 59596 30076 30765
108 36 53 163 53 95 55 33 40 40 62 40 44 134 70 33 48 70 103 48 134 100 68 44 40 59 46 57 42 114 57 42 42 51 110 44 64 114 66 42 81 39 40
87 88 89 90 91 92 93 94 95 96 97 98 99 100 101 102 103 104 105 106 107 108 109 110 111 112 113 114 115 116 117 118 119 120 121 122 123 124 125 126 127 128 129 130 131 132
by 80 galaxies considered as fiducial cluster members (in the range 28 498 ≤ V ≤ 33 072 km s−1 , see Fig. 4). The 52 non-members are 4 foreground and 48 background galaxies, respectively. In particular, a rich, background peak lies at z ∼ 0.140 with 26 assigned galaxies (hereafter BACKstruct). In a second step, we combined the spatial and velocity information by running the “shifting gapper” method based on a gap of 1000 km s−1 (Fadda et al. 1996; Girardi et al. 1996). The “shifting gapper” method rejects galaxies that are too far in velocity from the main body of galaxies within a fixed bin that shifts along the distance from the cluster center. We considered the standard values of the velocity gap, 1000 km s−1 in the cluster rest frame, and of the radial bin, 0.6 h−1 70 Mpc. The determination of the center is not obvious in the case of an un-
α , δ (J2000) (4h ,+8o ) 59 59 59 59 59 59 59 59 59 59 59 59 59 59 59 59 59 59 59 59 59 59 59 59 59 59 59 59 59 59 59 59 59 59 59 59 59 59 59 59 59 59 59 59 59 59
16.00,45 16.18,51 16.38,52 16.54,43 17.16,52 17.62,52 18.10,46 18.16,46 20.25,45 20.41,54 20.54,43 20.99,45 21.77,50 22.56,52 23.26,46 23.32,45 23.32,49 25.05,46 26.67,46 27.19,46 29.68,52 30.46,52 30.60,53 32.03,48 32.60,51 33.12,46 33.33,48 33.97,45 34.46,50 35.19,49 36.06,49 36.06,50 36.70,44 36.84,46 38.24,49 38.70,46 38.79,46 39.18,50 40.78,46 42.75,45 43.55,52 43.84,47 45.06,45 48.43,51 48.83,47 56.68,51
21.2 06.4 00.7 03.2 58.3 09.0 17.8 58.4 01.1 46.8 43.2 14.7 44.0 00.4 14.9 34.2 40.7 42.3 15.1 04.4 37.6 49.9 23.4 31.5 52.6 34.2 58.1 06.5 55.1 24.1 55.2 18.1 06.8 58.8 08.5 55.7 16.2 49.3 28.8 29.9 54.1 08.5 39.8 06.9 25.4 10.9
r 16.94 18.44 18.07 18.69 19.20 19.68 19.40 17.32 16.03 16.69 19.91 17.55 19.51 19.26 17.27 19.97 19.23 17.61 20.14 17.75 18.12 18.92 18.74 19.00 17.86 17.62 19.21 17.66 17.48 19.49 19.34 19.24 18.28 19.43 17.79 18.42 18.70 19.78 18.89 17.13 17.26 19.10 18.97 18.29 16.79 −.−
V ( km
∆V s−1 )
33072 29114 30772 108965 30488 42064 30659 30767 20028 31786 49204 30772 32911 32790 29947 29535 30121 32083 41988 31814 31245 60220 32014 45191 32103 42361 126550 42559 30722 32440 41935 47985 42416 41824 31662 41001 42861 63094 41288 44699 42060 60116 41287 71136 31365 75506
99 62 33 62 121 77 44 35 29 48 119 57 130 123 37 86 92 59 198 51 95 103 136 100 88 44 128 59 48 92 53 112 90 123 44 40 81 106 57 40 31 103 99 134 46 119
relaxed cluster. In the case of A523 we considered the biweight position in R.A. and Dec. of the fiducial member galaxies [R.A.=04h 59m 08 s. 97, Dec.=+08◦ 48′ 06 ′′. 3 (J2000.0)]. The biweight is a robust statistic for determining the central location of a distribution. It was suggested by Tukey (1960) as an improvement for non-Gaussian and contaminated normal distributions and requires an auxiliary scale estimator, the median absolute deviation from the sample median as used in the ROSTAT statistical routines5 (Beers
5
http://bima.astro.umd.edu/nemo/man html/rostat.1.html MNRAS 000, 1–21 (2015)
A multiwavelength view of Abell 523
Figure 3. Zoomed-in INT r-image to view the details of the halo of BCG1, the brightest cluster galaxy specifically related to the northern subcluster. (The FOW of the image is ∼ 125 × 130 h−1 70 kpc).
20
15
10
5
0 0.09
0.1
0.11
Figure 4. Redshift galaxy distribution. Thick red line histogram refers to the 80 galaxies assigned to A523 according to the 1D-DEDICA reconstruction method. An important background structure at z ∼ 0.14 (BACKstruct) is also evident in the figure. The inset figure shows the member-galaxy distribution with the indication of the BCG1 and BCG2 velocities.
et al. 1990). We also considered the X–ray center listed by B¨ ohringer et al. (2000), and the density peak of the Chandra X-ray surface brightness as determined in the present study. Independently of the adopted center, the “shifting gapper” procedure confirms the 80 fiducial cluster members in the velocity peak. Hereafter we adopt the biweight center. The MNRAS 000, 1–21 (2015)
7
Figure 5. Top panel: rest-frame velocity versus projected clustercentric distance for the 80 member galaxies. The very large blue square indicates BCG1 and the large red square indicates BCG2. Middle and bottom panels: integral profiles of mean rest-frame velocity and LOS velocity dispersion, respectively. The mean (and dispersion) at a given (projected) radius R from the cluster center is estimated by considering all galaxies within that radius – the first value computed on the five galaxies closest to the center. The 68% error bands are also shown. Reference values for global mean velocity and velocity dispersion are hV i = 31 165 ± 107 km s−1 and −1 σV = 949+80 −60 km s . In the bottom panel, the horizontal, green line represents the 1sigma error band of the X-ray temperature (kTOUT = 5.3 ± 0.3 keV, see Sect. 4.3) and converted in σV assuming energy density equipartition between ICM and galaxies, i.e. βspec = 1, see Sect. 6.
projected phase space of member galaxies is shown in Fig. 5 (top panel). The analysis of the velocity distribution of the 80 cluster members was performed by using the biweight estimators of location and scale as implemented in the ROSTAT statistical routines (Beers et al. 1990). Note that Beers et al. (1990) tested the resistance, robustness, and efficiency of these and other estimators with extensive simulations for a number of common cases realizable in samples of cluster velocities. Following that study and Girardi et al. (1993), we always used the biweight estimator of scale for samples of n ≥ 15 galaxies and the gapper estimator for samples of n < 15 galaxies. In the case of A523, we calculated the mean cluster redshift, hzi = 0.1040 ± 0.0004 (i.e., hV i = 31 165 ± 107 km s−1 ), and the global line-of-sight (LOS) velocity disper−1 sion, σV = 949+80 −60 km s . The robustness of these estimates with respect to the cluster radius is confirmed by our analysis of the mean velocity and velocity dispersion profiles (see Fig. 5).
8
M. Girardi et al.
Table 2. Results of the 2D-DEDICA analysis from the spectroscopic sample. For each subsample detected in the z catalog, the table lists the number of assigned member galaxies NS , R.A. and Dec. of the density peak, the relative density with respect to the highest peak ρS , and χ 2 value of the peak.
3.2
Subclump
NS
α (J2000), δ (J2000) h : m : s, ◦ : ′ : ′′
ρS
χS2
NNE(z) SSW(z) NW(z)
40 28 12
04 59 12.9 + 08 50 08 04 59 04.5 + 08 45 03 04 58 57.3 + 08 50 46
1.00 0.98 0.58
16 18 8
Cluster substructure
We analysed the presence of substructure on the basis of the velocity distribution of galaxies, their projected positions on the sky, and combining these two pieces of information (1D, 2D, and 3D tests). According to the analysis of the velocity distribution, there is no evidence for possible deviations from Gaussianity according to a variety of parameters (kurtosis, skewness, tail index, and asymmetry index; Bird & Beers 1993). We analysed the spatial distribution of the 80 spectroscopic member galaxies by using the 2D adaptive-kernel method of Pisani et al. (1996, hereafter 2D-DEDICA, see also the Appendix in Girardi et al. 1996). Our results are presented in Fig. 6 and Table 2 and highlight a SSW-NNE elongated structure with two very significant galaxy peaks. BCG1 and BCG2 are the two dominant galaxies of the northern and southern subclusters, respectively. We also detected a third, low density peak, at the limit of our detection threshold, in the NW. However, our spectroscopic data not cover the entire cluster field and are affected by magnitude incompleteness due to unavoidable constraints in the design of the MOS masks. The analysis of the photometric catalogues can offer an unbiased description of the 2D galaxy distribution. On the other hand, in the specific case of A523, the presence of the BACKstruct at z ∼ 0.14 has to be taken into account (Sect. 3.3) and the analysis of the INT photometric catalogues is given in Sect. 3.4. As for the 3D analysis, we searched for a correlation between velocity and position information checking for a velocity gradient (see, e.g., den Hartog & Katgert 1996 and Girardi et al. 1996) and applied the ∆-test by Dressler & Schectman (1988). The ∆-test is a powerful test for 3D substructure (Pinkney et al. 1996). We also used two kinematical estimators alternative to the δi parameter of the standard ∆-test (Barrena al. 2011, see also Girardi et al. 1997). We considered separately the contribution of the deviation of the local mean velocity from global mean velocity δi,V = [(Nnn +1)1/2 /σV ](Vloc −hV i) and the contribution of the deviation of the local velocity dispersion from the global velocity dispersion δi,s = [(Nnn + 1)1/2 /σV ](σV,loc − σV ), where the subscript loc denotes the local quantities computed in the group containing the i-th galaxy and its Nnn = 10 neighbours. In all the above tests, the statistical significance is based on 1000 Monte Carlo simulated clusters obtained shuffling galaxies velocities with respect to their positions. In A523 we found no significant evidence for a velocity gradient and substructure. However, in Fig. 7 we show the Dressler &
Figure 6. Spatial distribution on the sky of the 80 spectroscopic cluster members and relative isodensity contour map obtained with the 2D-DEDICA method (small black open circles and thin blue countours). The two huge (black) crosses indicate the position of BCG1 and BCG2 which are close to the NNE and SSW galaxy density peaks, respectively. A third, less dense peak lies in the NW. Thick magenta contours and small red crosses refer to the BACKstruct galaxies and large magenta crosses indicate EBgal and WBgal, suggested to be two dominant galaxies in the ESE-Bgroup and WNW-Bgroup. The plot is centred on the cluster center and the circle contains the cluster within a radius equal to 8′ ∼ 0.92 h−1 70 Mpc (∼ 0.5R200 ). The large (green) ’X’ label indicates the peak of the X-ray surface brightness as determined in this study.
Schectman bubble-plots resulting from the indicator δi,V for Nnn = 10 and Nnn = 5. In fact, these plots are quite suggestive of how BCG1 is surrounded by galaxies having lower velocity than galaxies surrounding BCG2, in agreement with our following analyses. We performed the 3D-DEDICA analysis detecting two very significant density peaks corresponding to the northern and southern subclusters and having peak velocities of 30 932 and 31 121 km s−1 . We also detected two other peaks, still > 99% significant, characterized by very high velocities (32 024 and 32 806 km s−1 ). Due to the problem of combining non-homogeneous quantities like position and velocity, one should be cautious in treating with results coming from methods of 3D reconstruction. However, in the case of A523, both the 3D-DEDICA analysis and the Dressler & Schectman bubble-plot agree in showing a structure more complex than the bimodal one and in finding that the low velocity galaxy population around BCG1 is surrounded by two populations at high velocity (cfr. Fig. 8 and the lower panel in Fig. 7). This complexity is likely the reason why we detected no significant evidence for a velocity gradient and for substructure using classic tests and suggests the need of a larger redshift sample to successfully describe the cluster velocity field. MNRAS 000, 1–21 (2015)
A multiwavelength view of Abell 523
9
Figure 8. Spatial distribution of the 80 cluster members (small black points) within a region of ∼ 2.8 × 2.8 h−1 70 Mpc centred on the cluster center, where the galaxies of the four subclusters detected in the 3D-DEDICA analysis are indicated by large symbols. Blue triangles, cyan circles, green squares, and red rotated squares indicate galaxies of groups with increasing mean velocities. The group formed of galaxies indicated by cyan circles is the closest one to the mean cluster velocity. The members of the two main subclusters are indicated by blue triangles (the northern one) and cyan circles (the southern one). The northern subcluster stands out for its low velocity being surrounded by two high velocity groups. The two crosses indicate the two BCGs.
Figure 7. Dressler & Schectman bubble-plot for the ∆-test based on local mean velocities estimated on Nnn + 1 galaxies. Spatial distribution of the 80 cluster members, each marked by a symbol: the larger the symbol, the larger is the deviation of the local mean velocity from the global mean velocity with scale ∝ exp(|δi,V |). Thin blue squares and thick red rotated squares show where the local value is smaller or larger than the global value. The plot is centred on the cluster center and the circle (dashed line) contains the region within a radius equal to 8′ ∼ 0.92 h−1 70 Mpc. Upper and lower panels refer to the cases Nnn = 10 and Nnn = 5, respectively.
Although the northern and southern subclusters cannot be separately detected in the velocity distribution, we obtained three alternative estimates of their relative LOS velocity, all indicating that the northern subcluster, related to BCG1, is populated by galaxies having on average a velocity lower than galaxies populating the southern subcluster, related to BCG2. We considered (i) the LOS velocity difference of the BCGs in the cluster rest frame, ∆Vrf ∼ 150 km s−1 , and (ii) the difference between the two main subsystems deMNRAS 000, 1–21 (2015)
tected in the 3D-DEDICA analysis, ∆Vrf ∼ 170 km s−1 . The (iii) estimate is based on the analysis of the mean velocity profiles computed using BCG1 or alternatively BCG2 as centres. Fig. 9 (upper panel) shows that as the galaxy populations surrounding BCG1 and BCG2 within 0.3 h−1 70 Mpc do differ in their mean velocity, while when considering galaxies at larger radii the mixing of the populations makes the values of the mean velocity to converge to the −1 global value. Considering galaxies at R< ∼ 0.3 h70 Mpc, we −1 computed hVN i = 30 561 ± 168 km s and hVS i = 31 283 ± 137 km s−1 , which means a velocity difference significant at the 2.7 sigma c.l. (∆Vrf ∼ 650 km s−1 ). We also performed the analysis of the velocity dispersion profiles (Fig. 9, lower panel). As for the population around BCG2, galaxies at R< ∼ 0.3 are characterized by a low value of velocity dispersion, while at larger radii the profile increases likely due to the contamination of the northern subcluster. Thus we can estimate σV,S ∼ 650 km s−1 for the galaxy population related to BCG2. The population around BCG1 is characterized by a higher nominal value of velocity dispersion, but the huge uncertainty prevents us to give an estimate of σV,N .
10
M. Girardi et al.
Figure 9. Error bands of mean velocity and velocity dispersion profiles computed as in middle and bottom panels of Fig. 5. Thin blue lines refer to BCG1 as center and thick red lines refer to BCG2 as center. The comparison highlights the difference in mean velocity between populations surrounding the two BCGs.
Table 3. The 2D structure of the background structure based on spectroscopic data. For each subsample the table lists the same quantities as in Table 2.
3.3
Subclump
NS
α (J2000), δ (J2000) h : m : s, ◦ : ′ : ′′
ρS
ESE − Bgroup NWN − Bgroup
11 10
04 59 37.9 + 08 46 30 04 58 55.1 + 08 48 17
1.00 0.58
Figure 10. Upper and lower panels: r–i versus r and g–r versus r diagrams, respectively. Galaxies with available spectroscopy are shown by blue open circles (cluster members) and small red dots (field members). Very large, blue open squares indicate BCG1 and BCG2. In both panels the solid line gives the best–fit CMR as determined on spectroscopic cluster members; the dashed lines define the regions within which photometric cluster members are selected. To stress the problem of contamination in A523 due to the background field, we indicate galaxies belonging to the BACKstruct with large magenta open circles. Very large, magenta open rotated squares indicate WBgal and EBgal, the second one not included in our spectroscopic catalogue.
χS2 6 4
The background galaxy structure at z ∼ 0.14
The BACKstruct is not a dense galaxy system, but rather a quite sparse structure. Applying the 2D-DEDICA analysis to the BACKstruct galaxies we detected two loose overdensities tracing the ESE-WNW direction (ESE-Bgroup and WNW-Bgroup, see Table 3). Fig. 6 shows the relevant contour map (red contours). The galaxy population of the WNW-Bgroup is dominated by the galaxy ID 8 (WBgal), while the galaxy population of the ESE-Bgroup seems to be related with the bright galaxy located at R.A.=04h 59m 38 s. 2, Dec.=+08◦ 45′ 58′′ (J2000.0; EBgal). X-ray emission is associated with both WBgal and EBgal and radio emission with EBgal only (see Fig. 1). As for the WBgal galaxy listed in Table 1, its magnitude refers to a close couple of galaxies/nuclei in the same light halo, and the spectrum refers to the northern galaxy/nucleus. As for the EBgal, this is not listed in our redshift catalogue. However, its colour is typical of that of the background structure and is surrounded by a faint halo and a few small galaxies.
In the effort of understanding the nature of the BACKstruct, we note that A523 is part of the supercluster SCL62 (Einasto et al. 2001) together with Abell 515, 525, 529, 532 in the range of photometric redshifts zphot =0.04-0.14 (Gal et al. 2000). The BACKstruct might be related to the outskirts, at ∼ 6 h−1 70 Mpc, of Abell 525 which is the closest to A523 in the plane of the sky and has zphot ∼ 0.14. 3.4
2D cluster structure based on the photometric data
Here we present our results about the cluster structure based on the INT photometric catalogues. We selected photometric members on the basis of both (r–i versus r) and (g–r versus r) colour-magnitude relations (CMRs), which indicate the early-type galaxies locus. The equations of the two CMRs are r–i=0.904-0.024×r and g–r=1.613-0.004×r and we selected galaxies within a colour range of 0.1 and 0.15, respectively (see Fig. 10). To determine the CMRs we applied a 2σ -clipping fitting procedure to the spectroscopic members (see Boschin et al. 2012 and refs. therein). In particular, to reduce the contamination of non-member galaxies, we considered the galaxies with r ≤ 19, corresponding to ∼ 2 mag after M ∗ , for a total of 196 members in the whole photometric catalogue. The results of the 2D-DEDICA analysis are presented in MNRAS 000, 1–21 (2015)
A multiwavelength view of Abell 523
11
Table 4. Results of the 2D-DEDICA analysis from the INT photometric sample. For each subsample the table lists the same quantities as in Table 2.
Subclump
NS
SSW(2D) NNE(2D) S − SSW(2D) WNW(2D) ESE(2D)
35 20 40 22 16
α (J2000), δ (J2000) h : m : s, ◦ : ′ : ′′
ρS
χS2
07.6 + 08 14.4 + 08 03.4 + 08 54.3 + 08 38.3 + 08
1.00 0.71 0.52 0.28 0.23
20 11 12 7 7
04 04 04 04 04
59 59 59 58 59
44 50 40 49 45
20 07 58 00 49
Fig. 11 and Table 4 and confirm the results obtained in the spectroscopic sample, that is the presence of the northern and southern subclusters, NNE(2D) and SSW(2D) peaks. In addition, we detected S-SSW(2D), a less dense peak in the southern region, poorly sampled by our spectroscopic catalogue, tracing the SSW-NNE direction too. We also detected two minor density peaks, ESE(2D) and WNW(2D), tracing the ESE-WNW direction, but they might be partially or totally spurious, as due to the BACKstruct contamination, as discussed in the following. Fig. 10 shows that several galaxies of the BACKstruct have colours similar to those of A523 red sequence galaxies thus likely contaminating our catalogue of photometric members. In fact, 21 out of the 26 galaxies of the BACKstruct are (erroneously) classified as photometric members of A523. Therefore our photometric sample is likely contaminated by the BACKstruct galaxies, in particular in the WNW and ESE regions. The ESE(2D) peak, located in a region where we do not detect any cluster overdensity, might be not related to A523, while the WNW(2D) peak, located in a region where both the WNW-Bgroup of the BACKstruct and the NW(z) of the A523 cluster are projected, might be contaminated (cfr. Fig. 6 and Fig. 11). As for the SSW-NNE region traced by the two main subclusters, we estimated a small (< ∼ 15%) contamination. This estimate is the ratio of the number of the BACKstruct galaxies classified as A523 photometric members to the number of A523 galaxies (spectroscopic sample) classified as A523 photometric members. Therefore, we expect a small effect in the estimate of the 2D positions of the peaks of the northern and southern subclusters as listed in Table 4 (see also the good agreement with those in Table 2).
4 4.1
X-RAY MORPHOLOGICAL AND SPECTRAL ANALYSIS Observation and data reduction
A523 was observed by Chandra with the ACIS-I configuration in VFAINT mode on 2013, November 04 (obsID 15321). The data were analysed with CIAO 4.6 in conjunction with the Chandra Calibration Database (CALDB) 4.6.1. All data were reprocessed from the level=1 event files following the standard Chandra reduction threads. In particular we ran the task acis_process_events to flag background events that are most likely associated with cosmic rays and removed them. With this procedure, the ACIS particle backMNRAS 000, 1–21 (2015)
Figure 11. Spatial distribution on the sky of the photometric cluster members with r ≤ 19 (small black dots). The contour map is obtained with the 2D-DEDICA method (blue contours). The two large black crosses indicate the position of BCG1 and BCG2 and the two magenta crosses indicate EBgal and WBgal, likely the dominant galaxies in the background structure (see Fig. 6 and the text). The radio emission is shown in a schematic way (small red crosses) to give the lowest contour of Fig. 17 (middle panel). The large green ’X’ label indicates the peak of the X-ray surface brightness. The plot is centred on the cluster center and the circle contains the region within a radius equal to 8′ ∼ 0.92 h−1 70 Mpc.
ground can be significantly reduced compared to the standard grade selection. The data was filtered to include only the standard event grades 0, 2, 3, 4 and 6. From low surface brightness regions of the active chips we extracted light curves which were cleaned from soft proton flares using the CIAO task deflare with the clean option. The observation was quiescent resulting in a negligible loss of time and in an effective exposure time of 27 ks. Point source detection was performed using wavedetect on a 0.5-7 keV band image, supplied with a 1.4 keV psf map to minimize spurious detections at chip boundaries. The detection threshold was set to 10−6 and the scales were set to a factor of 2 from 1 to 8. Point sources were removed using appropriate elliptical regions containing 99% of their flux. Spectral extraction was performed with the CIAO tool specextract creating the appropriate response files, RMF and ARF, for the selected spatial region. Spectral fitting was performed with
M. Girardi et al.
4.2
X-ray image and surface brightness analysis
We created an image in the 0.5-7 keV band and a corresponding exposure map at 1.4 keV, to make an exposure corrected image, smoothed on a scale of 10′′ , as shown in Fig.12. We processed the image to remove the point sources using the CIAO tool dmfilth, which replaces photons in the vicinity of each point source with a locally estimated background. We performed a morphological analysis adopting quantitative measures by applying the power ratios technique (Buote & Tsai 1996), the centroid shifts (Mohr et al. 1993) and the concentration parameter (Santos et al. 2008). The power ratio method exploits the idea that the X-ray surface brightness represents the projected mass distribution of the cluster. The power ratio is a multipole decomposition of the two dimensional surface brightness inside a given aperture. We calculated the power ratios within an aperture of 500 h−1 70 kpc for comparison with previous work. In particular, we used the P3 /P0 ratio which provides a clear substructure measure following Cassano et al. (2010). Centroid shifts indicate that the center of mass of the X-ray emitting gas varies with radius. Centroid shifts and power ratios are both capable of identifying highly disturbed systems or systems with significant, well defined substructures (Poole et al. 2006). Following the method of Poole et al. (2006), the centroid shift was computed in a series of circular apertures centred on the cluster X-ray peak. The radius of the apertures was decreased in steps of 5% from 500 h−1 70 kpc to 25 h−1 kpc. The concentration parameter, c, is defined as the 70 −1 ratio of the peak (calculated within 100 h70 kpc) over the ambient surface brightness (calculated within 500 h−1 70 kpc). The concentration parameter differentiates clusters with a compact core (core not disrupted by a recent merger event) from clusters with a spread distribution of gas in the core (core disrupted by a recent merger episode). We applied these techniques and the results are reported in Table 5. All the morphological indicators confirm quantitatively the simple visual indication of a disturbed cluster affected by a merger.
58:00.0
A523 2 arcmin
54:00.0
230 kpc
Declination 46:00.0 8:50:00.0
Xspec 12.8.2 using the C-statistic. We rebinned the spectra to ensure at least 20 photons per bin to aid in model selection and computational speed. The energy range was restricted to 0.5-7.0 keV and all spectra were fitted including components for the cluster emission and background. We used a single thermal APEC component to model the ICM emission modified by Galactic absorption fixed at 1.2 × 1021 cm−2 (Dickey & Lockman 1990, a similar value 1.05 × 1021 cm−2 is reported by Kalberla et al. 2005). To account for the background we included additional spectral components in the fits: we included two APEC components (kT = 0.07 keV and 0.2 keV, the former un-absorbed) to account for the Galactic foreground and a power law component (Γ = 1.41) for the Cosmic X-ray Background due to unresolved AGNs. To account for the instrumental background, we followed the analytical model of Bartalucci et al. (2014) which was not folded through the ARF. The background parameters were constrained by fitting spectra extracted from regions free of cluster emission at the edges of the FOW, and then the fitted normalizations were rescaled accordingly to the source extraction area.
42:00.0
12
50.0
40.0
30.0
20.0
10.0 4:59:00.0 50.0
40.0 58:30.0
Right ascension
Figure 12. Chandra image in the 0.5–7 keV energy band smoothed on a 10′′ scale. The image was divided by the exposure map at 1.4 keV to correct for exposure variations. The detected point sources connected with galaxies belonging to the background groups are highlighted by two red open circles.
Table 5. Results of the morphological analysis of the X-ray image of A523. The table lists the power ratio P3 /P0 ; the centroid shift w as computed within a radius of (500 h−1 70 kpc); the concentration parameter c. All the three indicators indicate that A523 is a disturbed cluster.
P3 /P0 (×10−7 )
w (500 h−1 70 kpc)
c
1.8+2.3 −1.6
0.025 ± 0.002
0.095 ± 0.003
We extracted the surface brightness profile from the exposure corrected image in the 0.5-7 keV band and we accounted for the X-ray background by including a constant background component. The data were grouped to have 200 counts per bin and the χ 2 statistics was applied. The best-fitting β -model has a core radius of rc = (181 ± 17) h−1 70 kpc (i.e., 98′′ ±10′′ ) and β = 0.42 ± 0.02 for a χ 2 /d.o.f. = 116/115 (see Fig.13). The peak of the surface brightness lies at R.A.=04h 59m 08 s. 9, Dec.=+08◦ 45′ 31′′ (J2000.0) and the central gas density, as obtained in a region of 165 h−1 70 kpc, is 1.1 × 10⁻³ cm−3 with an uncertainty of 4%. 4.3
Spectral analysis
We calculated the mean temperature of the cluster as the temperature obtained with a spectral fit in the region 0.05R180 < r < 0.2R180 , where R180 = 1780(kT /5keV)1/2 h(z)−1 kpc with h(z) = (ΩM (1 + z)3 + ΩΛ )1/2 using an iterative procedure to calculate kT and R180 (Rossetti & Molendi 2010). We found kT = 5.3 ± 0.3 keV. The value of kT thus estimated within the 0.05R180 < r < 0.2R180 region, hereafter kTOU T , is a good proxy for the global temperature (see fig. 4 of Leccardi & Molendi 2008 where kTM is the global temperature). We also prepared a coarse two dimensional map of X-ray temperature, using the contour binning technique of Sanders (2006) with a S/N of 50, which resulted in three interesting MNRAS 000, 1–21 (2015)
A multiwavelength view of Abell 523
Figure 13. Surface brightness profile of the X-ray emission of A523. The best fit β -model is also shown in red.
8
A523 7.2
5.6
1 46:00.0
Declination
8:50:00.0
6.4
4.8
4
2
3.2
42:00.0
2.4
3 1.6
30.0
20.0
10.0
4:59:00.0 58:50.0
Right ascension
the ROSAT BCS (Ebeling et al. 1998), with a predicted temperature of 4.3 keV (see their table 3). Based on the ROSAT data B¨ ohringer et al. (2000, NORAS Survey) list 44 h−2 erg a luminosity LX (< Rap = 0.92 h−1 70 Mpc) = 0.88 × 10 70 −1 s in the 0.1-2.4 keV band which, as standardized in the MCXC catalogue (Piffaretti et al. 2011), gives a luminosity −1 in the 0.1-2.4 keV band, of LX,500 = 0.91 × 1044 h−2 70 erg s 6 whithin the radius R500 = 0.83 h−1 70 Mpc. This value corresponds to a predicted temperature of 2.9 keV using the best fit LX -T relation found in REXCESS (appendix B of Pratt et al. 2009). These predicted temperature estimates are significantly lower than our measure of the X-ray temperature based on Chandra data suggesting that A523 may be a significant outlier in the LX -T relation (see Fig.16). To investigate this point we made our own estimate of the A523 X-ray luminosity based on Chandra data. For the luminosity calculation we extracted a spectrum from the entire aperture of radius 0.2R180 corresponding to 337 h−1 70 kpc. From the best fit model (cstat/dof=284/262, see Fig.15) the unabsorbed flux in the 0.1-2.4 keV band is 2.01 ± 0.04 × 10⁻¹² erg cm−2 s−1 , which corresponds to an −1 in unabsorbed luminosity of 4.84 ± 0.09 × 1043 h−2 70 erg s the rest frame band 0.1-2.4 keV. The quoted errors on flux and luminosity were obtained by XSPEC using a Montecarlo procedure. Assuming that the cluster emission profile follows the best fit β -model derived above, the luminosity within R500 = 1100 h−1 70 kpc, as estimated from the Arnaud et al. (2005) scaling relation, is LX,500 = 1.57 ± 0.14 × 1044 h−2 70 erg s−1 in the 0.1-2.4 keV rest frame band. Errors in the luminosity were determined including both the spectral errors and the uncertainties in the β -model parameters. The aperture of 337 h−1 70 kpc used as reference contains 31% of the total luminosity estimated within R500 . The revised upward Chandra luminosity makes A523 more consistent with the envelope of the non-cool core clusters in the LX -T relation as shown in Fig.16.
0.8
0
5 Figure 14. Temperature map (keV) showing that the northern cluster region is characterized by a higher temperature than the central and southern regions. The central 1.5′ radius region, indicated by the label “2”, is centred close to the X-ray peak, precisely at R.A.=04h 59m 09 s. 0, Dec.=+08◦ 45′ 55′′ (J2000.0). The FOW of the image is ∼ 1.5 × 1.5 h−1 70 Mpc. The two small blue circles indicate BCG1 and BCG2 in the northern and southern regions (regions 1 and 3, respectively).
regions shown in Fig. 14. The values for the temperatures are kTReg2 = 4.7 ± 0.4 keV in the central region, kTReg1 = 6.6 ± 0.9 keV in the northern region, and kTReg3 = 4.7 ± 0.5 keV in the southern region. 4.4
X-ray luminosity estimate and the LX -T relation
The previously available X-ray information for this cluster is limited to a ROSAT All Sky Survey observation which detected the cluster at a flux of FX = 4.5 × 10⁻¹² erg cm−2 s−1 in the 0.1-2.4 keV band, bright enough to be included in MNRAS 000, 1–21 (2015)
13
5.1
ANALYSIS OF RADIO DATA Radio images
We re-analysed archival VLA data at 1.4 GHz in C-array and D-array configuration (AB1180 and AR690 projects). These data had been published in G11 and van Weeren et al. (2011a). For this study, we also considered the polarization information available from the AR690 project. The data were reduced following standard procedures using the NRAO’s Astronomical Image Processing System (AIPS) package. In Fig. 17 (top panel) we present an image at a relatively high resolution (24.4′′ × 23.2′′ , PA=−42◦ ), where the central head–tail radio galaxy is clearly visible as well as the central region of the diffuse emission. Other point-like sources are present. The image noise level is 0.012 mJy/beam. From this image it is clear that no connection is present between the radio tail and the diffuse emission (cfr. with Fig. 17 – middle panel).
6
The radius Rδ is the radius of a sphere with mass overdensity δ times the critical density at the redshift of the galaxy system.
M. Girardi et al.
0.8
1
ratio 1.2
1.4
counts s−1 keV−1 0.01
0.1
14
1
2 Energy (keV)
5
10
Figure 15. Upper panel: X-ray spectrum of the source taken from a 337 h−1 70 kpc aperture. The ACIS-I data are shown in black together with the best fit model with the cluster component in red (solid line), the particle background in blu (dotted line) and the sky background in green (dashed line). Lower panel: the ratio of the data over the model is also shown.
Figure 16. LX -T relation for the REXCESS sample with quantities derived from all the emission interior to R500 in the 0.1-2.4 keV band. Black points represent cool-core systems whereas blue triangles represent non cool-core systems according to the classification of Pratt et al. (2009). The best fitting power law relation derived from BCES (Y|X) (dashed line) and BCES orthogonal (solid line) are overplotted. The two connected (red) triangles represent the position of A523 based on the ROSAT luminosity estimate and the predicted value of T = 2.9 keV (triangle on the left) and the Chandra temperature estimate (triangle on the right). The red star represents the position of A523 based on the Chandra temperature and luminosity estimates.
In Fig. 17 (middle panel) we present an image at a resolution of 45′′ ×45′′ with the discrete sources subtracted. The image noise level is 0.07 mJy/beam. The discrete sources were subtracted in the (u, v) plane by using the AIPS task UVSUB. This image confirms the presence of a diffuse low-surface brightness radio emission at the cluster center. The total flux density at 1.4 GHz is 72±3 mJy. This flux density value corresponds to a radio power of P1.4 GHz = 1.98 × 1024 W Hz−1 . The quoted error on the flux density not only is due to the noise but also includes uncertainties in the source subtraction and in the source size. The source angular size is ≃11′ ×8′ . In Fig. 17 (bottom panel), we present a total intensity image and polarization vectors at a resolution of 65′′ ×65′′ with the discrete sources subtracted. The image noise level is 0.1 mJy/beam. The vectors give the orientation of the electric vector position angle (E-field) and are proportional in length to the fractional polarization (FPOL). In the FPOL image we considered as valid those pixels where the FPOL was above 3σFPOL . From a detailed analysis of the radio morphology of the diffuse emission, we can derive the following conclusions. i) There is no connection among discrete sources and the diffuse source. In particular, the head–tail galaxy located close to the center of the extended source is elongated on the opposite side with respect to the brightest region of the diffuse source (see Fig. 17, top panel). ii) The residuals from the subtraction of discrete sources are at a very low level and do not affect the diffuse source properties (compare Fig. 17, top and middle panels). iii) The diffuse source is generally elongated along the ESE-WNW direction. In addition, a SSWNNE elongation is present. The radio emission shows an irregular shape, with a filamentary structure characterized by a bright ridge close to the center. However, there is no evidence of a transverse flux asymmetry as usually found in relic sources due to the propagation of a shock wave (see Feretti et al. 2012). Moreover, as clearly seen in Fig. 17 (top panel), this bright ridge is completely resolved increasing the angular resolution and no compact feature is present, contrary to most of the classic relics found so far (see Feretti et al. 2012 and references therein). Therefore, in the following section we assume that the diffuse radio source in A523 is a radio halo. More specifically, we suppose that the synchrotron plasma permeates the entire cluster volume rather than being confined to a thin-layer in the peripheral region as in the case of a radio relic. Under this assumption and considering the polarization associated with the radio halo, we analysed the properties of the total intensity and polarized emission with the help of numerical simulations performed with the software FARADAY (Murgia et al. 2004), and we compared the results with the properties of the other radio haloes known in the literature. 5.2
Radio brightness profile
In the left panel of Fig. 18 we show the azimuthally averaged radio halo brightness profile of A523 obtained from the lower resolution (FWHM=65′′ ×65′′ ) image with the discrete sources subtracted. Each data point represents the average brightness in concentric annuli of 30′′ (about half beam width), centred on the radio centroid. MNRAS 000, 1–21 (2015)
A multiwavelength view of Abell 523 08 54
Declination (J2000)
52
50
48
46
44
04 59 30
15 00 Right Ascension (J2000)
58 45
04 59 30
15 00 Right Ascension (J2000)
58 45
04 59 30
15 00 Right Ascension (J2000)
58 45
08 54
Declination (J2000)
52
50
48
46
44
08 54
Declination (J2000)
52
50
48
46
44
Figure 17. Top panel: total intensity contours at 1.4 GHz with a FWHM of 24.4′′ ×23.2′′ (PA=−42◦ ). The contour levels are drawn at: 0.025, 0.05, 0.1, 0.2, 0.5, 1, 3, 5 mJy/beam. The sensitivity (1σ ) is 0.012 mJy/beam. Middle panel: total intensity contours at 1.4 GHz with a FWHM of 45′′ ×45′′ . The contour levels are drawn at: 0.2, 0.5, 1, 2, 5, 10 mJy/beam. The sensitivity (1σ ) is 0.07 mJy/beam. Bottom panel: total intensity contours and polarization vectors at 1.4 GHz with a FWHM of 65′′ ×65′′ . The contour levels are drawn at: 0.2, 0.4, 0.6, 1, 1.5, 2, 4, 6 mJy/beam. The sensitivity (1σ ) is 0.1 mJy/beam. The lines give the orientation of the electric vector position angle (E-field) and are proportional in length to the FPOL (1′′ ≃1.25%). In all the panels, the FOW of the image is ∼ 1.8 × 1.4 h−1 70 Mpc. MNRAS 000, 1–21 (2015)
15
We modeled the radio brightness profile, I(r), with an exponential of the form I(r) = I0 e−r/re , whose best-fit is shown in the left panel of Fig. 18. The proposed method for deriving the radio brightness and the length scale of diffuse emission (Murgia et al. 2009), is relatively independent of the sensitivity of the radio observation. The exponential model is attractive in its simplicity and involves a minimal set of free parameters but, obviously, it cannot account for the local deviations from the circular symmetry of the diffuse emission. The best-fit of the exponential model yields a central brightness of I0 =0.83 µ Jy/′′ 2 and a length scale re =251 ± 10 h−1 70 kpc. In the right panel of Fig. 18, we show I0 versus re of A523 in comparison with a set of radio haloes analysed in the literature (Murgia et al. 2009, Murgia et al. 2010, Vacca et al. 2011). As previously pointed out, radio haloes can have quite different length scales, but their emissivity is remarkably similar from one halo to another. A523 populates the same region of the I0 − re plane as the other radio haloes. Therefore, the diffuse total intensity emission of A523 seems in good agreement with the extrapolation of the properties of the other radio haloes known in the literature. Morphological similarities between radio and X-ray images have been found in a number of clusters hosting a radio halo (Govoni et al. 2001a) and one feature of A523 is that the point-to-point radio and X-ray emission appears quite different (see also Sect. 1 and refs. therein). However, other irregular and asymmetric haloes have been found in the literature (Govoni et al. 2012). Feretti et al. (2012) investigated the statistics of the offset between the peak of the radio halo and of the X-ray emission of the cluster. They have found that the offsets can reach several kpc and they become more relevant for haloes of smaller size. A possible explanation for this behaviour can be attributed to the cluster magnetic field power spectrum. Indeed, magnetic field simulations (Murgia et al. 2004, Govoni et al. 2006, Vacca et al. 2010) show that clusters having most of the magnetic field energy on large spatial scales may produce radio haloes characterized by comparatively high polarization emission with a filamentary structure. Instead, unpolarized radio haloes with a regular morphology are expected in clusters in which most of the magnetic field energy is on small spatial scales. In agreement with the simulation expectations filaments of polarized emission associated with a radio halo have been detected in A2255 (Govoni et al. 2005) and MACS J0717.5+3745 (Bonafede et al. 2009). In addition to the radio brightness profile of the total intensity, in Fig. 19 we show the observed brightness profiles of the polarized intensity and FPOL calculated in concentric annuli, as shown in Fig. 18. The observed profiles are traced up to a projected distance from the cluster center of ≃450 h−1 70 kpc. The FPOL profile is rather constant at ≃15-20%. To investigate if the observed FPOL levels and the distorted structure of A523 can be observed in a radio halo, we simulated 3D magnetic fields with a single power-law power spectrum of the magnetic field fluctuations |Bk |2 ∝ k−n with a Kolmogorov spectral index n = 11/3. We generated synthetic radio halo images by illuminating 3D magnetic field models with a population of relativistic electrons. At each point, on the computational grid, we calculated the total intensity and the intrinsic linear polarization emissivity at 1.4 GHz, by convolving the emission spectrum of a single
16
M. Girardi et al.
Figure 18. Left panel: the azimuthally averaged brightness profile of the radio halo emission in A523. The profile has been calculated in concentric annuli centred on the radio centroid, as shown in the inset panel. The horizontal dashed-dotted line indicates the 3σ noise level of the radio image, while the continuous line indicates the best-fit profile described by an exponential law. Right panel: best-fit central brightness I0 at 1.4 GHz versus the length scale re of A523 in comparison with azimuthally averaged brightness profiles of radio haloes taken from the literature (Murgia et al. 2009, Murgia et al. 2010, Vacca et al. 2011, and references therein). The dotted lines indicate regions of constant synchrotron emissivity.
relativistic electron with the particle energy distribution of an isotropic population of relativistic electrons. The polarization images were obtained by taking into account that the polarization plane of the radio signal is subject to the Faraday rotation as it traverses the magnetized ICM. We modelled the gas density of A523 with the β -model parameters rc =181 h−1 70 kpc β =0.42, and a central gas density of n0 =1.1 × 10⁻³ cm−3 (see Sect. 4.2). The results of the simulations are presented in Fig. 19. By adopting a Kolmogorov spectral index for the magnetic field fluctuations and by considering a magnetic field which decreases with the gas density as B(r)∝ ne (r)0.5 , the FPOL levels can be well reproduced by a magnetic field with a central strength B0 ≃ 0.5 µ G which fluctuates in a range of −1 scales from a few h−1 70 kpc up to ∼ 1 h70 Mpc . The continuum line and the shade region describe the mean and the sigma of a set of simulations (with different random seeds) performed with the magnetic field model described above. The total intensity depends on both the magnetic field and on the population of relativistic electrons, while the FPOL mostly depends on the cluster magnetic field correlationlength and strength. Once constrained the magnetic field on the basis of the FPOL profile, it is possible to investigate the population of relativistic electrons. By assuming the equipartition between magnetic field and relativistic electrons, the profiles can be well described by assuming a population of relativistic electrons with an electron energy spectral index δ = 3, and a low and high energy cut-offs of
the energy spectrum of γmin =3500 and γmax =1.5 × 10⁴ , respectively. In the middle panels of Fig. 19 we show an example of a full resolution total intensity (left) and polarized intensity (right) image obtained with the above magnetic field model. In the bottom panels of Fig. 19 we show as the simulated radio halo would appear when observed at the same resolution 65′′ and sensitivity (0.1 mJy/beam) of A523. Therefore we can conclude that a magnetic field model with a central strength B0 ≃0.5 µ G which fluctuates over a large spatial scale is able to explain the presence of a polarized radio halo at a level of 15-20% characterized by a distorted radio morphology with a significant displacement from the X-ray gas distribution. In the simulation shown in Fig. 19 the radio/X-ray displacement is ≃ 80 h−1 70 kpc.
6
SUMMARY OF RESULTS AND DISCUSSION
We present new insights into the structure of the A523 galaxy cluster from our multiwavelength analysis. The main results obtained from optical, X-ray, and radio data are summarized in the following and then discussed to derive a scenario consistent with the available observational picture.
6.1
Results from our multiwavelength analysis
On the basis of 80 member galaxies, we present the first measure of the mean cluster redshift hzi = 0.1040 ± 0.0004 – MNRAS 000, 1–21 (2015)
A multiwavelength view of Abell 523
5e+24
1e+25
1.5e+25
2e+24
4e+24
1000
500
500
0
-500
8e+24
1e+25
0
-500
-1000
-1000 -1000
-500
0
0 kpc
0.002
0.004
500
1000
-1000
0.006
-500
0
0.0002
0 kpc
0.0004
JY/BEAM
0.0006
500
0.0008
1000
0.001
0.0012
-400
-600
JY/BEAM
600
600 1 Mpc
1 Mpc 400
RELATIVE DEC. (ARCSEC)
400
RELATIVE DEC. (ARCSEC)
6e+24 W/Hz/Mpc2
1000
kpc
kpc
W/Hz/Mpc2
17
200
0
-200
-400
200
0
-200
-400
-600
-600 600
400
200 0 -200 RELATIVE R.A. (ARCSEC)
-400
-600
600
400
200 0 -200 RELATIVE R.A. (ARCSEC)
Figure 19. Top panels: azimuthally averaged radio-halo brightness profiles of the total intensity I (green dots), polarized intensity P (red dots), and FPOL (blue dots). The profiles have been calculated in concentric annuli, as shown in Fig. 18. The continuum line and the shade region in the top panels describe the mean and the sigma of a set of simulations with different random seeds performed with a magnetic field model which is able to describe the data quite well. This model is a Kolmogorov magnetic field power spectrum with a −1 central magnetic field strength of 0.5 µ G which fluctuates in a range of scales from a few h−1 70 kpc up to ∼ 1 h70 Mpc and decreases with the gas density as B(r) ∝ ne (r)0.5 . Middle panels: example of a simulated radio halo at full resolution obtained with the above magnetic field model. Left and right panels refer to the total intensity and polarized surface brightness images, respectively. Bottom panels: the images show as the simulated radio halo would appear when observed at the same resolution and sensitivity of A523. The white √ contour levels refer to the total intensity image at 65′′ resolution. Contour levels start at 0.3 mJy/beam and increase by a factor of 2.
MNRAS 000, 1–21 (2015)
18
M. Girardi et al.
previously only zBCG1 was available – and of the LOS veloc−1 ity dispersion of the galaxy population σV = 949+80 −60 km s . Our analysis of both spectroscopic and photometric optical data confirms the bimodal structure of the cluster elongated in the SSW-NNE direction, as already suggested by the analysis of old plate images (G11), with the two subclusters ∼ 0.75 h−1 70 Mpc apart in the plane of sky. We confirm that the northern subcluster is dominated by BCG1, the brightest cluster galaxy, and identify BCG2 as the dominant galaxy that lies in the southern cluster. The redshift data allow us to detect that the two subclusters are (little) separated in the velocity space and we estimate the relative LOS velocity ∆V,rf = 100-650 km s−1 in the cluster rest frame. Suggestions for a more complex structure come from the analysis of the spectroscopic and photometric samples, in particular for one or two clumps tracing the NW-SE (or NWN-ESE) direction (see Figs. 6, 8 and 11). The analysis of Chandra data allows us to support with quantitative measures the visual indication of a disturbed cluster already reported by G11 on the basis of ROSAT data. The hot ICM structure is now much better defined. The Xray surface brightness is quite elongated towards NNE, but there is no longer evidence of bimodality (cf. our Fig. 12 and Fig. 1 of G11). The peak of the surface brightness is clearly offset with respect to both the two BCGs, < ∼ 0.5 −1 and < ∼ 0.2 h70 Mpc from BCG1 and BCG2, respectively. We present the first measure of the global X-ray temperature, kTOUT = 5.3 ± 0.3 keV, and find no evidence for a cool core. Very interestingly, the kT map shows evidence for a higher temperature in the northern region. Our new measure of the −1 in the 0.1-2.4 X-ray luminosity, LX,500 = 1.6×1044 h−2 70 erg s keV rest frame band, makes A523 more consistent with the observed LX -T relation with respect to the previous ROSAT estimate, although still lying in the low luminosity regions of the envelope (see Fig. 16). Our analysis of VLA data confirms the presence of an extended, diffuse radio source having a maximum projected size of LLS ∼ 1.3 h−1 70 Mpc. The revised estimate of the radio power, P1.4 GHz = 2.0 ± 0.1 × 1024 W Hz−1 , is slightly higher than the G11 estimate. Very interestingly, in addition to the main ESE-WNW elongation, our new analysis shows that the radio source has a minor SSW-NNE elongation almost aligned with the main optical/X-ray cluster elongation (see Fig. 17, middle panel, and Fig. 1). The radio source permeates the region between the two subclusters and is classified as a radio halo. In comparison to other clusters hosting radio haloes, A523 is highly peculiar in the P1.4 GHz -LX plane having a higher radio power (or lower X–ray luminosity) than expected (see also Sect. 6.4). Despite this, A523 is typical among clusters hosting radio haloes since it populates the same region of the I0 -re plane (see Fig. 18, right panel) and the P1.4 GHz -LLS plane (see e.g., Fig. 7 of Feretti et al. 2012). The radio emission is clearly offset from the X-ray emission and the radio/X-ray peaks offset is ∼ 0.3 h−1 70 Mpc. We also detect a modest polarization (FPOL ∼ 15 − 20%), unusual in radio haloes since, so far, a polarized signal has been detected only in a couple of other radio haloes. Both the observed radio/X-ray offset and polarization might be the result of having most magnetic field energy on large spatial scales as we show using an ad hoc set of simulations (see Sect. 5.2).
6.2
Cluster mass estimate
Both our optical and X-ray data indicate that A523 is a massive cluster. Using the theoretical relation between mass and velocity dispersion of Munari et al. (2013; Eq. 1 checked on simulated clusters), the derived cluster mass is 14 −1 M200,opt (< R200,opt = 1.9 h−1 70 Mpc) = 9.0 ×10 h70 M⊙ , with related uncertainties of 8% and 23% on R200,opt and M200,opt , as propagated from the error on σV . An additional 10% of uncertainty on mass is indicated by the scatter around the theoretical relation which, however, does not take into account the cluster asphericity in the velocity ellipsoid (e.g., Wojtak 2013). From our measure of kTOUT and the scaling relation of Arnaud et al. (2005), the derived cluster mass 14 −1 is M200,X (< R200,X ∼ 1.8 h−1 70 Mpc) ∼ 7 ×10 h70 M⊙ in good agreement with the above optical estimate.
6.3
A merger scenario
According to the main optical and X-ray features (but see Sect. 6.5), A523 can be described as a binary head–on merger (BHOM) after the primary collision. In fact, it is characterized by two important galaxy subclusters and typical X-ray features noted in simulations (e.g., Ricker & Sarazin 2001; Poole et al. 2006). It also meets the typical BHOM selection criteria as listed by Mann & Ebeling (2011) that are the non-concentric X-ray contours and the large offset of the two BCGs from the X-ray peak. The alignment of the directions defined by the two subclusters and by the elongation of X-ray isophotes indicate that SSW-NNE is the direction of the merging axis. The direction of the elongation of the large, diffuse BCG1 halo agrees, too. The small LOS velocity difference between the two subclusters indicates that the merger axis is almost perpendicular to the LOS or, alternatively, that the two subclusters are close to the turn around point. The first hypothesis is quite more reliable when analysing the merger kinematics with the use of the simple analytical bimodal model (e.g., Girardi et al. 2008 and refs. therein). According to our observational results, the relevant parameters of the two– body model are Vrf = 100-650 km s−1 for the relative LOS velocity, D = 0.75 h−1 70 Mpc for the projected distance, and Msystem = 0.7-0.9 ×10¹⁴ h−1 70 M⊙ for the mass of the system. A reliable assumption for the time relative to the core crossing is t = 0.1-0.3 Gyr since a few 108 years is the radiative lifetime of relativistic electrons losing energy. Moreover, comparable values have been found in previous studies of merging clusters hosting radio haloes, e.g. t = 0.1-0.2 Gyr is found in the case of the Bullet cluster (Markevitch et al. 2002), and t = 0.2-0.3 Gyr in Abell 520 (Girardi et al. 2008). Outgoing solutions are the only acceptable ones and α , the projection angle between the merging axis and the plane of the sky, is at most ∼ 10◦ in the Vrf = 100 km s−1 case and at most ∼ 30◦ in the Vrf = 650 km s−1 case. As for the mass ratio, both our spectroscopic and photometric optical data indicate that the southern cluster is comparable/slightly richer than the northern cluster, suggesting that the mass ratio is less than 2:1 (cfr. the relative densities and galaxy contents in Tables 2 and 4). Evidence of a merger in A523 provides additional support to the idea of a strong connection between the presence of a radio halo and an active dynamical status of the host MNRAS 000, 1–21 (2015)
A multiwavelength view of Abell 523
19
cluster (see Sect. 1 and refs. therein). In particular, A523 also agrees with other halo radio clusters in the relations between the X-ray indicators of substructure, i.e. c versus w, w versus P3 /P0 , c versus P3 /P0 (Cassano et al. 2010). Moreover, the BHOM scenario rules out the possibility that the radio source is a relic instead than a halo. In fact, in the outgoing shock-driven relic hypothesis we would expect that the subcluster, slowed down by gravitational effects, is preceded by the relic in its outgoing motion as shown by numerical simulations (e.g., Springel & Farral 2007; Mastropietro & Burkert 2008), while the radio source in A523 is centred between the centres of the two subclusters.
6.4
Scaling relations
An interesting global cluster parameter is the value of the ratio between the energy per unit mass of galaxies to that of ICM as parametrized with βspec = σV2 /(kT /µ mp ), where µ = 0.58 is the mean molecular weight and mp the proton mass. The value βspec = 1 indicates the density-energy equipartition between ICM and galaxies. The mean βspec value observed for massive clusters is consistent with unity both in nearby (Girardi et al. 1996, 1998) and in distant systems out to z ∼ 0.4 (Mushotzky & Scharf 1997). Fig. 5 (bottom panel) shows how good is the agreement between X-ray temperature and velocity dispersion in the case of A523. Numerical simulations show as both X-ray temperature and velocity dispersion rise due to the cluster merger, e.g., the temperature peaks either during the core-crossing or just after and then declines (Ricker & Sarazin 2001; Mastropietro & Burkert 2008), and similarly the velocity dispersion. However, a small enhancement of velocity dispersion is expected in the case of a merger axis perpendicular to the LOS (∼20% according to Pinkney et al. 1996) and A523 is indeed quite normal in the other relation involving global optical and Xray properties. In fact, when considering our estimate of the bolometric X-ray luminosity (LX,bol,500 = 3.44 × 1044 h−2 70 erg s−1 ) and of the velocity dispersion (σV = 950 km s−1 ), A523 lies very close to the LX -σ relation as fitted by Zhang et al. (2011). Moreover, the A523 values are still acceptable in the LX -T plane (as discussed in Sect. 4.4). We conclude that the agreement between σV and T quantities and their use as mass proxies are likely reliable. As in the case of A523, most clusters showing radio haloes have a large gravitational mass, e.g., larger than 0.7 × 10¹⁴ M⊙ within 2 Mpc (Giovannini & Feretti 2002; see also clusters analysed in our DARC program, Girardi et al. 2011 and refs. therein). In particular, when considering our estimate of the mass of A523 (M500 ∼ 5-6 ×10¹⁴ h−1 70 M⊙ , M500 ∼ 1/1.4 × M200 for a typical NFW profile), this cluster is consistent with the relation between mass and radio power as traced for clusters hosting radio haloes (see fig. 3 of Cassano et al. 2013). In spite of our revised upward X-ray luminosity, the peculiarity of A523 in the P1.4 GHz -LX plane, already claimed by G11, is not solved and, rather, it should be considered more reliable due to the improvement of the data. In Fig. 20 A523 is compared to other ∼ 40 clusters as taken from Feretti et al. (2012). According to the relation fitted on ∼ 25 clusters by Cassano et al. (2013, see their fig. 2 and table 3), A523 is MNRAS 000, 1–21 (2015)
Figure 20. Total halo radio power at 1.4 GHz versus cluster X-ray luminosity in the 0.1-2.4 keV band. Blue circles refer to clusters plotted by Feretti et al. (2012). The position of A523 is indicated by the red cross and is based on our study.
under luminous in X-ray by a factor of > ∼ 4 or over luminous in radio by a factor of > 24, which is inconsistent with the ∼ small uncertainties associated with the observational measures for A523 or with the scatter around the relation. 6.5
Suggestions for a more complex scenario
The peculiarity of A523 is not limited to the P1.4 GHz -LX relation. Although our simulations in Sect. 5.2 show that a radio/X-ray peak offset can be explained in the context of a magnetic field energy on large spatial scales and suggest that peculiar halo elongations can be observed (see Fig. 19, middle and bottom left panels), it is still not obvious that we can explain a case like A523, where the halo elongation is perpendicular to the merging axis as traced by X-ray and optical data. Looking for a possible explanation of the A523 peculiarity, we note that, although earlier we discuss the A523 phenomenology in the framework of a BHOM scenario, it is known that distinguishing between binary and complex mergers is not easy (e.g., see the relevant discussion in Mann & Ebeling 2011). In the case of A523, both optical and radio data show some evidence in favour of a complex merger suggesting a scenario where A523 is forming at the cross of two filaments, along the SSW-NNE and ESE-WNW directions. From the X-ray side, a possible evidence in favour of a more complex dynamical status comes from the enhanced temperature in the northern region, more related to the radio halo position than the southern one. In the context of a more complex scenario, the different main directions traced by radio and X-ray+optical data might refer to the two merging directions and, in particular, to be connected with the different time-scales intervening, with the radio-halo better tracing the most recent accretion phenomena, although this accretion does not involve a lot of
20
M. Girardi et al.
mass. Unfortunately, also due to the contamination of the background structure at z ∼ 0.14, we need a larger redshift sample to probe the ESE-WNW direction of accretion. We also note that our current redshift catalogue samples only the cluster region within half R200 , making the cluster accretion phenomena only partially traced.
ACKNOWLEDGMENTS We thank the referee for useful and constructive comments. M.G. acknowledges financial support from PRINMIUR 2010-11 (J91J12000450001). V.V. is supported by the DFG Forschengruppe 1254 “Magnetisation of Interstellar and Intergalactic Media: The Prospects of Low-Frequency Radio Observations”. This research was partially supported by PRIN-INAF2014. This publication is based on observations made on the island of La Palma with the Italian Telescopio Nazionale Galileo (TNG) and the Isaac Newton Telescope, The TNG is operated by the Fundaci´ on Galileo Galilei – INAF (Istituto Nazionale di Astrofisica) The INT is operated by the Isaac Newton Group. Both telescopes are located in the Spanish Observatorio of the Roque de Los Muchachos of the Instituto de Astrof´ısica de Canarias (island of La Palma, Spain). The scientific results reported in this article are based in part on data obtained from the Chandra Data Archive. The National Radio Astronomy Observatory is a facility of the National Science Foundation operated under cooperative agreement by Associated Universities, Inc.
REFERENCES Arnaud M., Pointecouteau E., Pratt, G. W., 2005, A&A, 441, 893 Barrena R., Boschin W., Girardi M., Spolaor M., 2007, A&A, 467, 37 Barrena R., Girardi M., Boschin W., de Grandi S., Eckert D., Rossetti M., 2011, A&A, 529, A128 Bartalucci I., Mazzotta P., Bourdin H., Vikhlinin A., 2014, A&A, 566, A25 Beers T. C., Flynn K., Gebhardt K., 1990, AJ, 100, 32 Bird C. M., Beers, T. C., 1993, AJ, 105, 1596 B¨ ohringer H. et al., 2000, ApJS, 129, 435 Bonafede A., et al. 2009, A&A, 503, 707 Boschin W., Girardi M., Barrena R., 2013, MNRAS, 434, 772 Boschin W., Girardi M., Barrena R., Nonino M., 2012, A&A, 540, A43 Brown S., Rudnick L., 2009, AJ, 137, 3158 Br¨ uggen M., van Weeren R. J., R¨ ottgering H. J. A., 2011, Mem SAI, 82, 627 Brunetti G., Cassano R., Dolag K., Setti G., 2009, A&A, 507, 661 Brunetti G., Jones T. W., 2015, Magnetic Fields in Diffuse Media, Astrophysics and Space Science Library, Vol. 407, SpringerVerlag Berlin Heidelberg, p. 557 Buote, D. A. 2002, in “Merging Processes in Galaxy Clusters”, eds. L. Feretti, I. M. Gioia, & G. Giovannini (The Netherlands, Kluwer Academic Publisher): Optical Analysis of Cluster Mergers Buote D. A., Tsai, J. C., 1996, ApJ, 458, 27 Cassano R., Ettori S., Giacintucci S., Brunetti G., Markevitch M., Venturi T., Gitti M., 2010, ApJ, 721, 82 Cassano R. et al., 2013, ApJ, 777, 141 den Hartog R., Katgert P., 1996, MNRAS, 279, 349 Dickey J. M., Lockman F. J., 1990, ARA&A, 28, 215
Dressler A., Shectman S. A., 1988, AJ, 95, 985 Ebeling H., Edge A. C., B¨ ohringer H., Allen S. W., Crawford C. S., Fabian A. C., Voges W., Huchra J. P., 1998, MNRAS, 301, 881 Einasto M., Einasto J., Tago E., M¨ uller V., Andernach H., 2001, AJ, 122, 2222 Enßlin T. A., Biermann P. L., Klein U., Kohle S., 1998, A&A, 332, 395 Fadda D., Girardi M., Giuricin G., Mardirossian F., Mezzetti M., 1996, ApJ, 473, 670 Feretti L., 1999, MPE Report No. 271, p. 3 Feretti L., 2005, X–Ray and Radio Connections (eds. L. O. Sjouwerman and K. K. Dyer). Published electronically by NRAO, http://www.aoc.nrao.edu/events/xraydio. Held 3–6 February 2004 in Santa Fe, New Mexico, USA Feretti L., Gioia I. M., Giovannini G. eds., 2002, Astrophysics and Space Science Library, vol. 272, “Merging Processes in Galaxy Clusters”, Kluwer Academic Publisher, The Netherlands Feretti L., Bacchi M., Slee O. B., Giovannini G., Govoni F., Andernach H., Tsarevsky G., 2006, MNRAS, 368, 544 Feretti L., Giovannini G., Govoni F., Murgia M., 2012, A&ARv, 20, 54 Ferrari C., Govoni F., Schindler S., Bykov A. M., Rephaeli Y., 2008, Space Sci. Rev., 134, 93 Gal R. R., De Carvalho R. R., Brunner R., Odewahn S. C., Djorgovski S. G., 2000, AJ, 120, 540 Giovannini G., Feretti L., 2000, New Astron., 5, 335 Giovannini G., Feretti L., 2002, in “Merging Processes in Galaxy Clusters”, eds. L. Feretti, I. M. Gioia, & G. Giovannini (The Netherlands, Kluwer Academic Publisher): Diffuse Radio Sources and Cluster Mergers Giovannini G., Feretti L., 2004, Journal of the Korean Astron. Soc., 37, 323 Giovannini G., Feretti L., Girardi, M., Govoni F., Murgia M., Vacca V., Bacchi, J., 2011, A&A, 530, L5 (G11) Girardi M., Biviano A., Giuricin G. Mardirossian F., Mezzetti M. 1993, ApJ, 404, 38 Girardi M., Fadda D., Giuricin G., Mardirossian F., Mezzetti M., Biviano A., 1996, ApJ, 457, 61 Girardi M., Giuricin G., Mardirossian F., Mezzetti M., Boschin W., 1998, ApJ, 505, 74 Girardi M., Barrena R., Boschin W., Ellingson E., 2008, A&A, 491, 379 Girardi M., Bardelli S., Barrena R., Boschin W., Gastaldello F., Nonino M., 2011, A&A, 536, A89 Girardi M., Escalera E., Fadda D., Giuricin G., Mardirossian M., Mezzetti M., 1997, ApJ, 482, 11 Govoni F., Enßlin T. A., Feretti L., Giovannini G., 2001a, A&A, 369, 441 Govoni F., Feretti L., Giovannini G., B¨ ohringer H., Reiprich T. H., Murgia M., 2001b, A&A, 376, 803 Govoni F., Murgia M., Feretti L., Giovannini G., Dallacasa D., Taylor G. B., 2005, A&A, 430, L5 Govoni F., Murgia M., Feretti L., Giovannini G., Dolag K., Taylor G. B., 2006, A&A, 460, 425 Govoni F., Ferrari C., Feretti L., Vacca V., Murgia M., Giovannini G., Perley R., Benoist C., 2012, A&A, 545, A74 Kalberla P. M. W., Burton W. B., Hartmann D., Arnal E. M., Bajaja E., Morras R., P¨ oppel W. G. L., 2005, A&A, 440, 775 (LAB Map) Kim K.-T., Kronberg P. P., Giovannini G., Venturi T., 1989, Nature, 341, 720 Leccardi A., Molendi S., 2008, A&A, 486, 359 Mann A. W., Ebeling H., 2011, MNRAS, 420, 2120 Markevitch M., Gonzalez A. H., David L., Vikhlinin A., Murray S., Forman W., Jones C., Tucker W., 2002, ApJ, 567, 27 Mastropietro C., Burkert A., 2008, MNRAS, 389, 967 Mohr J. J., Fabricant D. G., Geller M. J., 1993, ApJ, 413, 492 MNRAS 000, 1–21 (2015)
A multiwavelength view of Abell 523 Munari E., Biviano A., Borgani S., Murante G., Fabjan D., 2013, MNRAS, 430, 2638 Murgia M., Govoni F., Feretti L., Giovannini G., Dallacasa D., Fanti R., Taylor G. B., Dolag K., 2004, A&A, 424, 429 Murgia M., Govoni F., Markevitch M., Feretti L., Giovannini G., Taylor G. B., Carretti E., 2009, A&A, 499, 679 Murgia M., Govoni F., Feretti L., Giovannini G., 2010, A&A, 509, A86 Mushotzky R. F., Scharf C. A., 1997, ApJ, 482, L13 Ogrean G. A., Br¨ uggen M., van Weeren R. J., R¨ ottgering H., Croston J. H., Hoeft M., 2013, MNRAS, 433, 812 Piffaretti R., Arnaud M., Pratt G. W., Pointecouteau E., Melin J.-B., 2011, A&A, 534, A109 Pinkney J., Roettiger K., Burns J. O., Bird C. M., 1996, ApJS, 104, 1 Pisani A., 1993, MNRAS, 265, 706 Pisani A., 1996, MNRAS, 278, 697 Pizzo R. F., de Bruyn A. G., Feretti L., Govoni F., 2008, A&A, 481, L91 Poole G. B., Fardal M. A., Babul A., McCarthy I. G., Quinn T., Wadsley J., 2006, MNRAS, 373, 881 Pratt G.W., Croston J. H., Arnaud M., B¨ ohringer H., 2009, A&A, 498, 361 Ricker P. M., Sarazin C. L., 2001, ApJ, 561, 621 Rossetti M., Molendi S., 2010, A&A, 510, 83 Rossetti M., Eckert D., Cavalleri B. M., Molendi S., Gastaldello F., Ghizzardi S., 2011, A&A, 532, A123 Sanders, J. S. 2006, MNRAS, 371, 829 Santos J. S., Rosati P., Tozzi P., B¨ ohringer H., Ettori S., Bignamini A., 2008, A&A, 483, 35 Sarazin C. L., 2002, in “Merging Processes in Galaxy Clusters”, eds. L. Feretti, I. M. Gioia, & G. Giovannini (The Netherlands, Kluwer Academic Publisher): The Physics of Cluster Mergers Schuecker P., B¨ ohringer H., Reiprich T. H., Feretti L., 2001, A&A, 378, 408 Springel V., Farrar G. R., 2007, MNRAS, 380, 911 Tonry J., Davis M., 1979, ApJ, 84, 1511 Trimble P. C., 1993, MNRAS, 261, 57 Tukey, J. W., 1960, in “A Survey of Sampling from Contaminated Distributions. In Contributions to Probability and Statistics”, eds. I. Olkin, S. Ghurye, W. Hoeffding, W. Madow and H. Mann, p. 448aV485. Stanford: Stanford University Press. ֒ Vacca V., Murgia M., Govoni F., Feretti L., Giovannini G.; Orru, E., Bonafede A., 2010, A&A, 514, A71 Vacca V., Govoni F., Murgia M., Giovannini G., Feretti L., Tugnoli M., Verheijen M. A., Taylor G. B., 2011, A&A, 535, A82 van Weeren R. J., Intema H. T., Oonk J. B. R., R¨ ottgering H. J. A., Clarke T. E., 2009, A&A, 508, 1269 van Weeren R. J., Br¨ uggen M., R¨ ottgering H. J. A., Hoeft M., Nuza S. E., Intema H. T., 2011a, A&A, 533, A35 van Weeren R. J., Hoeft M., R¨ ottgering H. J. A., Br¨ uggen M., Intema H. T., van Velzen, S. 2011b, A&A, 528, A38 Venturi T., 2011, Mem. SAIt, 82, 499 Wojtak, R. 2013, A&A, 559, A89 Zhang Y.-Y., Andernach H., Caretta C. A., Reiprich T. H., B¨ ohringer H., Puchwein E., Sijacki D., Girardi M., 2011, A&A, 526, A105 This paper has been typeset from a TEX/LATEX file prepared by the author.
MNRAS 000, 1–21 (2015)
21