A New Algorithm for Monitoring Localized Deformation Phenomena Based on Small Baseline Differential SAR Interferograms O. Mora(1), R. Lanari(2), J. J. Mallorquí(1), P. Berardino(2), E. Sansosti(2) (1)
Universitat Politècnica de Catalunya (UPC) Signal Theory and Communication Dept. (TSC) C\ Jordi Girona, 1-3, D3-212, 08034 Barcelona (Spain) Phone: +34 93 401 73 61, Fax: +34 93 401 72 32, E-mail:
[email protected] (2)
Istituto per il Rilevamento Elettromagnetico dell’Ambiente (IREA), National Research Council (CNR), via Diocleziano, 328, I-80124 Napoli (Italy), ph. +39 081 570 7999, fax +39 081 570 5734 e-mail: {lanari.r, berardino.p, sansosti.e}@irea.cnr.it
Abstract - This paper presents a new solution for detecting and following the temporal evolution of small scale deformation phenomena; in particular our approach extends the capability of the SBAS technique, presented in [1-2], which is mainly focused on investigating large scale deformations with spatial resolutions of about 100m x 100m. The proposed technique relies on small baseline differential SAR (DIFSAR) interferograms only, but it is implemented by using two different sets of data generated at low (multi-look data) and high spatial resolution (single-look data), respectively. The former are used to identify and estimate, via the SBAS technique or [3-4], possible atmospheric phase artifacts and large scale deformation patterns; the latter to detect, on the high resolution residual phase components, structures highly coherent in time (buildings, rocks, lava structures, etc.), identified jointly to their heights and displacements. In particular the estimation of the temporal evolution of these local deformations is easily implemented by applying the SVD technique. The presented algorithm has been tested with data acquired by the European Remote Sensing (ERS) satellites relative to the Campania area (Italy).
I. INTRODUCTION Differential Synthetic Aperture Radar Interferometry (DIFSAR) is a relatively new technique that is becoming more and more relevant for risk management applications and for investigating different geological processes, due to its capability to produce spatially dense deformation maps of an investigated zone with centimeter to millimeter accuracy. While the DIFSAR approach has been applied several times to the analysis of single deformation episodes, the interest of the scientific community is now moving towards the study of the temporal evolution of the detected deformations. An effective way to study this temporal behavior is the generation of time-series allowing us to follow the evolution of the monitored deformations; to do this, the information available from each interferometric data pair must be properly related to those included in the other acquisitions via the generation of an appropriate sequence of DIFSAR interferograms. In this context, an innovative algorithm, referred to as small baseline subset (SBAS) approach, has
0-7803-7536-X/$17.00 (C) 2002 IEEE
been recently proposed [1-2]; it implements an ad hoc combination of the generated DIFSAR interferograms based on the following two key points: the data pairs used to produce the interferograms are characterized by a small spatial separation between the orbits (baseline), in order to limit both spatial decorrelation and topography errors; the Singular Value Decomposition (SVD) method is applied to easily link independent SAR acquisition data sets separated by large baselines, thus increasing the number of data used for the analysis. Another approach that can de used is the one found in [3-4]. The availability of both spatial and temporal information in the processed data is used to identify and filter out atmospheric phase artifacts; therefore, we can produce spatially dense deformation maps and, at the same time, deformation time-series for each investigate pixel of the imaged scene. However, because these approaches are designed to monitor deformations occurring at a relatively large spatial scale (pixel dimensions of the order of 100m x 100m), they are not appropriate for analyzing local deformations that may affect, for example, small buildings suffering a structural stress. Accordingly, a new algorithm is proposed allowing to extend the monitoring capability of the SBAS and [3-4] techniques to small scale deformations; in particular, the presented solution still relies on small baseline interferograms but it is implemented by using two different sets of DIFSAR interferograms generated at low spatial resolution (multi-look data) and high resolution (single-look data), respectively. The former are used to identify, via the SBAS approach, possible atmospheric phase artifacts and the large scale deformation patterns, first; these signals are then subtracted modulo-2π from the high resolution data and, on the residual phase components, structures highly coherent in time (buildings, rocks, lava structures, etc.) are identified jointly to their local topography and the mean velocity of differential deformation. A final step, implemented again via the SVD technique, leads to the estimation of the temporal evolution of the local deformation affecting these high coherent structures. Presented results, obtained on the data acquired by the European Remote Sensing (ERS) satellites
1237
and relative to the Campania area (Italy), demonstrate the validity of the proposed approach.
δφ model ( x, y, Ti ) =
4π
λ
⋅ Ti ⋅ v( x, y ) +
4π
λ
II. THE ALGORITHM The input data consists, as mentioned above, on a stack of single-look complex DIFSAR interferograms with short baselines. The first step of the algorithm implies the estimation and removal of the phase components related to the large spatial scale deformations and to possible topographic and atmospheric artifacts. The estimation of these phase components relies on the generation of a stack of multilook DIFSAR interferograms (easily computed for the single-look ones) and on the application of SBAS approach1 [1-2]. Following this estimation operation, the obtained signals are subtracted modulo-2π from the high resolution data; thus, the residual phase component will only account for differential deformation phenomena with respect to the previously estimated (if present) large scale displacement. In particular, the residual phase of each pixel within the i-th single-look interferogram can be expressed as follows:
δφ (x, y , Ti ) = +
4π
λ
⋅
4π
λ
⋅ Ti ⋅ v (x, y ) +
b(Ti ) ⋅ ε ( x, y ) + β ( x, y , Ti ) + n( x, y , Ti ) r (Ti ) ⋅ sin(θ )
(1)
where x and y are the pixel coordinates, Ti the temporal baseline of the interferogram, λ the wavelength, v the mean velocity of the differential displacement, b the perpendicular component of the (spatial) baseline, r the range distance, θ the incidence angle, ε the high resolution topographic error, β the non linear component of the differential displacement velocity, and n the thermal noise. We explicitly note that the deformation signal decoupling into a linear and a nonlinear component, see (1), is related to the implementation of the residual phase unwrapping operation, which is needed because only the wrapped component of the signal δφ (⋅) in (1) can be directly computed from the SLC data. Accordingly, the following phase unwrapping strategy is considered; we estimate first the terms v and ε of (1) via the maximization of the coherence factor: γ ( x, y ) =
1 ⋅ N
N
∑ exp[ j ⋅ (δφ (x, y, Ti ) − δ φ model (x, y, Ti ))]
(2)
i =0
where N is the number of differential interferograms and δφmodel is the phase model assumed as: 1
A possible alternative to this approach is also represented by the technique discussed in [3-4].
⋅
b(Ti ) ⋅ ε (x , y ) r (Ti ) ⋅ sin (θ ) (3)
Following the estimation of the factors v and ε of (1) via the maximization of (2), the final step of the procedure consists on the full determination of the time evolution of the deformations affecting those pixel exhibiting a value of the factor γ (.) greater than a fixed threshold. This result can be achieved by subtracting the model (3) from the original phase (1), thus obtaining the residual phase signal related to the non-linear component of the differential deformation velocity. Because we may reasonably assume that the amplitude of the phase residues is smaller than π, no unwrapping operation is needed to retrieve the non-linear velocity phase component that can be expressed by: (t ) − φnon−linear (t0 ) ,K φ T v non −linear = v1 = non −linear 1 t1 − t 0 K, v M −1 =
φnon −linear (t M −1 ) − φnon −linear (t M −2 )
(4)
t M −1 − t M − 2
where φnon-linear represents the non linear phase component for each SAR image with time acquisition ti, and M is the number of SAR images. The velocity vector in (4) can be now computed by solving the equation: IE j −1
∑ (t k +1 − t k ) ⋅ vnon−lineark
k = IS j
= δφ non−linear j
∀j = 1,K, N
(5)
where IS and IE represent the indexes of the master and slave interferometric images, respectively; the achieved system of equations can be easily solved by means of the Singular Value Decomposition (SVD) method, thus obtaining the values of non-linear deformation for each acquisition time. The overall differential deformation signal can be finally obtained by combining the available linear and non-linear displacement information. As final remark we want to stress that deformation signal decoupling into a linear and a nonlinear component, see (1), is similar to what implemented in the Permanent Scatterers (PS) approach [5]; however, at variance of the PS technique, the signal in (1) is related to the differential deformation only, due to the already accounted large scale deformations; in this context the linear model assumption is certainly meaningful. III. EXPERIMENTAL RESULTS In the presented study we have used 44 images relative to the city of Napoli (see Fig. 1.a), produced by the ERS-1 and ERS-2 systems and spanning the time interval from June 1992 until the end of September 2000.
1238
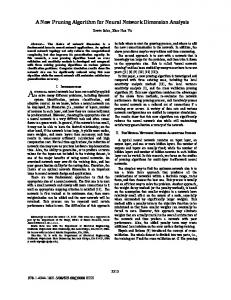
Fig. 1. SAR experiments relative to the city of Napoli area. a) ERS SAR image of the area; b) estimated γ (.) -map of the investigated zone c) temporal evolution of the deformation affecting the point marked by P in Fig. 1.a. The DIFSAR interferograms have been obtained from SAR image pairs characterized by a (perpendicular) baseline value smaller than 130 m and by using precise satellite orbital information and a DEM of the area with a mean height accuracy of about 10 meters. Moreover, pixels with an estimated factor γ (.) smaller than 0.7 have been discharged.
satellite orbit state vectors by the University of Delft, The Netherlands. The authors also would like to thank the CICYT TIC 1999-1050-C03-01 and the Generalitat de Catalunya for the economical support.
We present first in Fig. 1.b the γ (.) -map of the investigated area; the pixels exhibiting high values of γ (.) are clearly visible and the correspondence of these pixels with the buildings and man-made structures within the urbanized area of the city of Napoli is evident by comparing Fig. 1.a and 1.b.
[1] P. Berardino, G. Fornaro, A. Fusco, D. Galluzzo, R. Lanari, E. Sansosti, S. Usai: “A new approach for analyzing the temporal evolution of Earth surface deformations based on the combination of DIFSAR interferograms”, IGARSS 2001, Sydney (Australia). July 9-13, 2001. [2] P. Berardino, G. Fornaro, R. Lanari, E. Sansosti: “A new Algorithm for Surface Deformation Monitoring based on Small Baseline Differential SAR Interferograms”, submitted. [3] O. Mora, J. J. Mallorquí, J. Duro: “Generation of deformation maps at low resolution using differential interferometric SAR data”, IGARSS 2002, Toronto (Canada). June 24-28, 2002. [4] O. Mora, J. J. Mallorquí, J. Duro, A. Broquetas: “Longterm subsidence monitoring of urban areas using differential interferometric SAR techniques”, IGARSS 2001, Sydney (Australia). July 9-13, 2001. [5] Ferretti A., C. Prati, F Rocca: “Nonlinear subsidence interferometry”, IEEE Transactions on Geoscience and Remote Sensing, 38, 2202–2212, 2000.
Finally, the plot of the temporal evolution for a pixel highlighted in Fig. 1.a, is also shown in Fig. 1.c; the capability to follow the temporal evolution of the deformations affecting the investigated pixel is evident although a validation of the results produced by the presented approach is still in progress. ACKNOWLEDGMENT This work has been partially sponsored by the Italian Space Agency and the National Group of Volcanology (GNV). The DEM of the area has been provided by the I.G.M. of the Italian Army and the precise ERS-1/ERS-2
REFERENCES
1239