Fibers and Polymers 2015, Vol.16, No.6, 1417-1429 DOI 10.1007/s12221-015-1417-7
ISSN 1229-9197 (print version) ISSN 1875-0052 (electronic version)
A New Hybrid Artificial Intelligence Approach to Predicting Global Thermal Comfort of Stretch Knitted Fabrics Faten Fayala, Hamza Alibi*, Abdelmajid Jemni, and Xianyi Zeng1 Laboratory of Study of the Thermal and Energy Systems (LESTE), National School Engineers of Monastir, University of Monastir, Monastir 5019, Tunisia 1 GEMTEX Research Laboratory, National School of Arts and Textiles Industries (ENSAIT), University North Lille of France, Lille 30329-59056, France (Received February 2, 2015; Revised March 30, 2015; Accepted May 12, 2015) Abstract: Today numerous consumers consider thermal comfort to be one of the most significant attributes when purchasing textile and apparel products, so there is a need to develop a model able to simulate objectively the consumers’ perception. The global thermal comfort of stretch knitted fabrics is a multi-criteria phenomenon that requires the satisfaction of several properties at the same time. In this paper, we used the desirability functions to evaluate the satisfaction degree of global thermal comfort. Statistical method was used to investigate the interrelationship among knit thermo-physical properties, and group them into factors. Two models of artificial neural network (general and special) have been set up to predict the global thermal comfort from structural parameters (inputs) of knitted fabrics made from pure yarn cotton (cellulose) and viscose (regenerated cellulose) fibers and plated knitted with elasthane (Lycra) fibers. A virtual leave one out approach dealing with over fitting phenomenon and allowing the selection of the optimal neural network architecture was used. By combining the strengths of statistics and fuzzy logic (data reduction and information summation) also a neural network (self-learning ability), hybrid model was developed to simulate the consumer thermal comfort perception. After that, ANN model is inverted. With a required output value and some input parameters it is possible to calculate the unknown optimum input parameter. Finally, this forecasting can help industrials to anticipate the consumer’s taste. Thus, they can adjust the knitting production parameter to reach the desired global thermal comfort to satisfy this consumer. Keywords: Thermal comfort, Comfort index, Desirability functions, Knit fabrics, Artificial neural network, Virtual leave one out
either. Many other researchers studied the influence of fiber, yarn, fabric characteristics and processing parameters on thermal properties [6-15]. Other studies focused on the influence of elastane (Spandex) incorporation on the thermal comfort of various fabrics [16-20]. The statistical methods in this research have several limitations; these include difficulty of coping with complex non-linear relationships with so many variables, lack of adaptive ability, and difficulty of gathering undisturbed psychological sensation and comfort vote data. On the other hand, neural networks show tremendous success in many fields. Artificial Neural Networks (ANN) have been widely used in many fields related to the thermal environment and comfort [21-27]. Wong proposes an ANN model to predict an overall comfort perception from 10 individual sensory perceptions [28-31]. These works have shown good applicability of ANN for studying neurophysiology and psychology processing. The lack of an objective approach, in textile industry, for determining the level of global thermal comfort which takes into account both customers’ perception, operating parameters and intrinsic features of yarn and fabric provide a strong motivation for the present study for using such technique (ANN) to develop an optimal model.
Introduction Substantial consumer research in the last decade has shown that there is a clear trend of casualization in clothing consumption of modern consumers to fit into their desired dynamic and comfortable life styles. Comfort of clothing has become one of the critical attributes demanded by consumers around the world [1]. However, comfort is a very subjective, vague and complex feeling, which involves multidimensional factors. Hollies [2] stated that physical comfort might be greatly influenced by the tactile and thermal sensations arising from contact between skin and the immediate environment. Slater [3] defined comfort as “a pleasant state of physiological, psychological and physical harmony between a human being and the environment”. Li [4] described comfort as a state of multiple interactions among psychological sensations, which are determined by physical, physiological and environmental factors. Zhang explores the relationship between human body physiological status (skin and core temperatures with their change rates) and thermal response [5]. Zhang’s model explains many phenomena concerning comfort adaptation and asymmetrical experiences, but its mathematical model is not practicable as it is limited by having too many coefficients, and because of the experiment’s limitation, the regression analysis result cannot be assured *Corresponding author:
[email protected] 1417
1418
Fibers and Polymers 2015, Vol.16, No.6
Faten Fayala et al.
Experimental Sample’s Production We produced a series of 340 knitted fabrics commonly used in the clothing industry by using different industrial circular knitting machines (single jersey, double jersey, interlock; tubular and large-diameter; Diameter=16, 34 inch, gauge=18 to 28). Ground yarn was a 100 % combed cotton (1) and 100 % viscose yarn (2) (Nm=28 to 80) and plating yarn was a Lycra® monofilament (22, 33 and 44 dtex) plated at half feeder. The fabric samples were comprised of nine different knitted structures, single jersey (1), single lacoste (2), double lacoste (3), polo pique (4), 2×2 rib (5), 1×1 rib (6), interlock (7), visible molleton (8) and invisible molleton (9). Table 1 shows the maximum, minimum, average and standard deviation of knit fabric features. The greige fabrics were partially finished before evaluating their properties. The finishing conditions were chosen according to industrial tests adapted to elastane ratio of 5 %. All the fabrics were treated by the same following finishing stages: Step 1: pretreatment (to destruct all unwanted material washing process was made in a fully automatic machine at 95 oC during 30 minute) Step 2: Bleaching (It is a chemical treatment used to remove the natural color of cotton and complete cleaning cotton of its natural waste at 95 oC during 30 minute) Step 3: squeezing (to reduce the quantity of water in samples) Step 4: Heat setting (without tension) in a stenter. Step 5: Compacting. Fabric Testing First, we note that the fabrics samples were conditioned in the testing laboratory under standard atmospheric conditions of 20±2 oC and 65±4 % relative humidity after a minimum
period of 24 hours conditioning in an NF ISO17025 certified laboratory. In this study, the tests carried out were concerning the determination of these parameters according to test method and equations from literatures as mentioned in Table 2 and Table 3. Table 4 present the statistical values of thermal comfort properties of set fabrics. Theoretical Model of Thermal Clothing Comfort Prediction The prediction of clothing comfort can be described as a Table 2. Structural parameters Structural parameters Yarn count (Nm) Lycra proportion (%) Lycra yarn count (dtex) Weight per unit area (g/m2) Thickness (m) Loop length (cm)
Test method EN ISO 8388 NF ISO1833-12 EN ISO 8388 NF G07-150 NF G07-153 EN 14970 :2006
Table 3. Functional parameters Functional parameters Adiathermic power (%) Specific thermal resistance (K·m/W) Porosity (%) Air permeability (l/m2/s) Thermal conductivity (W/m·K) ; Thermal resistance (m2K/W) Relative water vapor permeability (%) Thermal absorbitivity (W·s1/2/m2·K). Thermal diffusivity (×10-7) (m2/s) Heat transfer coefficient (W/m2 oC)
Test method NFG 07-107 [32] [33] NF G07-111 [26,27,25,23] [34,35,36] [37,38] [39]
Table 1. The maximum, minimum, average and standard deviation of knit fabric features Structural parameters Knitted structure’s Yarn composition Yarn count (Nm) Gauge Lycra proportion (%) Lycra yarn count (dtex) Weight per unit area (g/m2) Thickness (m) Interlock loop length (cm) Jersey loop length (cm) 1×1 rib loop length (cm) 2×2 rib loop length (cm)
Mean value 49.460 23.883 1.069 7.539 217.407 0.001 1.317 0.310 0.599 0.622
Standard deviation 2.768 0.285 10.298 4.150 2.082 14.161 63.563 0.000 0.278 0.080 0.068 0.079
Maximum value 9 2 80 28 10 44 548 0.0016 2.72 0.74 0.92 0.87
Minimum value 1 1 20 14 0 0 119 0.00044 0.95 0.25 0.32 0.58
Prediction of Global Thermal Comfort of Knitted Fabrics
Fibers and Polymers 2015, Vol.16, No.6
1419
Table 4. The maximum, minimum, average and standard deviation of thermal comfort properties Functional parameters Adiathermic power (%) Thermal resistance (m2K/W) Specific thermal resistance (K·m/W) Porosity (%) Front side air permeability (l/m2/s) Back side air permeability (l/m2/s) Sectional front side air permeability (cm3/cm2/s) Sectional back side air permeability (cm3/cm2/s) Thermal conductivity (W/m.K) Thermal diffusivity (×10-7) (m2/s) Relative water vapor permeability (%) Thermal absorbitivity (W·s1/2/m2·K) o Heat transfer coefficient (W/m2 C)
Mean value 11.59 0.01 17.09 81.40 798.87 798.25 3.74 3.73 0.06 3.31 39.74 109.69 8.73
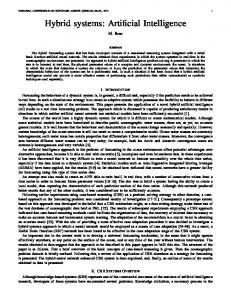
progressive process, which involves three fundamental elements: 1) structural properties of yarn and fabric, 2) fabric functional properties and 3) subjective comfort evaluation. Furthermore, the first elements can be reduced into the most relevant parameters and the second can be grouped into thermal comfort factors. Therefore, the prediction of thermal clothing comfort on the basis of the structural properties of yarn and fabric can be obtained by following 3-stages. In the first stage, 13 fabric thermal comfort properties are abstracted into 5 thermal factors. Secondly, the 5 thermal factors perceptions are abstracted into a global thermal comfort index. In the third stage, the 9 structural properties of yarn and fabric are used as input variables to predict the global thermal comfort index. Statistical Analyses All the statistical analyses in this study were carried out by using MINITAB [40]. The classification of the 13 properties of thermal comfort was divided into two stages. First, cluster analysis was used to provide a general view of the 13 properties of thermal comfort, followed by factor analysis to identify the factors that explained the pattern of correlation within a set of variables. The Quartimax rotation technique was applied. A rotated component matrix described the proportion of each variable within each component in order to classify the variables. The proportional contribution of the variance of each factor to the total variance in the data was used as an indication of the contribution of each factor to overall comfort. Cluster Analyses We use for this application 309 cotton stretch knitted fabrics (extracted from the main dataset). Figure 1 shows the relationship among the 13 properties of thermal comfort. The Squared Euclidean Distance, which describes the closeness between properties, is scaled to the range of 0 to 1. A smaller Euclidean distance means a closer relationship
Standard deviation 3.1200 0.0034 6.4900 3.4100 450.31 449.62 1.93 1.94 0.02 1.96 5.66 29.85 0.31
Maximum value 24.3 0.030 35.9 87.8 2640 2630 14.7 15.3 0.1 13.5 48.8 218.9 9.4
Minimum value 3.65 0.01 0.01 69.02 19 19 0.11 0.11 0.03 0.98 13.96 46.41 7.42
Figure 1. Relationship between properties of thermal comfort and groups of thermal comfort.
between two properties. For example, thermal conductivity has a closer relationship with thermal diffusivity than relative water vapor permeability, as the squared Euclidean distance between thermal conductivity and thermal diffusivity is smaller than that between thermal conductivity and relative water vapor permeability. Based on Figure 1, the properties of thermal comfort can be classified into 13, 9, 7, 5, 3 or 2 individual groups with Squared Euclidean Distance equal to 0.001, 0.06, 0.38, 0.40, 0.65 and 0.66 respectively. In the determination of which classification to use, the following were considered. 1) Each group should have its own meaning and 2) The classification outcome should be simple. Therefore, a classification with 5 individual groups was considered to be the most suitable solution on the basis of the above requirements. The properties of porosity, front side air permeability, back side air permeability, sectional front side air permeability and sectional back side air permeability, were grouped in the
1420
Fibers and Polymers 2015, Vol.16, No.6
Faten Fayala et al.
1st Cluster. The properties adiathermic power, thermal resistance and specific thermal resistance, were grouped into the 2nd cluster. Thermal conductivity and thermal diffusivity were grouped into the 3rd cluster. Heat transfer coefficient and thermal absorbitivity constitute the 4th cluster. Finally relative water vapor permeability is presented in 5th cluster. However, Figure 1 only illustrates the overall pattern of relationships among the thermal comfort properties, but cannot provide detailed information about the structure and relationships among properties and the relative contributions of individual clusters. Therefore, further investigation was carried out using factor analysis. Factor Analyses The purpose of applying factor analysis in this study is to identify the relationship amongst properties of thermal comfort by abstracting them into different thermal comfort Table 5. Unroated component matrixes – 3-Factor model Variable Porosity Adiathermic power Thermal conductivity Thermal resistance Specific thermal resistance Heat transfer coefficient Front side air permeability Back side air permeability Sectional front side air permeability Sectional back side air permeability Relative water vapor permeability Thermal absorbitivity Thermal diffusivity
Factor 1 0.573 0.846 -0.559 0.787 0.524 -0.785 0.546 0.546 0.734 0.732 0.045 -0.774 0.165
Factor 2 -0.216 0.446 0.142 0.604 -0.089 -0.613 -0.822 -0.823 -0.504 -0.502 0.067 -0.576 0.621
Factor 3 -0.489 0.274 -0.796 -0.024 0.817 0.043 -0.025 -0.029 -0.412 -0.415 -0.121 0.014 -0.719
factors. Tables 5 and 6, show the unrotated results of factor analysis with 3 and 5 factors. The distribution of variance among these thermal comfort factors in an unrotated factor analysis is independent and orthogonal. Unfortunately, the unrotated component matrix cannot provide a clear structure of the pattern among the thermal comfort properties. In order to solve this problem, factor rotation, which attempts to redefine the position of the thermal comfort factors such that loadings tend to be either very high (near 1 or 1) or very low (near 0), was applied. Furthermore, the rotated matrix has higher interpretability than the unrotated matrix. Tables 7 and 8 compare the latent pattern of relationships among the thermal comfort properties with Quartimax Table 7. Roated component matrixes – 3-Factor model Variable Factor 1 Factor 2 Factor 3 Porosity -0.685 Adiathermic power 0.946 Thermal conductivity -0.895 Thermal resistance 0.988 Specific thermal resistance 0.891 Heat transfer coefficient 0.991 Front side air permeability -0.918 Back side air permeability -0.921 Sectional front side air permeability -0.956 Sectional back side air permeability -0.955 Relative water vapor permeability Thermal absorbitivity 0.960 Thermal diffusivity 0.489 -0.828 % Variance 0.346 0.312 0.208 Note: All values -0.45 are marked as -.
Table 6. Unroated component matrixes – 5-Factor model Variable Porosity Adiathermic power Thermal conductivity Thermal resistance Specific thermal resistance Heat transfer coefficient Front side air permeability Back side air permeability Sectional front side air permeability Sectional back side air permeability Relative water vapor permeability Thermal absorbitivity Thermal diffusivity
Factor 1 0.573 0.846 -0.559 0.787 0.524 -0.785 0.546 0.546 0.734 0.732 0.045 -0.774 0.165
Factor 2 -0.216 0.446 0.142 0.604 -0.089 -0.613 -0.822 -0.823 -0.504 -0.502 0.067 -0.576 0.621
Factor 3 -0.489 0.274 -0.796 -0.024 0.817 0.043 -0.025 -0.029 -0.412 -0.415 -0.121 0.014 -0.719
Factor 4 0.048 0.010 0.044 0.026 -0.028 -0.024 -0.011 -0.013 0.012 0.011 -0.989 0.003 0.043
Factor 5 -0.619 -0.006 0.057 0.031 -0.037 -0.032 0.083 0.082 0.149 0.149 -0.017 -0.039 0.134
Prediction of Global Thermal Comfort of Knitted Fabrics
Fibers and Polymers 2015, Vol.16, No.6
1421
Table 8. Roated component matrixes – 5-Factor model Variable Factor 1 Porosity Adiathermic power 0.924 Thermal conductivity Thermal resistance 0.991 Specific thermal resistance 0.914 Heat transfer coefficient Front side air permeability Back side air permeability Sectional front side air permeability Sectional back side air permeability Relative water vapor permeability Thermal absorbitivity Thermal diffusivity % Variance 0.344 Note: All values -0.45 are marked as -.
Factor 2 -0.774 -0.934 -0.935 -0.958 -0.956 0.303
rotation. Three main independent dimensions among the thermal comfort properties were identified, including 5 thermal comfort factors. FACT 1 includes the thermal properties of adiathermic power, thermal resistance and specific thermal resistance. The second factor FACT2 consists on the properties of porosity, front side air permeability, back side air permeability, sectional front side air permeability and sectional back side air permeability. FACT3 contains properties of Thermal conductivity and thermal diffusivity. The relative water vapor permeability was represented in an independent factor (FACT 4). FACT 5 constitutes heat transfer coefficient and thermal absorbitivity. In the model of three factors, relative water vapor permeability was not identified into any independent factor. Both models show that FACT1 has made the largest contribution towards the global thermal comfort, followed by FACT2 and FACT3. In the 3-Factors model, 34.6 % of the sensation of thermal comfort was influenced by FACT1, followed by 31.2 % and 20.8 % for FACT2 and FACT3 respectively. For 5-Factors model, 34.3 % of the sensation of thermal comfort was explained by FACT1, 30.3 % by FACT2, 20.6 % by FACT3, 7.7 % by FACT4 and 4.7 % by FACT5. These results show consistently that the heat transfer was the most important thermal comfort aspect for cotton stretch knitted fabrics, followed by air permeability comfort. The 3 and 5-factors model explains around 86 % and 98 % of overall variance respectively. This indicates that 5-factor model has higher predictability than 3-factor model. The Selected Consumers’ Perception Simulation Method: The Desirability Function Thermal comfort is a subjective and multi criteria perception. We conceive the thermal comfort index to simulate the consumers’ perception using desirability functions. This
Factor 3 -0.921 -0.797 0.206
Factor 4 -0.998 0.077
Factor 5 -0.996 -0.962 0.047
method, take into account the desirable level fabric performance comfort in terms of the intended end use, the user requirement and the importance of each property in the global thermal comfort. The desirability function is a simple process to combine the values of several responses in a simple quantitative measure, representative of the quality of the compromise. Harrington in 1965 is the first that formulated a diagram of optimization in term of desirability function. Then Gatza and Mila in 1972 and finally Derringter and Swich in 1980 [40] brought some improvements to the calculations of the desirability function. Individual desirability functions of each property di, are combined by using the geometric mean calculated according to (1). D = d1 × d 2 × … × d m
(1)
where, D: the global desirability function to optimize, m is the number of properties This composite desirability is a measure of how the solution has satisfied the combined goals for all the responses. Composite desirability has a range of zero to one. One represents the ideal case; zero indicates that one or more responses are outside their acceptable limits. Composite desirability is the weighted geometric mean of the individual desirability for the responses. In the case where it is possible to create a hierarchy between the properties affecting the comfort perception, we affect to every property an importance degree. By using the Derringen and Suich desirability function and by according relative importance for each individual desirability we calculated the global desirability function as follows [40]:
1422
Fibers and Polymers 2015, Vol.16, No.6 w
w
w
DG = ( d1 1 × d2 2 × … × dn n )
( 1/w )
Faten Fayala et al.
(2)
where, di is the individual desirability function of the property Yi affecting the thermal comfort perception where, wi is the weight of the property Yi in the global desirability function DG. Some mathematical transformations permit to transform every response to an individual desirability function. These desirability functions di can be classified into two main types: desirability function to minimize and to maximize. For example, when we want to maximize a property Yi, such as the air permeability, we use the desirability function to maximize. Below the lower bound the response desirability is zero; above the target it is one. In this desirability function we take into account different acceptance intervals [YiMin, YiMax] and the requirement level. Where di is calculated as follows: - If Yi ≤ YiMin then di = 1 Yi – YiMax ⎞ q - If YiMin < Yi < YiMax then di = ⎛ -------------------------⎝ YiMin – YiMax⎠
(3)
HN
n
y = f ( x ) = Σj = 1 Sigm( Σi = 1 xij wij – Vj )vj – θ
- If Yi ≥ YiMax then di = 0 The weight q in (3) defines the shape of the desirability function for each property. We can select a weight (from 0.1 to 10) to emphasize or de-emphasize the target. This weight q can be also interpreted like the consumer’s requirement: the q value increase is proportional to the requirement increase. If q = 1 it places equal importance on the target and the bounds. The desirability for a response increases linearly and the consumer requirement is medium. If q >> 1 it places more emphasis on the target. A response value must be very close to the target to have a high desirability we estimate that the consumer requirement is too high. If q 0, b > 0, m > 1 and η > 1. The constants a and b define the relative importance of Fuzzy membership and typicality values in the objective
Figure 3. A flow chart of sequence of operations to predict global thermal comfort.
Prediction of Global Thermal Comfort of Knitted Fabrics
Fibers and Polymers 2015, Vol.16, No.6
function. We use the cluster centers to define the limit of seasons using the KPFCM classification (that giving purely scientific solution) after we refined these results based on several surveys from stylist and consumers to be closest to reality. The establishment of a thermal comfort index which satisfies the criteria elementary comfort of each property and factor of thermal comfort is a real multicriteria optimization.
1425
Since the thermal comfort index is a mathematical function reflecting a geometric mean of individual desirability each response, the weights are assigned according to the importance of each response in the overall desirability function. Thus, we assigned coefficients of importance to different properties and comfort factors from statistical analysis (cluster and factor) and then calculated individual desirability each property, taking into account the objectives and the
Table 11. Summary of different properties objectives and tolerances of comfort for the theme casual in mid-season Type of comfort
Thermal comfort
Properties Adiathermic power Thermal resistance Specific thermal resistance Porosity Front side air permeability Back side air permeability Sectional front side air permeability Sectional back side air permeability Thermal conductivity Thermal diffusivity (×10-7) Relative water vapor permeability Thermal absorbitivity Heat transfer coefficient
Objectives Minimize Minimize Minimize Maximize Maximize Maximize Maximize Maximize Maximize Maximize Maximize Maximize Maximize
Application of fuzzy classification KPFCM (c=12, m=2, a=1, b=1, η=2, α=0.006) Lower limit (Min) Target value Upper limit (Max) 0008.5 16.74 0000.01077 00.0176 0013.12 23.23 070.8672 0084.52 476.007 1621.76 478.16 1614.45 001.0964 0007.35101 001.0085 0007.3236 000.0379 0000.0873 001.247 0007.65 30.77 0042.458 83.12 0173.13 007.6367 0008.9932 -
Table 12. Summary of weights of different properties of thermal comfort for the theme Casual in mid-season Type of comforts
Thermal comfort
Properties Adiathermic power Thermal resistance Specific thermal resistance Porosity Front side air permeability Back side air permeability Sectional front side air permeability Sectional back side air permeability Thermal conductivity Thermal diffusivity (×10-7) Relative water vapor permeability Thermal absorbitivity Heat transfer coefficient
Coefficient of individual Degree of customer importance requirement 9.4 1 9.87 1 9.3 1 5.59 1 9.43 1 9.45 1 9.45 1 9.44 1 8.35 1 8.15 1 9.99 1 9.6 1 9.91 1
Comfort factor
Coefficient of factorial importance
FACT1
3.54
FACT2
3.13
FACT3
1.64
FACT4
0.77
FACT5
0.57
Table 13. Statistical values of output parameter of training and test set fabrics Outputs parameters Thermal comfort index
Mean value App Test 0.2800 0.3200
Standard deviation App Test 0.2256 0.2295
Maximum value App Test 0.70 0.71
Minimum value App Test 0 0
1426
Fibers and Polymers 2015, Vol.16, No.6
Faten Fayala et al.
Figure 4. Special model for the interlock knitting family.
Figure 5. Experimental vs. Predicted values for studied properties: Dataset training.
tolerances of each of them described in Table 11. The results of the factor analysis are presented in Table 12. Applying the relationship Derringen and Suich (formula 2) we obtain the weighted thermal comfort index. The results of global desirability (thermal comfort index) are shown in Table 13. Predict a Thermal Comfort Index (ANN) The optimized ANN architectures are shown in Figure 4, corresponding to special model with 8 Hidden neurons and one hidden layers. The experimental versus predicted values
Figure 6. Experimental vs. Predicted values for studied properties: Dataset validation.
of training dataset is shown in Figure 5, as it can be observed, the predictability of ANN fits very well (r2 > 0.85). To test the generalization performance of the optimal trained network, validating processes was applied using the test database (Table 9 and Table 13). The main quality indicator of a neural network is its generalization ability, its ability to predict accurately the output of unseen data. The experimental versus predicted values of test dataset is shown in Figure 6, as it can be observed, the predictability of ANN fits very well (r2 > 0.85).
Prediction of Global Thermal Comfort of Knitted Fabrics
Fibers and Polymers 2015, Vol.16, No.6
1427
Table 14. Summary of predicted properties responses that maximize thermal comfort index for the theme Casual in mid-season Type of comfort
Thermal comfort index
Properties Adiathermic power Thermal resistance Specific thermal resistance Porosity Front side air permeability Back side air permeability Sectional front side air permeability Sectional back side air permeability Thermal conductivity Thermal diffusivity (×10-7) Relative water vapor permeability Thermal absorbitivity Heat transfer coefficient
Coefficient of Degree of individual customer importance requirement 9.4 1 9.87 1 9.3 1 5.59 1 9.43 1 9.45 1 9.45 1 9.44 1 8.35 1 8.15 1 9.99 1 9.6 1 9.91 1
Predicted response 09.17 00.0113 14.48 84.4 1470 1455 007.39 007.31 000.0690 003.160 041.65 122.95 008.93
Comfort factor
coefficient of factor importance
FACT1
3.54
FACT2
3.13
Thermal comfort index
0.71
FACT3
1.64
FACT4
0.77
FACT5
0.57
Table 15. Stretch knitted fabric optimum parameters Knitted structure’s
Yarn composition
Yarn count (Nm)
Gauge
1×1 rib
Cotton
40
20
1×1 rib loop Lycra Lycra yarn length (cm) proportion (%) count (dtex)
Predict Structural Parameters (ANNI) In order to obtain optimal operating conditions or parameters, a mathematical description of such a process is required. There are some works which calculate optimum operating conditions using different mathematical models [45-48]. However, calculation of optimal parameters becomes sometimes difficult and requires special software, especially when process complexity is considered. This is the so called inverse problem identification which must be solved to answer the following question: what are the controlled inputs that have resulted in this given output. Recently, several applications based on inverse neural network models referred as (ANNi) were developed by several authors to optimize the performance of polygeneration systems parameters [49], to control the strategy for absorption chillers [50], to optimize the operating conditions for compressor performance [51], to optimize the operating conditions for heat and mass transfer in foodstuffs drying [52], to predict the chemical oxygen demand removal during the degradation of alazine and gesaprim commercial herbicides [53] and to optimize solarassisted adsorption refrigeration system [54]. The results of maximum global desirability (comfortstretch index) for a casual stretch knitted fabric in middle season are shown in Table 14. The overall desirability corresponding to the Comfort-
0.65
2
22
Weight per unit area (g/m2) 187.34
Thickness (mm ) 0.79
stretch index mentioned in Table 14 is 0.71. According to Harrington standards, the global desirability belongs to the interval [0.63; 0.8]. The result is acceptable and good. In addition, we can predict each response value that has contributed to the corresponding individual desirability. After we determined the best global desirability value, an Inverse Artificial Neural Network (ANNi) using ©Neuro one V12 software was applied to find the structural parameters that have contributed to that Comfort-stretch level. For the Comfort-stretch defined in Table 14, the right structural properties of stretch knitted fabrics that were optimized are described as follow in Table 15. The optimization of these inputs can facilitate the job of the development service in textile industry also manufacturing of the stretch knitted fabrics.
Conclusion In this study, an effort has been made to, first of all, conceive a global thermal comfort index using a clustering and factor analysis combined with a mathematical function based on the desirability functions for evaluating the subjective thermal clothing comfort from the objective measurement of physical properties of fabric. Secondly set up an optimal ANN-based model using the “Leave One Out” approach and small-scaled models to predict the global
1428
Fibers and Polymers 2015, Vol.16, No.6
thermal comfort index of stretch knitted fabrics according to their material, fabric construction and clothing design. Results on casual in middle season application showed that ANNi is in good agreement with target and calculated input data. Consequently, ANNi is applied to determine the optimal parameters, and it already has applications in different processes with a very short elapsed time (seconds). Therefore, this methodology can be useful for industrial and designers to anticipate the consumers thermal comfort perception and get the optimum combination of operating parameters and intrinsic features of yarn and fabric to attain a desired value before the actual manufacturing the knitted fabrics.
Faten Fayala et al.
22. 23. 24. 25. 26. 27.
References
28.
1. Y. Li, “The Science of Clothing Comfort”, p.135, The Textile Institute, UK, 2001. 2. N. R. S. Hollies and R. F. G. Goldman, “Clothing ComfortInteraction of Thermal, Ventilation, Construction and Assessment Factors”, p.189, Ann Arbor Science Publishers, Michigan, 1975. 3. K. Slater, J. Text. Inst., 77, 157 (1986). 4. Y. Li, Text. Prog., 31, 1 (2001). 5. H. Zhang, Ph. D. Dissertation, UCB, Berkeley, 2003. 6. D. A. Watkins and K. Slater, J. Text. Inst., 72, 11 (1981). 7. M. S. Parmar and S. K. Srivastava, Ind. J. Fiber. Text. Res., 24, 41 (1999). 8. L. Schacher, D. C. Adolphe, and J. Y. Drean, Int. J. Cloth. Sci. Tech., 12, 84 (2000). 9. M. J. Pac, M. A. Bueno, and M. Renner, Text. Res. J., 71, 806 (2001). 10. B. Le Pechoux, R. M. Laing, Y. Li, A. Bookset, T. K. Ghosh, and G. G. Sleivert, “The Science of Clothing Comfort”, p.138, The Textile Institute, Manchester, 2001. 11. N. Ozdil, A. Marmarali, and D. Kretzschmar, Int. J. Therm. Sci., 46, 1318 (2007). 12. A. Das and S. M. Ishtiaque, J. Text. Appar. Tech. Manag., 3, 1 (2004). 13. G. Ozçelik, A. Çay, and E. Kirtay, Fibres Text. East. Eur., 15, 55 (2007). 14. N. Ucar and T. Yilmaz, Fibres Text. East. Eur., 12, 34 (2005). 15. N. Oglakcioglu and A. Marmarali, Fibres Text. East. Eur., 15, 94 (2007). 16. R. Ciukas, A. Jovita, and K. Paulius, Fibres Text. East. Eur., 18, 89 (2010). 17. G. D. Šajn, K. Dimitrovski, and K. M. Bizja, Text. Res. J., 82, 1498 (2012). 18. S. Tezel and Y. Kavusturan, Text. Res. J., 78, 966 (2008). 19. S. B. Stankovic, D. Popovic, and G. B. Poparic, Polym. Test., 27, 41 (2008). 20. C. A. Pavko and E. U. Stankovic, Acta Chim. Slov., 57, 957 (2010). 21. S. E. G. Jeguirim, A. B. Dhouieb, M. Sahnoun, M.
29. 30. 31. 32. 33. 34. 35. 36. 37. 38. 39. 40. 41. 42. 43. 44. 45. 46. 47. 48. 49.
Cheikhrouhou, L. Schacher, and D. Adolphe, J. Intell. Manuf., 22, 873 (2011). D. Bhattacharjee and V. K. Kothari, Text. Res. J., 77, 4 (2007). F. Fayala, H. Alibi, A. Jemni, and X. Zeng, J. Eng. Fiber. Fabr., 3, 53 (2008). A. Majumdar, J. Text. Inst., 102, 752 (2011). H. Alibi, F. Fayala, A. Jemni, and X. Zeng, Special Topics & Reviews in Porous Media, 3, 35 (2012). H. Alibi, F. Fayala, A. Jemni, and X. Zeng, J. Appl. Sci., 12, 2283 (2012). H. Alibi, F. Fayala, N. Bhouri, A. Jemni, and X. Zeng, J. Text. Inst., 1, 1 (2013). A. S. W. Wong, Y. Li, and P. K. W. Yeung, Text. Res. J., 71, 31 (2003). A. S. W. Wong, Y. Li, and P. K. W. Yeung, Fiber J., 59, 11 (2003). A. S. W. Wong, Y. Li, and P. K. W. Yeung, Text. Res. J., 74, 13 (2004). A. S. W. Wong, Y. Li, P. K. W. Yeung, and P. W. H. Lee, Text. Res. J., 73, 31 (2003). C. Vigneswaran, K. Chandrasekaran, and P. Senthilkumar, Ind. Text. J., 38, 289 (2009). A. Koblyakov, “Laboratory Practice in the Study of Textile Materials”, p.384, Mir Publishers, Moscow, 1989. B. Das, V. K. Kothari, R. Fanguiero, and M. De Araujo, Fiber. Polym., 9, 225 (2008). L. Hes, Vlakna a Textil, 7, 91 (2000). L. Hes, Int. J. Cloth. Sci. Tech., 11, 105 (1999). L. Hes, J. Hanzl, I. Dolezal, and Z. Miklas, Melliand Text. Int., 71, 679 (1990). L. Hes and I. Dolezal, J. Text. Mash. Soc. Jpn., 42, 124 (1989). N. Ucar and T. Yilmaz, Fibres Text. East. Eur., 12, 34 (2005). G. Derringer and R. Suich, J. Qual. Technol., 12, 214 (1980). Y. Oussar, G. Monari, and G. Dreyfus, Neural Comp., 16, 419 (2004). G. Monari and G. Dreyfus, Neural Comp., 14, 1481 (2002). F. Fayala, H. Alibi, A. Jemni, and X. Zeng, Fiber. Polym., 15, 855 (2014). M. Tushir and S. Srivastava, Appl. Soft Comp., 10, 381 (2010). U. Teeboonma, J. Tiansuwan, and S. Soponronnarit, J. Food. Eng., 59, 369 (2003). J. R. Dutta, P. K. Dutta, and R. Banerjee, Process Biochem., 39, 2193 (2004). D. S. Lee and Y. R. Pyun, Dry. Technol., 11, 1025 (1993). D. M. Elustondo, A. S. Mujumdar, and M. J. Urbicain, Dry. Technol., 20, 381 (2002). J. A. Hernández, D. Colorado, O. Cortés-Aburto, Y. El Hamzaoui, V. Velazquez, and B. Alonso, Appl. Therm. Eng., 50, 1399 (2013).
Prediction of Global Thermal Comfort of Knitted Fabrics
50. J. Labus, J. A. Hernández, J. C. Bruno, and A. Coronas, Renew. Energy, 39, 471 (2012). 51. O. Cortés, G. Urquiza, and J. A. Hernández, Appl. Energy, 86, 2487 (2009). 52. J. A. Hernández, Food Control, 20, 435 (2009).
Fibers and Polymers 2015, Vol.16, No.6
1429
53. Y. El Hamzaoui, J. A. Hernández, S. Silva-Martínez, A. Bassam, A. Álvarez, and C. Lizama-Bahena, Desalination, 277, 325 (2011). 54. M. Laidi and S. Hanini, Int. J. Refreg., 36, 247 (2013).