IEEE TRANSACTIONS ON MICROWAVE THEORY AND TECHNIQUES, VOL. 61, NO. 1, JANUARY 2013
587
A New Method for Matching Network Adaptive Control Qizheng Gu, Senior Member, IEEE, and Arthur S. Morris, III, Senior Member, IEEE
Abstract—This paper presents a novel direct calculation method for matching network adaptive control utilizing an analytic algorithm based on an integrated measurement of load impedance. In principle, this approach has no limitations on the match tuned load impedance and the operating frequency, but in practice its operation is restricted by the matching network tolerances and the accuracy and dynamic range of the load impedance measurement circuitry. The matching network consisting of microelectromechanical systems tunable capacitors and high- fixed inductors is one of the best choices for this loop since it has a broad match tuning range across loads condition and frequencies. Index Terms—Adaptive control, algorithm, load impedance, matching network, microelectromechanical systems (MEMS), tunable capacitor.
I. INTRODUCTION
T
HE DEMAND for tunable RF devices is drastically increasing since cellular systems are operating in more than 14 bands over 2-GHz bandwidth from 700 to 2700 MHz. Multiband cellular handsets are using tunable matching networks with their antennas to improve efficiency over the operating bands since the handset antenna size is constrained by consumer preference leading to narrowed operating bandwidths. To make the tunable matching network fully effective, the matching network should be dynamically tuned to track the handset antenna impedance variation caused by environment change around the antenna, including human hand and body effects. At present, the commonly used approaches for dynamic tuning matching network include the following. The simplest method referred to as open loop utilizes a lookup table developed from certain pre-knowledge. While this addresses the multiband issues, it cannot provide accurate match tuning that accounts for component and environmental variation. The closed loop control approach most commonly used minimizes the input reflection or voltage standing-wave ratio (VSWR) of the matching network using a loop configuration, as shown in Fig. 1 [1]–[4]. The control unit is run iteratively until a best matching solution is achieved with the tuning trajectory controlled by an optimization algorithm. Key drawbacks of this Manuscript received September 18, 2012; accepted November 13, 2012. Date of publication December 11, 2012; date of current version January 17, 2013. This paper is an expanded paper from the IEEE MTT-S International Microwave Symposium, Montreal, QC, Canada, June 17–22, 2012. The authors are with Wispry Inc., Irvine, CA 92618 USA (e-mail: qizheng.
[email protected];
[email protected]). Color versions of one or more of the figures in this paper are available online at http://ieeexplore.ieee.org. Digital Object Identifier 10.1109/TMTT.2012.2230022
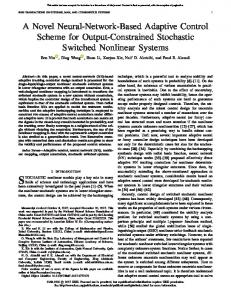
Fig. 1. Block diagram of most commonly used closed loop for matching network control.
approach to closed loop control include the long convergence time to achieve an acceptable result and significant risk of mistuning due to jamming from other sources or being trapped in local minima, especially with complex tuner circuits. Additionally, for a practical matching network with loss, minimizing the input reflection or VSWR of the network will not achieve the maximum power transfer, which is the prime objective for most applications. In [5], the adaptive tuning for compensating antenna mismatch based on conjugate match is carried out by using -networks and associated impedance measurements. However, this adaptive tuner has considerable limitations since an -network can only achieve a conjugate match over half of the Smith chart even if the tuning range of the adjustable components and are from zero to infinity [6]. With finite tuning range, the region for the conjugate solution will be further significantly reduced. In addition, the conjugate match in [5] is implemented by circuitry hardware, which limits flexibility in the antenna used with this adaptive tuning approach. This paper presents a novel general method for adaptive match tuning by means of an analytic algorithm and a new load impedance measurement method. This approach directly yields the tuner setting that will deliver the maximum power to the load without iteration. The operating frequency region and the match tuning capability of the adaptive control are directly and entirely determined by the matching network and the load impedance sensing circuitry. The example matching network used in this adaptive control is constructed by using microelectromechanical systems (MEMS) tunable capacitors and highfixed inductor. Note that this approach can be applied to any type of matching network as long as the corresponding set of equations in the algorithm can be derived. This paper builds on our earlier work [7] to provide more detailed discussions, algorithm new formulas, and simulation results. In addition, a practical prototype for the matching network adaptive control
0018-9480/$31.00 © 2012 IEEE
588
IEEE TRANSACTIONS ON MICROWAVE THEORY AND TECHNIQUES, VOL. 61, NO. 1, JANUARY 2013
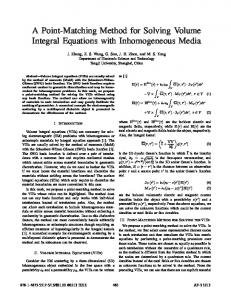
Fig. 2. Block diagram of analytic algorithm based adaptive matching network control.
is presented, and this new control method is validated by tested data. II. SYSTEM DESCRIPTION OF ALGORITHM-BASED ADAPTIVE CONTROL The block diagram of the analytic algorithm based adaptive matching network control system is depicted in Fig. 2, where a Pi network is employed as the matching network for an example. The optimal tuning words for the matching network to provide either conjugate match or maximizing power transfer are found directly within hundreds of microseconds when the load/antenna impedance is measured and updated. The load/antenna impedance can be calculated by utilizing (1) and by measuring transmission signal voltages at the input and output ports of the matching network, and (see the Appendix), (1)
and are the series admittance and the load side In (1), admittance of the Pi network, respectively, as shown in Fig. 2. The input to output complex voltage ratio can be measured by using log amplifiers, a voltage comparator, and a phase detector, as depicted on the left-hand side of Fig. 2. The measured magnitude and phase are then digitized and sent to a microprocessor for computations. Note that since any linear two-port can be represented as a Pi network, this approach can be applied to more complex tuners if the corresponding equations can be derived. Also note that an section is a special case of the Pi configuration, and thus the same approach may be used, albeit providing a restricted tuning range. The algorithm calculates the optimal tuning words, i.e., the setting values of the MEMS tunable capacitors, , , and based on the computed load/antenna impedance. The MEMS
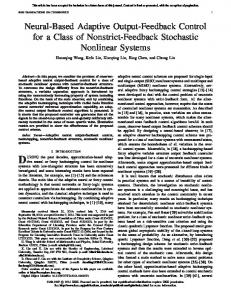
Fig. 3. (a) Capacitor bridged double Pi network. (b) Its Pi network equivalence.
tunable capacitors in the matching network are then actuated according the desired setting values through a control SPI interface unit. No iteration is required, except as needed to track variations in load impedance. III. DESIGN CONSIDERATION OF KEY BLOCKS The adaptive tuning system consists of a tunable matching network, the load impedance sensing and computation circuitry, and the analytic algorithm. The target of developing this adaptive control system is for the applications in cellular mobile stations. However, to rapidly verify this new control method, an existing tuner operating in frequency range from 300 to 500 MHz is used in the prototype design, analysis, and assembly to use available off-the-shelf discrete components. In addition, we should note that the tuning algorithm is only matching network configuration dependent, and therefore the algorithm based adaptive control method operates over a wide frequency range limited only by the network component capability and the applicability of the tuner model. A. Tunable Matching Network To increase the tuning frequency range and to maximize the matched area across the Smith chart, the tunable matching network is chosen as a Pi network or modified Pi configuration. A capacitor bridged double Pi network, as shown in Fig. 3(a), is utilized with its Pi network equivalent given in Fig. 3(b). The MEMS tunable matching networks with this configuration can achieve more than 85% frequency tuning range, for example, from 200 to 500 MHz or from 800 to 2200 MHz. They can match the load having the reflection coefficient up to 0.9 when properly designed and yield efficient power transfer based on the resulting transducer gain or transducer gain improvement referred to as relative transducer gain . The relative transducer gain of the Pi network in Fig. 3(b) has an expression, shown in (2), at the bottom of the following page
GU AND MORRIS: NEW METHOD FOR MATCHING NETWORK ADAPTIVE CONTROL
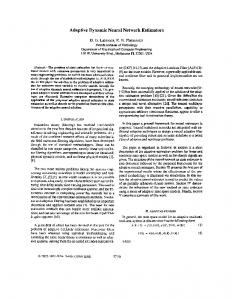
Fig. 4. (a) Practical capacitor bridged double Pi network equivalent circuit. (b) Its Pi network equivalence.
(see the Appendix), when the load reflection coefficient is and source impedance , where
and
and
(3)
and
(4) (5)
For the analytical tuning algorithm based dynamic matching control and the load computation, it is necessary to have an accurate lumped circuit model of the Fig. 3(a) matching network with MEMS tunable capacitors. The true circuit topology of a practical matching network with MEMS tunable capacitors is not exactly the same as Fig. 3(a) since the network MEMS elements and package have parasitics, which may impact the network matching performance considerably. These parasitics can be extracted by a modeling approach described in the following paragraphs. The true equivalent circuit of a practical capacitor bridged double Pi network consisting of tunable MEMS capacitors is presented in Fig. 4(a), where each tunable capacitor contains a series parasitic inductance ( and ), and its Pi network equivalent circuit is given in Fig. 4(b). The analytic tuning algorithm and the load impedance computation are developed based on this practical equivalent circuit.
589
To develop an accurate circuit model of practical matching networks with MEMS tunable capacitors, the following approach is proposed. The actual value and tuning range of the tunable MEMS capacitors in the network may change from originally defined values due to parasitics introduced by the network construction and package. The true minimum and maximum value of the MEMS capacitors, tuning range, loss, and parasitics in a network can be determined by means of the measured frequency responses of -parameters of the matching network at different tuning states, for example, setting all tunable capacitors to their minimum or maximum values, or some capacitors in minimum and the rest capacitors in maximum, etc. In the equivalent circuit shown in Fig. 4(a), there are a total of 16 values or unknowns needing to be determined by the modeling. They are four of MEMS capacitor and ( and ) values, actual series inductor , and four of parasitic inductors ( and ), plus three factors, respectively, for the MEMS capacitors, series inductor, and parasitic inductor. We thus need six tuning states, i.e., all tunable capacitors in their minimum value and maximum value states plus four states of one capacitor in the maximum value and the rest three capacitors in the minimum values. The measured , , and frequency response curves in six states are equivalent to defining 18 equations and they are enough for determining 16 unknowns. In modeling, modifying all 16 values of the equivalent circuit makes the -, -, and -parameter frequency responses generated by the circuit model being able to well match the measured ones at the same tuning state. Comparison examples of the -parameter frequency responses resulting from the matching network circuit model and from measurements are given in Fig. 5(a) and (b), respectively, for the tuning states of all tuned to their minimum and maximum values. The accuracy of the circuit model will be validated in Sections III-B and III-C. The load impedance computation based on (1) needs a more accurate circuit model than the required by the tuning algorithm since the load impedance computation inaccuracy will also directly impact the algorithm calculation results. B. Load Impedance Measurement Circuitry The block diagram of the load impedance measurement circuitry has been given in Fig. 2. Several factors need to be carefully considered. The composite input impedance of the log amplifiers must be high enough to limit power losses at the input and output ports of the matching network to less than 20 dB relative to the power in the main transmission path. This may be implemented by using a high input impedance operational amplifier or a high impedance passive divider.
(2)
590
IEEE TRANSACTIONS ON MICROWAVE THEORY AND TECHNIQUES, VOL. 61, NO. 1, JANUARY 2013
Fig. 6. Example of magnitude and angle variations of verses the (or 10:1 VSWR) load at 400 MHz. load reflection phase for a dB and Max. .
TABLE I RESULTING FROM THE MEASURED -PARAMETERS COMPARISON OF OF THE NETWORK AND OBTAINED FROM THE CIRCUIT MODEL
Fig. 5. -parameter frequency response comparisons of resulting from the matching network circuit model and from measurements for the states of all tunable capacitor tuned in: (a) minimum values and (b) maximum values.
The operation range of this load impedance sensing circuitry should meet the requirement of the transmission power dynamic range. In fact, the operation range of this circuitry not only depends on the transmission power dynamic range, but also on the variation range of the voltage ratio . For the network of Fig. 3(a), the variation of in the match condition is approximately 25 dB when the load reflection coefficient is 0.82 or . The magnitude and angle variations of verses the load reflection phase for a load is depicted in Fig. 6. The output of the magnitude comparator in this circuitry is in logarithm scale, i.e., (where is the logarithm base, usually equal to 10), which needs to be converted into linear scale by (6) before using (1) to compute load impedance
(6) resulting from the measured -paA comparison of rameters of the network with all capacitors in the off condition or ( and ) and obtained from the circuit model computation at 400 MHz is given in Table I. This table shows what kind of accuracy can be achieved by the circuit model for the load reflection coefficient equal to 0.82 or .
C. Analytic Match Tuning Algorithm The analytic algorithm for the tunable matching networks of the capacitor bridged double Pi or Fig. 3(a) type can be developed from the algorithm detailed in [8] solving the conjugation (7) and (8) (7) and (8) where and are the real and imaginary parts of the matching network input impedance, respectively, and and are the real and imaginary parts of the source impedance, respectively. The corresponding solutions can be derived by using the method given in [8] when the value is chosen within its tunable range and considering that the three tunable capacitors in the equivalent Pi network is , , and . In fact, the solutions of (7) and (8) are not unique and do not always exist for having finite tuning range within and ( and ). In the cases without direct solutions, the analytic derivative equations as given in (9) are then solved. From multiple possible solutions, is individually calculated and the solution giving the maximum is finally chosen for achieving the maximum power transfer to the load (9)
GU AND MORRIS: NEW METHOD FOR MATCHING NETWORK ADAPTIVE CONTROL
591
From (2) and (9), we can derive the solutions, , , and for maximizing power transfer, and they are expressed in (10)–(12), respectively, at the bottom of this page, where (13) (14) (15)
Fig. 7. Equivalent Pi network.
(16) (17) (18) (19) (20) (21) (22) The analytical algorithm presented in [8] can be completely utilized for the Fig. 4 network if doing the following modifications. The series capacitance and inductance ( and ) are replaced by equivalent capacitance having expressions as (23) The three equivalent capacitance ( equivalent Pi network, as depicted in Fig. 7,
and ) in an
(24) (25) and (26)
Fig. 8. Comparison of resulting from the algorithm and from the opdB and average timizer simulations at 500 MHz. Average dB.
The new developed algorithm based on [8] and the above conversions is validated by comparisons between results obtained from this algorithm and optimizer simulations, as well as measurement results. For examples, the calculated by using the algorithm and the simulated by utilizing an MWO optimizer for the load impedance over the Smith chart for and phase from 180 to 180 at 500 MHz are shown in Fig. 8. A practical tuner under loadings as described above has been tuned in the laboratory by using a Labview optimizer and its was measured. A comparison between resulting from the algorithm and from the laboratory auto-optimizing tuning at 300 MHz is presented in Fig. 9. The average results from 720 loads with reflection coefficient magnitude from 0.5 to 0.9 and phase from 180 to 180 for a configuration [see Fig. 3(a)] tuner at 300 MHz
(10) (11) (12)
592
IEEE TRANSACTIONS ON MICROWAVE THEORY AND TECHNIQUES, VOL. 61, NO. 1, JANUARY 2013
Fig. 9. Comparison of resulting from the algorithm and from the lab dB and avauto-optimizing tuning at 300 MHz. Average dB. erage
Fig. 10. Tuner board operating in frequency range from 300 to 500 MHz.
TABLE II AND USED TIME FOR RESULT FROM COMPARISON OF AVERAGE ALGORITHM, SIMULATION, AND LABORATORY TUNING FOR FIG. 3(a) NETWORK
are presented in Table II. These results also indirectly validate the circuit model developed by using approach given in Section III-A.
IV. IMPLEMENTATION OF PROTOTYPE ADAPTIVELY CONTROLLED TUNER A prototype of this adaptive tuner system has been constructed utilizing off-the-shelf sensing components. The tuner used in the system is shown in Fig. 10. The equivalent circuit of this tuner is the circuit in Fig. 4(a) plus two-shunt 47-nH inductors placed at its input and out ports. The shunt MEMS tunable capacitor pF and pF, the series tunable capacitor pF, and the tuning ratio is 10, and the MEMS capacitor at 400 MHz. The series inductor is 8.7 nH, and the factor of the external lumped inductor is 55–60. The parasitic inductance in the shunt MEMS capacitor is around 0.35 nH, but the parasitic inductance in the series MEMS capacitor may be up to 2 nH due to long routing in this UHF four-chip prototype. A block diagram of the prototype discrete implementation is presented in Fig. 11. The dividing ratio and impedance are determined by the system operation power dynamic range, as well as the input impedance and dynamic range of the AD8302 detector. The ADI AD8302 has a 60-dB input power dynamic range from 60 to 0 dBm. Two channels of a National Instrument USB6009 ADC are used for 14-bit magnitude and phase digitization. This prototype adaptive system update speed is around tens of milliseconds, including host computer overhead.
Fig. 11. Block diagram of discrete implementation of the prototype adaptive tuner system.
A. Calibration of
Detection Circuitry
To have accurate load impedance computation results, the detection circuitry needs to be calibrated. For a defined setting of the matching network, say, all MEMS capacitors in Fig. 4(a) network set to their minimum values, ( and ), the -parameters of this network can be accurately measured. Utilizing these -parameters, a reference data table or plot of the magnitude and phase versus reflection coefficient phase can be generated by simulations. One of the reference data plot for the calibration of the detection circuitry and the corresponding tested results for the load at 400 MHz are depicted in Fig. 12. can be directly measured by using the setup shown in Fig. 13. The Maury tuner generates a defined reflection coefficient and the magnitude and phase are obtained from the detection circuitry. Comparing the directly measured with the reference data, we can then build up calibration lookup tables at typical frequencies. B. Error Analysis of Load Impedance Detection From (1), we know that the load impedance is determined by , , and . It is apparent that the load impedance detection error will cause the match tuning error. The tolerance of
GU AND MORRIS: NEW METHOD FOR MATCHING NETWORK ADAPTIVE CONTROL
Fig. 12. Reference data plot for the calibration of at 400 MHz. and tested results for load
593
detection circuitry Fig. 15. Perform verification test setup of the adaptive control loop.
C. Loop Performance Verification
Fig. 13. Test setup for the calibration of
detection circuitry.
Fig. 14. Test setup for the calibration of
detection circuitry.
the load impedance detection error depends upon the requirement of the allowed matching error compared with the optimal tuning result. A simulated relative transducer gain error plot due to the load impedance detection error for the Fig. 4(a) network with a load at 400 MHz is presented in Fig. 13. The average relative transducer gain for the Fig. 4(a) MEMS network with a load at 400 MHz is approximately 3 dB. If the allowed maximum degradation is 0.3 dB, from Fig. 14, the load impedance detection error shall be 10% or less. However, this is not a general case error analysis, and the error curve distribution depends on load magnitude, matching network configuration, and frequency. Future analyses will explore the error budgets in detail.
The performance verification of this matching network adaptive control loop can be carried by means of the test setup presented in Fig. 15. The PC sets the Maury tuner to create a load with a defined reflection coefficient magnitude and phase at a given frequency. The initial setting of the tuner is always at all tunable capacitors having ( and ) when tuning the tuner for a given new load. The load impedance is first measured by the load detection sensor, the tuner is optimally tuned by the Labview based tuning algorithm, and from the tuner input to the Maury tuner output, which is the transducer gain of the tuned tuner, is then measured. For a given load, this setup can run simulations of the tuner board circuit model in the Labview program simultaneously, and reports the simulated load impedance result and predicts the transducer gain resulting from the algorithm tuning the tuner model. The predicted model , thus, can be used as one of verification criteria of the matching network adaptive control performance, i.e., comparing the measured from the practical tuning result with this predicted . Alternatively, to reduce the setup system insertion loss calibration error, the improvement, , defined in (27), is used for the verification of the adaptive control performance. At the present, the initial state of the tuner is all capacitors in ( and ) before tuning. Comparisons of the tested from the practical loop and the predicted from the algorithm tuning model result at 400 and 500 MHz are depicted in Figs. 16 and 17, respectively. The load reflection coefficient magnitude and phase is referred to the Maury tuner setting (27) Figs. 16 and 17 show that obtained from the tests matches obtained from the model prediction reasonably well for a prototype matching network adaptive control loop. The slight discrepancy may be caused by multiple factors, such as modeling error, system calibration error including the Maury tuner calibration error, impedance detection, and other hardware imperfections, etc.
594
IEEE TRANSACTIONS ON MICROWAVE THEORY AND TECHNIQUES, VOL. 61, NO. 1, JANUARY 2013
Fig. 18. Equivalent circuit for (1) derivation.
Fig. 16. Comparison of diction at 400 MHz.
improvements resulting from test and from pre-
receiver frequencies is known. Finally, this loop can work a very broad frequency range and match the load having up to a reflection coefficient of 0.9 in all angles depending upon the matching network design. This is, in fact, the most practical method to implement the matching network adaptive dynamic control. APPENDIX DERIVATION OF (1) AND (2) Formula (1) can be easily derived from Fig. 18 as follows: (A1) (A2) (A3) From (A3) and
, we drive (1) (1')
Fig. 17. Comparison of diction at 500 MHz.
improvements resulting from test and from pre-
Note that the insertion loss of this tuner including the load impedance sensing is 0.26–0.28 dB at the 300–500-MHz frequency range. Thus, a negligible 50- loss penalty is incurred to insert the tuner into an overall system.
The relative transducer gain with the -parameters of the Pi matching network (Fig. 18) has the following expression (A4): (A4) where (A5)
V. CONCLUSIONS The analytic algorithm approach for the matching network dynamic control has distinct advantages as follows. It is far faster than a control loop using iterative optimizer. Using computer simulations, the analytic algorithm is more than 1000 times faster than an iterative optimizer. This approach can rapidly track the load/antenna impedance variation, and update the matching network in real time. It is based on maximizing the power transfer to load instead of minimizing the input reflection coefficient or VSWR, which most previous matching network control loops have done. It is also, within its dynamic range, insensitive to absolute signal levels, which may be varying due to other system control. In addition, the receiver side matching can be take into account by using this method if the correlation of the load characteristics at transmitter and
is a reference impedance, which is usually defined as and 50 . and in (A4) for the network in Fig. 18 can be expressed as (A6) and (A7), respectively,
(A6) and (A7) In (A6) and (A7), we have (A8)
GU AND MORRIS: NEW METHOD FOR MATCHING NETWORK ADAPTIVE CONTROL
595
(2')
Substituting (A7) and (A8) into (A4), after manipulation we obtain (2’), shown at the top of this page. ACKNOWLEDGMENT The authors would like to acknowledge J. Hilbert, for providing us with the opportunity to work on these projects and his constant encouragement. The authors are indebted to Victory Steel management supports. Special thanks to K. Carpenter, for his effort in tuner prototyping and tuner adaptive control system measurements. REFERENCES [1] O. Sung-hoon, H. Song, J. T. Aberle, B. Bakkaloglu, and C. Chakrabarti, “Automatic antenna tuning unit for software-defined and cognitive radio,” in IEEE Int. AP-S Symp., 2007, pp. 85–88. [2] J. S. Fu, X. A. Zhu, J. D. Phillips, and A. Mortazawi, “A ferroelectricbased impedance tuner for adaptive matching applications,” in IEEE MTT-S Int. Microw. Symp. Dig., 2008, pp. 955–958. [3] K. B. de Brito and R. N. de Lima, “Impedance network for an automatic impedance matching system,” in Asia–Pacific Microw. Conf., 2007, pp. 1–4. [4] J. de Mingo, A. Valdovinos, A. Crespo, D. Navarro, and P. Garcia, “An RF electronically controlled impedance tuning network design and its application to an antenna input impedance automatic matching system,” IEEE Trans. Microw. Theory Techn., vol. 52, no. 2, pp. 489–497, Feb. 2004. [5] A. Bezooijen, M. A. de Jongh, F. van Straten, R. Mahmoudi, and A. van Roermund, “Adaptive impedance matching techniques for controlling L-networks,” IEEE Trans. Circuits Syst. I, Reg. Papers, vol. 57, no. 2, pp. 495–505, Feb. 2010. [6] R. Rhea, “The Yin–Yang of matching: Part 1: Basic matching concepts,” 2006, pp. 16–25. [Online]. Available: www.highfrequencyelectronics.com [7] Q. Gu and A. S. Morris, “Direct calculation method for matching network dynamic control,” in IEEE MTT-S Int. Microw. Symp. Dig., Jun. 2012, Art. ID WE2J-3.
[8] Q. Gu, J. De Luis, A. Morris, and J. Hilbert, “An analytical algorithm for Pi-network impedance tuner,” IEEE Trans. Circuits Syst. I, Reg. Papers, vol. 58, no. 12, pp. 1905–2894, Dec. 2011. Qizheng Gu (M’12–SM’12) graduated from Fudan University, Shanghai, China. He received the Ph.D. degree from Nihon University, Tokyo, Japan. From 1983 to 1993, he was a Visiting Scientist and then a Research Scientist with the Research Laboratory of Electronics, Massachusetts Institute of Technology (MIT) . Since 1993, he has worked in industry with Pacific Science Communications Inc. (“PCSI”), and then with Rockwell Semiconductor System, San Diego, CA. In 1998, he joined the Research and Development Center, Nokia Inc., San Diego, CA, where he was a Technology Fellow of RF System Architecture and Engineering. He is currently with WiSpry Inc., Irivne, CA, where he is a Director of RF Systems Architecture. He has authored three books and many journal papers, including RF systems Design of Transceivers for Wireless Communications (Springer, 2005). He has also authored two books in Chinese. He holds or has applied for over eight patents in the RF system architecture area.
Arthur S. Morris III (S’89–M’91–SM’04) received the B.S. degrees in physics and electrical engineering and M.S. and Ph.D. degrees in electrical engineering from North Carolina State University (NCSU), Raleigh, in 1983, 1986, and 1993, respectively. As a Scientist/Engineer concentrating on physical electronics and electromagnetic fields for over 30 years, he has contributed to device technologies ranging from traveling-wave tubes to millimeter-wave heterojunction bipolar transistors and has developed products for markets from high-voltage instrumentation to broadband communication systems. In 1999, he joined Coventor, to lead software and hardware development to drive the transition of MEMS and microsystems from the laboratory into products for RF and optical applications. A cofounder of WiSpry, Irvine, CA, which spun out of Coventor in 2002, he is the Chief Technical Officer (CTO) and leads the development of programmable RF products for high-volume markets utilizing MEMS, CMOS, and microstructures. He is an Adjunct Professor with NCSU. Dr. Morris is a member of Phi Kappa Phi, Eta Kappa Nu, and Tau Beta Pi.