Data Science and Advanced Analytics. (DSAA), 2014 International Conference on. 2014, pp. 270-276. [10]. Zarkadis, N., Ridi, A. and Morel, N. A multi-sensor ...
A NOVEL OCCUPANT-ADAPTED AND FUZZY LOGIC-READY VISUAL COMFORT MODELLING APPROACH USING MACHINE LEARNING ALGORITHMS N. Zarkadis; N. Morel; J.-L. Scartezzini Solar Energy and Building Physics Laboratory (LESO-PB), Ecole Polytechnique Fédérale de Lausanne (EPFL), Station 18, CH-1015 Lausanne /Switzerland
ABSTRACT
In this article we present a novel approach to model visual comfort based on supervised statebased machine learning with Hidden Markov Models and one easy-to-obtain variable (illuminance measurements at the horizontal work-plane; Edesk ). Data mining was performed on sensor data recorded for two years in a single-occupant office room and the developed model classifies workplane illuminances into 3 states: comfort; discomfort because of low light; discomfort because of excessive light. Results show that a training period of 4 to 8 months of recorded data leads to a visual comfort identification (classification) accuracy of 100%. When training the model using 4-month data, an overall 92% accuracy can be achieved (75% for the ‘discomfort because of low light’ state). Following further analysis of this occupant-adapted model, we discuss the confidence (‘normalised relative likelihood’) with which the model classifies illuminances in one of three different states as a function of the Edesk . We argue that the resulting metrics are an ideal input which can be readily used into automatic lighting controllers based on fuzzy logic. Last, the model’s performance is compared and validated against state-of-the art classifiers such as Bayesian and k-Nearest Neighbors. Keywords: visual comfort, machine learning, Hidden Markov Models, fuzzy logic, lighting control INTRODUCTION
Light has important visual and non-visual effects on humans so the provision of good lighting conditions inside buildings is central in shaping a healthy and productive indoor environment [1; 2]. The estimation of the lighting quality in buildings has been the subject of continuous research since the 1950s and since then methods and indices have been developed focusing on the estimation of discomfort glare due to daylight [3 pp. 108-112]. However, no one method is accepted as a standard internationally. Further, most of them suffer from inherent limitations: they require detailed information on the occupant’s field-of-view which is usually acquired by means of extensive hardware and software equipment; they address an “average user” without taking into account individual needs and preferences; they often output numbers that are non-intuitive and are difficult to interpret; they only estimate discomfort glare without addressing discomfort caused by insufficient or excessive lighting conditions. In the presented research we attempt to tackle these limitations by using machine learning techniques such as Hidden Markov Models (HMM). HMM are state-based stochastic approaches that can be used for modelling of complex systems via machine learning. They find applications in domains such as speech and handwriting recognition, biometric authentication and financial time series analysis [4; 5]. More recently they have been used in building control in the fields of occupant pattern detection [6; 7] and appliance identification [8]. In HMM, the system being modelled is
CISBAT 2015 - September 9-11, 2015 - Lausanne, Switzerland
419
assumed to be a Markov process with hidden states but with visible output tokens which depend on the (hidden) state. For instance, when modelling the visual comfort variable we “cannot see” the state in which the variable is in (comfort, discomfort, etc.) but the parameters of the model (also known as observations) are visible and known (e.g. desktop illuminance or user actions with the blinds). To the best of our knowledge, this is the first attempt to model visual comfort using HMM. METHODS
In this paper we use the HMM Matlab toolbox built in the framework of the Green-Mod research project and described by Ridi et al. [9 pp. 4-5]. The data used for the machine learning and the development of the model were collected in the LESO solar experimental building from 2001 to 2008 and recorded in a MySql database [10]. Data mining was performed on sensor data recorded for two years in a single-occupant LESO office room (1347 user actions were considered out of a total 736695 database entries). Model’s description The model is consisted of (and classifies workplane illuminances into) three hidden states: Comfort, Discomfort-L (Discomfort because of Low illuminances) and Discomfort-H (Discomfort because of High illuminances). As with other generative algorithms, HMM perform the classification task by learning one model per class (state). In the presented implementation each state of the models corresponds to one of the 3 states above. The model’s topology is considered as ergodic, meaning that every state of the model can be followed or preceded by any of the other two. The training and the testing of the model is based on observations containing only one visible output token (the illuminance value at the horizontal work-plane: 𝐸𝑑𝑒𝑠𝑘 ). For the training phase, observations are labelled as one of the 3 states above (supervised training). The labelling task is based on previous research performed at the LESO solar experimental building [11]. The Edesk immediately preceding a user action resulting in a modification of the workplane illuminance (i.e. actions on the electric lighting or on the blinds) is labelled either Discomfort-L or Discomfort-H, depending whether the action resulted in an increase or in a decrease of Edesk , respectively, while the Edesk recorded immediately after the action is labelled Comfort. Depending on the observation data distribution, the considered number of Gaussians per state varies, as it is shown in the Results Section. Regarding the datasets, it should be noted that although the unprocessed illuminance measurements pulled from the database are continuous temporal signals ranging from 0 to about 3,500 lux, the filtering out and labelling processes above result in discrete, noncontinuous illuminance values recorded immediately before or after a user action. Thus, between two consecutive values in the observations dataset there is an unknown number of values filtered out. Likewise, the elapsed time between two consecutive values can be anything from a few minutes to hours or days. State identification I: Classification Once these observations datasets are prepared, their sequence is decoded and the most probable sequence of states is recovered with the use of the Viterbi algorithm. The Viterbi algorithm is a dynamic programming algorithm which computes the best state sequence (among the hidden states) that results in a sequence of observations (our training data). The algorithm tests every observation separately against each of the 3 possible hidden states and finds the most likely state that this observation sequence belongs into. It then computes and
420
CISBAT 2015 - September 9-11, 2015 - Lausanne, Switzerland
outputs the alignment (the state sequence) and the associated probability (likelihood). As Rabiner [12] explains, if 𝑄 = {𝑞1 , 𝑞2 , … , 𝑞𝑇 } is the best state sequence for a given observation sequence 𝑂 = {𝑂1 , 𝑂2 , … , 𝑂𝑇 }, we define for the model λ the best score 𝛿𝜏 (𝑖) along a single path at step t (which accounts for the first t observations) and ends in state Si,, as follows: 𝛿𝑡 (𝑖) =
𝑚𝑎𝑥
𝑞1 ,𝑞2 ,…,𝑞𝑡−1
𝑃 [𝑞1 𝑞2 ∙∙∙ 𝑞𝑡 = 𝑖, 𝑂1 𝑂2 ∙∙∙ 𝑂𝑡 |𝜆]
(1)
Where by induction: 𝛿𝑡+1 (𝑗) = [max 𝛿𝑡 (𝑖)𝑎𝑖𝑗 ] ∙ 𝑏𝑗 (𝑂𝑡+1 ) 𝑖
(2)
In the above equations, 𝑎𝑖𝑗 denotes the state transition probability between states i and j and 𝑏𝑗 represents the emission probabilities of state j. To get the actual state sequence, we keep track of the argument which maximised (2), for every t and j. This information is used by the HMM to classify the given observations into the three hidden states. The classification accuracy, which is the percentage of the correctly identified test sets, is presented in the Confusion matrices. State identification II: Confidence of identified states In the classification phase, the HMM-based model processes a given set of illuminance observations and outputs the best state that matches them. In this phase we move beyond the crisp answer and explore the confidence with which the model decides on one state over the other two. For this, the likelihood scores of the Viterbi algorithm are employed. In the HMM toolbox used, the scores are obtained via a log-likelihood and, as shown above in (1), are computed on a one-to-one basis (each observation against each state), so they are not directly comparable. To enable comparisons, a normalisation of the acquired log-likelihoods of the 3 states is performed. If 𝑋𝑖 is the log likelihood for the state 𝑖, then the normalised relative likelihood for this state is calculated as follows: 𝑋𝑖
Normalised likelihood𝑖 = 𝑒 ⁄ 3 ∑𝑖=1 𝑒 𝑋𝑖
(3)
By applying the above equation for each of the 3 identified states, we obtain for every observation set the confidence with which is classified in a state. RESULTS
This section presents the results acquired during the development of a Visual Comfort model using HMM approaches and based on horizontal plane illuminance measurements. HMM Identification accuracy The results presented in Table 1 demonstrate that 100% identification accuracy is achieved when the developed models are tested against real data collected from the same office room. Several training/testing cycles were performed, where we varied the number k of Gaussian mixtures (GMMs) and each time the observation data sets were randomly separated into either training or testing data to minimize bias. Multiple tests revealed that a training period of 4 to 8 months of recorded data is necessary to maintain the model’s accuracy at this percentage, even when using a relatively low number of k (1 to 10). Table 2 shows the best results achieved when reducing the training period (down to 4-month data). For a k=13, 92% overall identification accuracy is attained (75% for the ‘Discomfort-L’ state). Higher values of k were
CISBAT 2015 - September 9-11, 2015 - Lausanne, Switzerland
421
tested but the reduced size of the training tests resulted in non-convergence of the algorithms after a finite number of iterations. k: 1-10
Discomfort-L
Comfort
Discomfort-H
k: 13
Discomfort-L
Comfort
Discomfort-H
Discomfort-L
100
0
0
Discomfort-L
75
25
0
Comfort
0
100
0
Comfort
0
100
0
Discomfort-H
0
0
100
Discomfort-H
0
0
100
Table 1: Confusion matrix showing accuracy per Table 2: Confusion matrix showing accuracy per state (in percentages). Results were obtained using state (in percentages) with reduced training data training data corresponding to 8-20 months of (equivalent to about 4 months of observations) for observations for the GMMs with 1-10 mixtures (k). the GMMs with 13 mixtures (k).
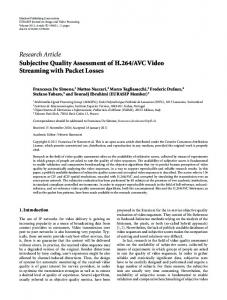
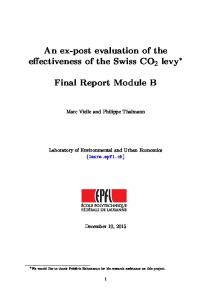
Classification The results presented in this section show the response of the developed model as a classifier of workplane illuminance values (Edesk ). We considered HMM trained with all the available observation data (24-month long) and tested against synthetic illuminance values that ranged from 0 to 3500 lux and for different GMM mixtures k ranging from 1 to 40. For k>5, the Comfort state identification pattern is stabilised in the region between 500 and 1300 lux while illuminances below and above this zone are consistently classified as Discomfort-L and Discomfort-H, respectively (Figure 1). Models with k>15 produce more fine results and reveal subtleties that include a visual comfort zone on and slightly past the 1500 lux mark. However, these subtleties do not prevail among all the tested models hence they do not appear on the mean classification results of all the models illustrated in Figure 1, which summarizes the outcome of the 1400 testing cycles1. 0
500
1000
1500
2000
2500
3000
3500
[lux] Discomfort-L
Comfort state
Discomfort-H
Figure 1: Visual comfort classification of 𝐸𝑑𝑒𝑠𝑘 values for 35 different HMM with a k ranging from 1 to 40 (results do not include HMM with k equal to 24-26, 34 and 40 because of non-convergence). DISCUSSION
The results presented herein are very promising as they demonstrate that high-accuracy personalised visual comfort modelling can be achieved after a relatively short period of data acquisition using HMM. This, along with the classification capabilities makes the proposed approach a worthy candidate for lighting-related control applications in buildings. To validate our results, we compared our model against established, state-of-the-art classifiers. Using the same data sets, a simplified Bayesian approach was applied as detailed by Zarkadis [3 pp. 119-122]. Assuming equal priors and choosing a decision rule (threshold) of 0.4 for the visual comfort2, the Comfort state is established between the 450 and 1600 lux region, with an additional “comfort island” at around 1800 lux. By comparing this to the HMM developed (Figure 1), we notice the similarities with the principal 500–1300 lux comfort zone, as well as with the narrower one at 1500–1600 lux of several high-k HMM (k>15). In addition, similar comfort patterns were reported by Lindelöf [11 p. 100] who had also used the rule of Bayes on the same data. Comparison with k-Nearest Neighbor (k-NN) classifiers was also 1
In every test cycle, each model (40 in total) classified a set of 10 illuminance values randomly generated within a specific illuminance zone. The spectrum of 0-3500 lux was evenly distributed into 35 zones of 100 lux each. Hence, 40 𝑚𝑜𝑑𝑒𝑙𝑠 𝑥 35 𝑖𝑙𝑙𝑢𝑚𝑖𝑛𝑎𝑛𝑐𝑒 𝑧𝑜𝑛𝑒𝑠 = 1400 𝑡𝑒𝑠𝑡 𝑐𝑦𝑐𝑙𝑒𝑠. 2 We consider 𝐸𝑑𝑒𝑠𝑘 values resulting in discomfort probability equal or lower than 0.4 as part of Comfort state.
422
CISBAT 2015 - September 9-11, 2015 - Lausanne, Switzerland
attempted. For Euclidean computation distance and priors of 0.5, 0.32 & 0.18 for the Comfort, Discomfort-L and Discomfort-H classes respectively (chosen according to each class’ data representation), 40 different k-NN classifiers (with a k from 1 to 40) were trained and tested. Models with k>20 attribute a much broader spectrum to the “Comfort” class (300–2000 lux) as compared to the HMM (500–1300 lux). One can argue that this broader identified comfort zone is generally considered as a region where most people can perform their tasks comfortably, especially if the illuminances are due to natural daylight [13; 14]. On the other hand, one should also be cautious regarding the k-NN classifier: in our analysis, classification for k