September 26, 2006
14:59
Proceedings Trim Size: 9.75in x 6.5in
apbc141a
A PROBABILISTIC METHOD TO IDENTIFY COMPENSATORY SUBSTITUTIONS FOR PATHOGENIC MUTATIONS
B. C. EASTON AND A. V. ISAEV Department of Mathematics, Mathematical Sciences Institute, Australian National University, Canberra, ACT 0200, Australia E-mail:
[email protected] G. A. HUTTLEY AND P. MAXWELL Computational Genomics Laboratory, John Curtin School of Medical Research, Australian National University, Canberra, ACT 0200, Australia Complex systems of interactions govern the structure and function of biomolecules. Mutations that substantially disrupt these interactions are deleterious and should not persist under selection. Yet, several instances have been reported where a variant confirmed as pathogenic in one species is fixed in the orthologs of other species. Here we introduce a novel method for detecting compensatory substitutions for these so-called compensated pathogenic deviations (CPDs), incorporating knowledge of pathogenic variants into a probabilistic method for detecting correlated evolution. The success of this approach is demonstrated for 26 of 31 CPDs observed in mitochondrial transfer RNAs and for one in beta hemoglobin. The detection of multiple compensatory sites is demonstrated for two of these CPDs. The methodology is applicable to comparative sequence data for biomolecules expressed in any alphabet, real or abstract. It provides a widely applicable approach to the prediction of compensatory substitutions for CPDs, avoiding any reliance on rigid non-probabilistic criteria or structural data. The detection of compensatory substitutions that facilitate the substitution of otherwise pathogenic variants offers valuable insight into the molecular constraints imposed on adaptive evolution.
1. Introduction Recent studies on the adaptive evolution of pathogens with resistance to chemical agents have reported striking examples of correlated mutation. In the absence of the chemical agent, resistance persists in some populations despite evidence that the resistance conferring mutation comes at a fitness cost in such an environment. These studies point to the rapid succession of secondary mutations at other loci to, at least partially, ameliorate this reduction in fitness.1−7 A similar compensatory process has been observed in the Australian sheep blowfly (Lucilia cuprina), with the fitness cost of resistance to an organophosphate insecticide reduced by mutation at a second locus.8 Further evidence of such dependence has been given by the observation of several biomolecules containing compensated pathogenic deviations (CPDs) – mutations known to be pathogenic in one species (typi1
September 26, 2006
14:59
Proceedings Trim Size: 9.75in x 6.5in
apbc141a
2
cally humans), but occurring naturally in the orthologs of other species.9−12 Such variants necessitate the presence of additional compensatory mutations in either the same, or else functionally-related, biomolecules. These results allude to a key role for compensatory mutations in molecular adaptation. Several methods for detecting these and other instances of correlated evolution have been suggested,13−24 many introducing novel models of multi-site evolution. With ever increasing efforts made to understand the genetic components of disease, knowledge on pathogenic variants of human sequences has uncovered a new resource of information to such studies.9 This information was used to develop a list of criteria to identify compensatory sites for several CPDs observed in mammalian protein sequences9 (similar criteria also suggested by Ref. 10). Another approach specific to RNA molecules validates predictions based on secondary structure, with the associated variations in free energy.11 The success of these approaches confirms the value of information on pathogenic variants, but their reliance on rigid criteria and structural data limit their wider utility. We conjectured that prediction could be achieved solely from models of correlated substitution that incorporate knowledge of pathogenic variants. In this paper, we confirm this hypothesis with the identification of compensatory sites for several CPDs observed in mammalian mitochondrial transfer RNAs (mt tRNAs) and for one CPD observed in beta hemoglobin (HBB), through a method supported by a novel model for dependent evolution. 2. Materials and Methods Calculations were implemented in PyEvolve version 0.86 alpha25 . The sequence alignments and phylogenies are available from http://jcsmr.anu.edu.au/org/dmb/compgen/publications.php. 2.1. Data For each mt tRNA we used published11 alignments for 106 mammalian species, along with secondary structure annotation26 . We eliminated gaps by removing a combination of columns and sequences. Mitomap27 provides a list of point mutations that are pathogenic in the human mitochondrial genome. From this we selected 31 mutations – each found to disrupt a Watson-Crick pair in a stem of a mt tRNA, and observed in at least two species (using the above alignments, with gaps removed). Amino acid sequences for mammalian HBB were obtained from Swiss-Prot28 . These were aligned with ClustalW version 1.829 and partial sequences were deleted, leaving 123 sequences. Columns containing gaps were removed. In the human sequence the substitution V20E is documented as pathogenic.30 2.2. Reducing and recoding the data We applied the same procedure to each of the 32 CPDs mentioned above, but for explanatory purposes we describe the method for V20E in HBB. Among the 123 full sequences, we observe the pathogenic variant E in six species – Suncus murinus, Ceratotherium simum,
September 26, 2006
14:59
Proceedings Trim Size: 9.75in x 6.5in
apbc141a
3
Rhinoceros unicornis, Equus hemionus kulan, Equus caballus and Equus zebra. For these species we conjecture that some form of compensation has occurred and that the relevant substitutions are expressed in the alignment. By contrast, in the 104 sequences with a V at the site of the CPD we expect such compensatory variants to be less common. For the other species with neither V nor E at the site of the CPD, we have no expectation on the frequency of these variants and therefore removed the sequences from the alignment, leaving 110 sequences. Each site was then recoded according to an abstract two-state alphabet, with variants designated as either potentially compensatory (ρ) or non-compensatory (η). This recoding highlights those transitions that may be important, and ensures the method is applicable to sequence data expressed in any alphabet, real or abstract. At each site a variant is deemed potentially compensatory if it accompanies the CPD in one or more species, and is not found in H. sapiens (since the CPD is pathogenic in this species). For example, at site 50 we see the variants {A, N, S, T}, with T found in humans and {N, S, T} observed in species with the CPD. Therefore at site 50, {N, S} are recoded as potentially compensatory and {A, T} are recoded as non-compensatory. In Ovis aries musimon and Dasypus novemcinctus an IUPAC ambiguity was found at some sites. Ambiguities in the raw alignment were left as ambiguities when recoded, unless all of the variants they represented were recoded to a single state (in which case this state was used). The maximum likelihood procedure sums over all possibilities when dealing with ambiguities. For branch length estimation, at site 20 we recoded V as η and E as ρ. We constructed a rooted phylogeny for the species represented in the alignment by following a selection of the current literature31−41 and the Tree of Life Web Project (http://tolweb.org/tree). We sampled all lineages descended from the most recent common ancestor of humans and of those species with the CPD. Further to this, we removed one species from each pair of identical (in the recoded alignment) sequences with the same immediate ancestor. These steps were taken to reduce the computational burden. Since we measure dependence for pairs of sites, and because estimates of branch lengths would be unreliable for such pairs, we obtained the branch lengths from the entire alignment. For this we assumed that sites were independent and identically distributed, with evolution at each site (in the recoded alphabet) occurring under Felsenstein’s model42 (F81). We set the stationary motif probabilities from their relative frequencies in the alignment (but note that we do not use these values later, to measure dependence). Since the dynamics of rate heterogeneity have not been investigated in the abstract alphabet we supposed, for simplicity, that sites evolved under the same constant rate (fixed to unity). The branch lengths were deduced as the set of maximum likelihood parameter estimates. Since F81 is a reversible Markov model, this method does not resolve the position of the root between its two immediate descendants (which is needed for the dependent model).42 This was input as a free parameter to the dependent model. 2.3. Identifying compensatory sites For each site with a variant recoded as potentially compensatory, we coupled this site to the site of the CPD and measured the level of dependence shown in their evolution. This was
September 26, 2006
14:59
Proceedings Trim Size: 9.75in x 6.5in
apbc141a
4
done by scaling a likelihood ratio (LR) statistic, calculated as the ratio of the maximum likelihood of the data under a dependent model L(D) with that under a nested independent model L(I), i.e. LR = L(D) L(I) . The highest ranked site was predicted as the most likely location of compensatory substitution. Combining the approach to recoding (and possibly the novel scaling described below) with any procedure capable of detecting dependent evolution in a two-site alignment (with each site expressed in an abstract two-state alphabet) produces a similar methodology. We defer an analysis of such hybrid methods to future studies. 2.3.1. A model for dependent evolution Let P (t) denote the matrix of transition probabilities for a single independently evolving site. For this we use the analogue of F81 applied to our abstract alphabet. That is, Pij (t) = e−ut · δij + (1 − e−ut ) · πj ,
(1)
where πj is the stationary motif probability of j, u is the rate of substitution per unit time (which we henceforth assume is 1), and δij is the Kronecker delta function (δij = 1 if i = j, and 0 otherwise). Denote by α the site of the CPD and by β the potentially compensatory site. We will use superscripts α and β to indicate site-specific values. To specify evolution at α and β along a tree, we require the joint motif probabilities (that is, the probability of each pair of motifs at the ancestral root) and the subsequent transition probabilities. We denote the former by πAB (A at α, B at β) and the latter by PA7→a,B7→b (t) (AB to ab on a branch of length t ≥ 0). If α and β evolve independently, then their evolution is given by πAB PA7→a,B7→b (t)
= =
β α πA · πB β α (t) · PBb PAa (t),
(2)
with the motif probabilities at α and β provided as free parameters, subject to the constraint that they each partition 1. To account for dependence at the ancestral root we instead allow the joint motif probabilities as free parameters, and deduce the motif probabilities at α and β by α πA = πAρ + πAη
β and πB = πρB + πηB .
(3)
Similarly, we account for dependence in the transition probabilities by allowing each as a free parameter. This may be formulated equivalently by scaling the transition probabilities of the independent model with free non-negative parameters CAaBb (t), so that β α PA7→a,B7→b (t) = PAa (t) · PBb (t) · CAaBb (t).
(4)
However, with this high degree of freedom the application of the model to any data will result in severe over-fitting. Accordingly we assume that each CAaBb (t) may be decomposed into the product of two parameters: the first FAB (t), to encapsulate the effect of any , interaction between the initial states on the subsequent transitions; and the second ππαab ·π β a
b
provided as a measure of the impact of dependence on the frequency of the destination
September 26, 2006
14:59
Proceedings Trim Size: 9.75in x 6.5in
apbc141a
5
motifs ab. It then follows from the constraint that the transition probabilities partition 1, that 1 FAB (t) = P . (5) β πab α a,b∈{ρ,η} PAa (t) · PBb (t) · π α ·π β a
b
By Eqns. (3) and (5) the free parameters in the dependent model are just the joint motif probabilities, substantially reducing the possibility of over-fitting. This model of dependent evolution avoids a number of biologically unjustified assumptions that are commonly imposed for computational convenience. It does not assume that the distribution of joint motif probabilities is stationary and as such is non-reversible. The model is also non-Markovian in the sense that we do not impose the constraint that P (s + t) = P (s) · P (t). 2.3.2. Scaling the LR statistic The raw LR statistic for a two-site alignment provides some measure of the extent of dependence governing the evolution of the two sites. It is however sensitive to site-specific factors such as the frequency of motifs at each site. We used instead a scaled statistic, defined as the probability of a lower LR value if we replace the motif at one site in one species with the alternative in the recoded alphabet. As a simple example to illustrate the benefit of scaling, consider the alignments summarized in Table 1 for species related by a tree with infinite branch lengths (this is a theoretical approximation to long branches). An alignment comprised exclusively of the motif pairs ρρ and ηη shows perfect dependence. This is observed using scaled dependence values for alignments 1 to 8. If we vary the frequencies of ρρ and ηη it seems reasonable to suggest that those in which both are common provide better support for the prediction of dependence. However, all of the values taken by these alignments should exceed the values of alignments in which ηρ and/or ρη are also seen (alignments 9 to 13). With scaling this condition is satisfied, but without scaling high frequencies of ρρ and ηη obscure the impact of introducing a mismatch pair – alignments 9 to 13 do not consistently rank lower than 1 to 8 when the raw statistic is used. 3. Results and Discussion 3.1. CPDs in mt tRNAs The pathology of any point mutation which disrupts a Watson-Crick pair in a stem can be attributed to the destabilization of this stem. Any compensatory substitution should stabilize the corresponding stem and the success of our method can be measured by its recognition of such substitutions. With the exception of G7497A the method provided sufficient resolution to predict a single site as the most probable location of a compensatory substitution. This highest ranking site (i.e., the predicted compensatory site) for each CPD is shown in Table 2. For 26 of the CPDs the predicted compensatory site (one such site for G7497A) was located in the same stem. In 25 instances this site was found to be complementary to the CPD and among the most frequent substitutions accompanying the CPD at this site, we find a substitution which provides a Watson-Crick interaction in place of the disturbed pair.
September 26, 2006
14:59
Proceedings Trim Size: 9.75in x 6.5in
apbc141a
6 Table 1. Alignment 1 2 3 4 5 6 7 8 9 10 11 12 13
ρρ 8 9 10 11 12 13 14 15 8 8 8 8 8
The impact of scaling.
Motif pairs ρη ηρ 0 0 0 0 0 0 0 0 0 0 0 0 0 0 0 0 0 1 0 2 0 3 0 4 1 1
ηη 8 7 6 5 4 3 2 1 7 6 5 4 6
Scaled Yes No 1.0000 11.0904 1.0000 10.9650 1.0000 10.5850 1.0000 9.9374 1.0000 8.9974 1.0000 7.7212 1.0000 6.0283 1.0000 3.7407 0.9375 7.9509 0.8750 6.0863 0.8125 4.6449 0.7500 3.4522 0.8750 4.9547
Note: Above are the dependence values of selected 2-site alignments of 16 taxa related by a star topology with infinite branch lengths; counts of motif pairs are provided in lieu of alignments.
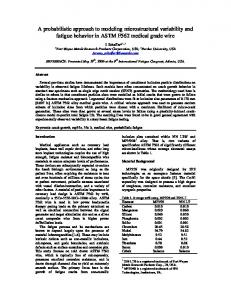
An advantage of our probabilistic approach over criteria-based methods is that we avoid the binary classification of sites as compensatory or otherwise. Instead we have a measure of the likelihood that each site contains a compensatory substitution. As an example we look to G5540A which disrupts a GC pair on the fourth rung of the anticodon stem of mt tRNA Trp. The secondary structure26 of mt tRNA Trp is given in Figure 1 along with the anticodon stems of the three species in which the mutation is observed. Only in Ursus americanus is there compensation at the complementary site 5550. Therefore the CPD must be accompanied by another compensation in Ceratotherium simum and Balaenoptera acutorostrata. In these species the sequences of the anticodon stem are equivalent and differ from that of H. sapiens only by the substitutions A5539G and G5540A, corresponding to the gain and loss of Watson-Crick interactions on rungs three and four respectively. It has been suggested therefore that the presence of a G at 5539 compensates for G5540A.11 The two highest ranking potential compensatory sites for G5540A were 5550 and 5539 (results not shown), indicating that both compensatory mechanisms were detected. 3'
a.
u
5'
a g acceptor a stem a a u u u a a a a u u g g a c a g a c c a
D-domain
5539 5540
Figure 1. species.
a g a g c c u u
g u c u u u a a
b. Homo sapiens
TΨC-domain
u u c a u a a a a g u u g c u g u c a variable loop c c c 5550 g anticodon a domain a c a
5539 5540
a g a g c
u c c c g
Ursus americanus
a g g a c
c c c u g
Balaenoptera acutorostrata
5550
a g g a c
u c c c g
Ceratotherium simum
a g g a c
u c c c g
Mitochondrial tRNA Trp. (a) Secondary structure in H. sapiens. (b) Anticodon stem in selected
September 26, 2006
14:59
Proceedings Trim Size: 9.75in x 6.5in
apbc141a
7 Table 2. CPD x site y T582C A606G A608G T618C G1606A C1624T G1642A C3256T T3258C T3271C A3280G C3303T G4298A G4309A G5540A T5628C G5703A T5814C G7497A T7510C T7512C A7543G G8342A T8355C T8356C G8361A T9997C G10014A G12147A G12183A A15924G
Frequency x y 92 8 25 76 99 2 24 77 61 42 100 2 19 84 98 4 100 2 95 7 100 2 82 19 90 7 18 79 100 3 86 8 11 86 72 3 4 95 85 15 12 88 97 7 68 17 67 31 11 87 26 70 87 13 35 61 95 2 83 12 77 23
mt tRNA F F F F V V V L1 L1 L1 L1 L1 I I W A N C S1 S1 S1 D K K K K G G H H T
CPDs in mt tRNAs. Potential compensatory sites 25 34 13 33 39 22 37 21 15 25 15 29 14 23 15 29 43 14 46 34 44 34 27 35 41 40 30 42 16 36 37
Predicted compensatory site(s) 641** 618** 627 606** 1665** 1625 1604 3239** 3274** 3261** 3245 3230** 4297* 4321** 5550** 5620** 5687** 5810** 7471 & 7503** 7451** 7449** 7555** 8352** 8339** 8338** 8297** 10051** 10030** 12159** 12197** 15899
Note: The columns from left to right are: the CPD; the frequency of the motif found in humans and the motif pathogenic to humans, in the alignment with gaps removed (prior to the subsequent recoding and reduction); the mt tRNA containing the CPD; the number of sites identified as potentially compensatory by recoding; and, the highest ranking site(s). Sites are numbered according to Mitomap27 . * contained in the same stem as the CPD. ** complementary to the CPD.
Multiple compensatory mechanisms were detected also for G4309A. This mutation disrupts a GC pair on the third rung of the TΨC stem in mt tRNA Ile, the secondary structure26 of which is given in Figure 2. The motif U at the complementary site 4321 restores this rung and 4321 is the highest ranking potential compensatory site. For 11 species containing the CPD however, no such compensation is observed. In these species the sequences for the TΨC stem differ from that of H. sapiens only by the substitutions G4309A and A4310G, resulting in the loss and gain of GC pairs on rungs three and four respectively. This suggests that the absence of a GC interaction on the third rung is compensated for in these species by the presence of a GC pair on the fourth rung. Site 4310 is ranked second among
September 26, 2006
14:59
Proceedings Trim Size: 9.75in x 6.5in
apbc141a
8
the potential compensatory sites (results not shown), with G the single motif identified by recoding as potentially compensatory at this site. 3' 5'
u a
a g acceptor a stem a a u a u g a g u c u a a a g a
D-domain
Figure 2.
g u u a c u u u g
a u c u u u a u
4321 TΨC-domain u c c c c c a a a
a g g a g c u u u a 4310 a 4309 a a u a variable loop u g a anticodon g domain a a u
Mitochondrial tRNA Ile. Secondary structure in H. sapiens.
3.2. V20E in HBB The method predicted 69 as the most likely location of a compensatory substitution for V20E in HBB. In the alignment with gaps removed the motifs observed at the site-pair (20,69) are {(A,D) : 2, (A,H) : 3, (A,T) : 1, (E,H) : 6, (I,T) : 1, (I,V) : 3, (L,T) : 1, (P,N) : 1, (Q,N) : 1, (V,A) : 5, (V,B) : 1, (V,D) : 16, (V,G) : 25, (V,H) : 1, (V,N) : 37, (V,Q) : 2, (V,S) : 7, (V,T) : 10}. Removing those species with neither V nor E at 20, this reduces to {(E,H) : 6, (V,A) : 5, (V,B) : 1, (V,D) : 16, (V,G) : 25, (V,H) : 1, (V,N) : 37, (V,Q) : 2, (V,S) : 7, (V,T) : 10} and on recoding 69 it reduces further to {(V,η) : 103, (V,ρ) : 1, (E,ρ) : 6}. This aptly illustrates the benefit of recoding, eliminating the impact on our analysis of any transitions between the eight motifs classified as η. Given this recoded dataset the prediction of 69 as the location of a compensatory substitution for V20E is not surprising. In recoding the only motif identified at 69 as potentially compensatory was H, hence the substitution G69H is the expected compensatory substitution (noting that G is found at 69 in H. sapiens). This is consistent with the results of Ref. 9, who confirmed predictions based on non-probabilistic criteria with structural data. 4. Conclusions A complex system of interactions gives rise to the structure and function of most biomolecules. Variants that disrupt such interactions putatively become fixed in species only where a compensatory mutation occurs. Most methods introduced to detect these compensatory substitutions are limited by their reliance on structural data and/or use of rigid non-probabilistic criteria. The approach presented herein avoids these restrictions and is applicable to comparative sequence data on any single biomolecule, or functionally-related system of biomolecules. That the method is applicable to both nucleotide and amino acid sequences was demonstrated with the detection of compensatory sites for 26 of 31 CPDs contained in mammalian orthologs of mt tRNAs and for V20E in HBB. The detection of secondary compensatory sites was demonstrated for two of these CPDs. To our knowledge, the method is the first of its kind for which success has been verified in applications to both nucleotide and amino acid data.
September 26, 2006
14:59
Proceedings Trim Size: 9.75in x 6.5in
apbc141a
9
Acknowledgements This research used facilities provided by the Australian Partnership for Advanced Computing.
References 1. A. M. Borman, S. Paulous and F. Clavel. Resistance of human immunodeficiency virus type 1 to protease inhibitors: selection of resistance mutations in the presence and absence of the drug. J. Gen. Virol., 77:419–26, 1996. 2. S. J. Schrag and V. Perrot. Reducing antibiotic resistance. Nature, 381:120–1, 1996. 3. J. Bj¨orkman, D. Hughes and D. I. Andersson. Virulence of antibiotic-resistant Salmonella typhimurium. Proc. Natl. Acad. Sci. USA, 95:3949–53, 1998. 4. J. Bj¨orkman, I. Nagaev, O. G. Berg, D. Hughes et al. Effects of environment on compensatory mutations to ameliorate costs of antibiotic resistance. Science, 287:1479–82, 2000. 5. B. R. Levin, V. Perrot and N. Walker. Compensatory mutations, antibiotic resistance and the population genetics of adaptive evolution in bacteria. Genetics, 154:985–97, 2000. 6. M. G. Reynolds. Compensatory evolution in rifampin-resistant Escherichia coli. Genetics, 156:1471–81, 2000. 7. I. Nagaev, J. Bj¨orkman, D. I. Andersson and D. Hughes. Biological cost and compensatory evolution in fusidic acid-resistant Staphylococcus aureus. Mol. Microbiol., 40:433–9, 2001. 8. P. Batterham, A. G. Davies, A. Y. Game and J. A. McKenzie. Asymmetry–where evolutionary and developmental genetics meet. Bioessays, 18:841–5, 1996. 9. A. S. Kondrashov, S. Sunyaev and F. A. Kondrashov. Dobzhansky-Muller incompatibilities in protein evolution. Proc. Natl. Acad. Sci. USA, 99:14878–83, 2002. 10. L. Gao and J. Zhang. Why are some human disease-associated mutations fixed in mice? Trends Genet., 19:678–81, 2003. 11. A. D. Kern and F. A. Kondrashov. Mechanisms and convergence of compensatory evolution in mammalian mitochondrial tRNAs. Nat. Genet., 36:1207–12, 2004. 12. R. J. Kulathinal, B. R. Bettencourt and D. L. Hartl. Compensated deleterious mutations in insect genomes. Science, 306:1553–4, 2004. 13. W. P. Maddison. A method for testing the correlated evolution of two binary characters: are gains or losses concentrated on certain branches of a phylogenetic tree? Evolution, 44:539–557, 1990. 14. M. Pagel. Detecting correlated evolution on phylogenies: a general method for the comparative analysis of discrete characters. Proc. R. Soc. Lond. B, 255:37–45, 1994. 15. I. N. Shindyalov, N. A. Kolchanov and C. Sander. Can three-dimensional contacts in protein structures be predicted by analysis of correlated mutations? Protein Eng., 7:349–58, 1994. 16. S. V. Muse. Evolutionary analyses of DNA sequences subject to constraints on secondary structure. Genetics, 139:1429–39, 1995. 17. S. W. Lockless and R. Ranganathan. Evolutionarily conserved pathways of energetic connectivity in protein families. Science, 286:295–9, 1999. 18. D. D. Pollock, W. R. Taylor and N. Goldman. Coevolving protein residues: maximum likelihood identification and relationship to structure. J. Mol. Biol., 287:187–98, 1999. 19. V. R. Akmaev, S. T. Kelley and G. D. Stormo. Phylogenetically enhanced statistical tools for RNA structure prediction. Bioinformatics, 16:501–12, 2000. 20. S. T. Kelley, V. R. Akmaev and G. D. Stormo. Improved statistical methods reveal direct interactions between 16S and 23S rRNA. Nucleic Acids Res., 28:4938–43, 2000. 21. P. Tuff´ery and P. Darlu. Exploring a phylogenetic approach for the detection of correlated substitutions in proteins. Mol. Biol. Evol., 17:1753–9, 2000.
September 26, 2006
14:59
Proceedings Trim Size: 9.75in x 6.5in
apbc141a
10
22. K. R. Wollenberg and W. R. Atchley. Separation of phylogenetic and functional associations in biological sequences by using the parametric bootstrap. Proc. Natl. Acad. Sci. USA, 97:3288–91, 2000. 23. M. W. Dimmic, M. J. Hubisz, C. D. Bustamante and R. Nielsen. Detecting coevolving amino acid sites using Bayesian mutational mapping. Bioinformatics, 21 Suppl 1:i126–35, 2005. 24. J. Dutheil, T. Pupko, A. Jean-Marie and N. Galtier. A model-based approach for detecting coevolving positions in a molecule. Mol. Biol. Evol., 22:1919–28, 2005. 25. A. Butterfield, V. Vedagiri, E. Lang, C. Lawrence et al. PyEvolve: a toolkit for statistical modelling of molecular evolution. BMC Bioinformatics, 5:1, 2004. 26. M. Helm, H. Brule, D. Friede, R. Giege et al. Search for characteristic structural features of mammalian mitochondrial tRNAs. RNA, 6:1356–79, 2000. 27. M. C. Brandon, M. T. Lott, K. C. Nguyen, S. Spolim et al. MITOMAP: a human mitochondrial genome database – 2004 update. Nucleic Acids Res., 33:D611–613, 2005. 28. B. Boeckmann, A. Bairoch, R. Apweiler, M.-C. Blatter et al. The SWISS-PROT protein knowledgebase and its supplement TrEMBL in 2003. Nucleic Acids Res., 31:365–70, 2003. 29. J. D. Thompson, D. G. Higgins and T. J. Gibson. CLUSTAL W: improving the sensitivity of progressive multiple sequence alignment through sequence weighting, position-specific gap penalties and weight matrix choice. Nucleic Acids Res., 22:4673–80, 1994. 30. B. Landin, S. Berglund and B. Lindoff. Hb Trollh¨attan [β 20(B2)Val→Glu] - a new haemoglobin variant with increased oxygen affinity causing erythrocytosis. Eur. J. Haematol., 53:21–5, 1994. 31. M. A. Cronin, R. Stuart, B. J. Pierson and J. C. Patton. K-casein gene phylogeny of higher ruminants (Pecora, Artiodactyla). Mol. Phylogenet. Evol., 6:295–311, 1996. 32. M. Hasegawa, J. Adachi and M. C. Milinkovitch. Novel phylogeny of whales supported by total molecular evidence. J. Mol. Evol., 44:S117–20, 1997. 33. M. Robinson, F. Catzeflis, J. Briolay and D. Mouchiroud. Molecular phylogeny of rodents, with special emphasis on murids: evidence from nuclear gene LCAT. Mol. Phylogenet. Evol., 8:423– 34, 1997. 34. O. R. Bininda-Emonds, J. L. Gittleman and A. Purvis. Building large trees by combining phylogenetic information: a complete phylogeny of the extant Carnivora (Mammalia). Biol. Rev. Camb. Philos. Soc., 74:143–75, 1999. 35. D. Huchon, F. M. Catzeflis and E. J. Douzery. Molecular evolution of the nuclear von Willebrand factor gene in mammals and the phylogeny of rodents. Mol. Biol. Evol., 16:577–89, 1999. 36. A. D. Yoder and J. A. Irwin. Phylogeny of the Lemuridae: effects of character and taxon sampling on resolution of species relationships within Eulemur. Cladistics, 15:351–361, 1999. 37. W. J. Murphy, E. Eizirik, W. E. Johnson, Y. P. Zhang et al. Molecular phylogenetics and the origins of placental mammals. Nature, 409:614–8, 2001. 38. H. Amrine-Madsen, M. Scally, M. Westerman, M. J. Stanhope et al. Nuclear gene sequences provide evidence for the monophyly of australidelphian marsupials. Mol. Phylogenet. Evol., 28:186–96, 2003. 39. C. J. Douady and E. J. P. Douzery. Molecular estimation of eulipotyphlan divergence times and the evolution of “Insectivora”. Mol. Phylogenet. Evol., 28:285–96, 2003. 40. Y. Murata, M. Nikaido, T. Sasaki, Y. Cao et al. Afrotherian phylogeny as inferred from complete mitochondrial genomes. Mol. Phylogenet. Evol., 28:253–60, 2003. 41. M. A. Nilsson, A. Gullberg, A. E. Spotorno, U. Arnason et al. Radiation of extant marsupials after the K/T boundary: evidence from complete mitochondrial genomes. J. Mol. Evol., 57:S3– S12, 2003. 42. J. Felsenstein. Evolutionary trees from DNA sequences: a maximum likelihood approach. J. Mol. Evol., 17:368–76, 1981.