Jerome P.-Y. Maa. School of Marine Science. Virginia Institute of ...... Engineering, and Mathematics, Prentice-Hall, Inc., Englewood. Cliffs, New Jersey, 507pp.
RDE Model: A Program for Simulating Water Wave Transformation for Harbor Planning
Special Scientific Report, No. 136
Jerome P.-Y. Maa School of Marine Science Virginia Institute of Marine Science College of William and Mary Gloucester Point, VA 23062
T.-W. Hsu and H.-H. Hwung Hydraulics and Ocean Engineering Dept. National Cheng-Kung University Tainan, Taiwan, R.O.C.
March 1998
Abstract The extended mild slope equation, an elliptic type partial differential equation, was solved directly to simulate water wave refraction, diffraction, reflection, shoaling, and harbor resonance for harbor planning purposes.
The finite difference
method was used to build a banded matrix equation which was then solved directly by using the Gaussian elimination method with partial pivoting and a newly-developed book-keeping procedure. Because this book-keeping procedure changes the large computer memory requirements into a large hard disk size requirement, this model is capable of handling realistic applications efficiently using small computers.
Five verification tests were selected to
demonstrate the performance of this numerical model.
Comparisons
between the model results and available experimental or analytical results indicate a satisfactory agreement.
Because of
the finite difference method and the direct approach in solving the governing equation, this model is simple to maintain, and more importantly, to upgrade for including other processes, e.g., bottom friction, tidal current influence, and spectrum waves, in the future. The computer codes for the main program, pre- and postprocess software are all included in this report.
The above
codes are also available in a floppy disk, upon requested. purpose is letting uses to access this method easily, and of
The
course, provide feed-back if possible.
TABLE OF CONTENTS Page 1. INTRODUCTION ............................................
1
2. GOVERNING EQUATIONS .....................................
4
3. BOUNDARY CONDITIONS .....................................
5
3.1. Partial Reflection Boundary Condition ........... 3.2. Given Boundary Condition .........................
7 9
4. NUMERICAL MODEL ......................................... 12 5.
MODEL VERIFICATION ..................................... 14 5.1. 5.2. 5.3. 5.4. 5.5.
Infinite Long Breakwater with a gap ................. Finite Length Breakwater ............................ Resonance at a Rectangular Harbor .................. Influence of bottom slope and Curvature ............. A Simple but Practical Harbor .......................
14 18 21 24 27
6. DISCUSSION AND CONCLUSIONS .............................. 29
7. ACKNOWLEDGMENTS ......................................... 31 8.
REFERENCES ............................................. 32
9. APPENDIX I, Finite Difference Equations for the Boundary Conditions ................................ 1.1 10. APPENDIX II, Source Listing of the Main Program and Subroutines RDE.FOR ..................... 2.1 11. APPENDIX III, Source Listing for the First Post Process Program OUTFORM.FOR ...................... 3.1 12. APPENDIX IV, Source Listing for the Second Post Process Program for Graphic Presentation, RDEPLOT.M ................................ 4.1 13. APPENDIX V, Source Listing for a Grid Generation and I/O files Generations .................... 5.1 TABLE OF FIGURES
I
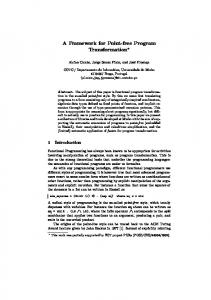
Page Fig. 1. Coordinate System and Grid Alignment for the Model .. 6 Fig. 2. Calculation of Wave Phase at Given Boundary Grid Points............................................ 11 Fig. 3. Comparison of Wave Height Contours and Wave Crests for an Infinite-Long Breakwater with a Gap. The top half is a copy from the Shore Protection Manual, the bottom part is model results .......................... 16 Fig. 4. Comparison of Wave Height Contours for a Finite-Length Breakwater with Oblique Incident Waves. (a)Analytical solution from Goda et al. (1971); (b) Model results ... 20 Fig. 5. The Typical Rectangular Harbor. The Displayed Normalized Wave Height Contours is the Response near Harbor Resonance ...................................... 22 Fig. 6. Comparison with Analytical Solution (Solid line) and Model-Calculated Normalized Wave Height at the Harbor End. The dashed line is the model results with the open ocean boundary domain shown in Fig. 5 (12.85 x 18.45 cm). The dashed-dotted line is the model results when the open Ocean boundary domain increased to 19.27 x 30.15 cm ... 22 Fig. 7. Calculated Wave Height Profile along a Wave Flume with Four Sinusoidal Bedforms. The bedforms are given on the bottom ......................................... 26 Fig. 8. Comparison of Calculated and Measured Wave Reflection Coefficient for the Four Sinusoidal Bedforms. The solid line is model results and the circles are experimental data from Davies and Heathershaw (1984) ............... 26 Fig. 9. Comparison of Wave Height Contours in a Simple Harbor (a)Laboratory measurements by Sato et al. (1990); (b) Model Results ..................................... 28
II
INTRODUCTION Water wave transformation, i.e., the change in wave height and direction caused by irregular bathymetry and/or structures, plays an important role in harbor planning, navigation safety, as well as shore protection and environmental regulations. There are many numerical models available to simulate wave transformation which can be described by the elliptic mild slope equation (Berkhoff 1972; 1976).
These models can be divided into three
categories: (1) Using a parabolic approximation to simulate wave refraction, weak diffraction, and shoaling for a relatively large study domain, or (2) Solving a hyperbolic, time dependent, mild slope equation, (3) solving the original elliptic, mild slope equation directly. The first approach imposes some restrictions, but can be solved relatively fast (e.g., REFDIF-1 by Kirby and Dalrymple 1991).
Under this category, numerous studies have been conducted
during the past decades (e.g., Kirby 1986a; 1986b; 1988; Panchang et al. 1988; Dalrymple et al. 1989).
The second category deals
with a transient mild slope equation (Copeland 1985; Madsen and Larsen 1987) and looks for the results at steady state.
The
computing speed of this approach is approximately the same as to solve the mild slope equation directly (Li 1994b).
The advantage
is that this approach does not require a huge computer memory. The third category is usually limited to a small study domain,
1
e.g., harbors, because of the huge memory requirement for large domains. Improvements on the mild slope equation by adding the effects of steep bottom slopes and bottom curvatures have been established recently (Massel 1993; 1995; Chamberlain and Porter 1995; Porter and Staziker 1995).
For harbor planning, this
extended mild slope equation can more accurately describe the possible drastic changes of water depth in harbors, and thus, it was selected for this study. Numerical methods developed in the third category can use finite element method (e.g., Behrendt 1985; Chen and Houston, 1987), or finite difference method.
Because of the nature of
finite element technique, this kind of model is hard to maintain or upgrade.
The available finite difference models all used an
iteration method (Li and Anastasiou 1992, Li 1994a; 1994b) because of the low computer memory requirements.
A major concern
about the iteration method is the convergent rate degrades significantly for a complex boundary geometry.
The alternative
approach, uses the Gaussian elimination method (Dongarra 1979; Mathews 1987) to directly solve the huge banded matrix equation (hereafter called the direct method), was only possible on mainframe computers with immense core memory (on the order of gigabytes or more).
For this reason, using the direct method on
small computer for harbor planning purposes has never been
2
attempted. Recently, however, a thrifty banded matrix solver (Maa et al. 1997) has been developed.
This solver only requires a modest
amount of core memory and a large hard disk (which is readily available even for 10 Gigabytes).
Thus allowing us to use the
direct method to solve the extended mild slope equation with a small computer. To demonstrate this approach, we first present the governing equation and boundary conditions, followed by the formulation of the finite difference equations (FDE).
Applying these FDEs to a
study domain resulted in a huge banded matrix equation, which was solved using the thrifty banded matrix solver (Maa et al. 1997). Five cases, in which either analytical solutions or experimental results were available, were selected for model verification. Only simple harmonic waves were used in this first stage study without considering energy loss caused by bottom friction. The more realistic multidirectional random waves as well as other improvements (e.g., bottom friction, identification of wave breaking, third order approximation for the total passing boundary condition, complex wave reflection coefficient to include phase difference) were left for the next stage. The computer codes for the main programs, all subroutines, and other pre- and post-processing computer codes are all presented in the Appendices.
The most-up-to-date source codes
3
are available in floppy disk, upon request. GOVERNING EQUATION The extended mild slope equation, Eq. 1, (Massel 1995) was selected for this study.
Although Eq. 1 can be transformed to
the Helmholtz equation and then solved numerically, it was decided to solve the original form to simplify future upgrades.
(1)
where
(2)
(3a)
(3b)
4
(3c)
(3d)
N is the velocity potential function for a simple harmonic wave flow, ko = 4B2/gT2 is the deep water wave number, T is the wave period, g is the gravitational acceleration, k = 2B/L is the local wave number, L is the local wave length, h is the water depth, Mh/Mx and Mh/My are the bottom slopes in the x and y directions respectively, M2h/Mx2 and M2h/My2 are the bottom curvatures in the x and y direction, respectively, and x and y are the two horizontal coordinates, see Fig. 1. Using a five-point-approximation, the finite difference equation for Eq. 1 can be written as follows.
(4)
(5a)
(5b)
5
where (5c) r=()x/)y), and )x and )y are the grid sizes in the x and y directions respectively.
Notice that R, k, Mh/Mx, Mh/My, M2h/Mx2,
and M2h/My2 can be different at each grid point because of the possible different water depths.
Fig. 1. Coordinate System and Grid Alignment for the Model.
6
BOUNDARY CONDITIONS There are only two types of boundary conditions in the simulation of wave transformations: a partial reflection boundary condition and a given boundary condition.
These conditions are
specified along the border of a study domain, see Fig. 1.
Partial Reflection Boundary Condition: The condition described here (Eqs. 6 and 7) is actually a general condition that can be used for (1) total reflection, (2) partial reflection, or (3) total passing through (Behrendt 1985).
This is because there is
only one difference (in the selection of a constant coefficient,
", in Eqs. 6 and 7) among these three second-order approximations of the boundary conditions.
(6)
(7)
here i=(-1)1/2.
Equation 6 is applicable to the boundary segments
that are perpendicular to the x-axis, where the positive sign is for those segments that have the water grid point on their left side.
Equation 7 is applicable to boundary segments that are
7
perpendicular to the y-axis, where the positive sign is for those segments that have the water grid point on the bottom.
When " =
0, Eqs. 6 and 7 represent total reflection boundary conditions. When " = 1, these two equations represent total passing through boundary conditions.
For 0 < " < 1, they represent partial
reflection boundary conditions.
Notice that Eqs. 6 and 7 are
only second-order approximations, and thus, reflection waves will be introduced when the approaching waves deviate more than 30 degrees (i.e., $ > 30o, see Fig. 1) off the normal line of the boundaries, even when " = 1.
For improvements on this issue,
Kirby's third-order approximation may be used (Kirby 1989). Unfortunately, even that approximation has its limitations, and further studies are needed. In order to use the second-order approximation of the boundary conditions at the boundaries, we used an imaginary grid point that is just one grid outside of the study domain.
Here
the boundary condition for a positive x boundary is used as an example to demonstrate this issue.
Considering that the above
boundary condition is specified at the boundary grid, I, in the x direction and the water grid point is located on the left side of this point, the finite difference equation for this boundary condition is (8)
8
where $x = 2i"k)x and >x = (i"r2)/(k)x). outside the study domain.
Notice that NI+1,j is
Because the governing equation at this
boundary grid is (9) these two equations were used to eliminate NI+1,j at the imaginary point and the resulting equation for this kind of boundary is as follows.
(10) Similarly, using Eq. 4 with either Eq. 6 or 7, the finite difference equations at the negative x, positive y, and negative y boundary points can be obtained (see Appendix I).
For a corner
grid point, three equations (i.e., Eqs. 4, 6, and 7) are used to obtain the finite difference equation (in Appendix I) that is applicable at that corner point.
Given Boundary Condition: This kind of boundary condition is used at those grid points where input wave information is specified. Because of the possible scatter waves generated from the study domain, the actual velocity potential function is still unknown at these grid points.
In other words, there are two velocity
potential values at a given boundary grid point, and the outgoing
9
(11a)
(11b)
scatter waves should pass through this boundary and remain unaffected.
For this reason, a total passing through boundary
condition, eqs. 6 and 7 with " = 1, is used together with the given wave velocity potential, Ng, as follows (Behrendt 1985). As an example, we are using the positive x given boundary equation to find the finite difference equation. Considering that a given boundary is specified at the boundary grid, I, and the water grid point is located on the left of this point, the finite difference equation for this boundary condition, i.e., Eq. 11a with the positive sign, is (12) where $1x = 2ik)x and >1x = (ir2)/(k)x). outside the study domain.
Notice that NI+1,j is
Because the governing equation at this
boundary grid is
(13) these two equations are used to eliminate NI+1,j at the imaginary
10
point and the resulting equation for this kind of boundary is given as follows.
(14)
Similarly, one can obtain the finite difference equation (see Appendix I) at the negative x, positive y, and negative y given boundary points. For a given monochromatic wave with wave height, H, period, T, and direction, 2 (reference to the boundary), the given wave velocity potential can be calculated as (Behrendt 1985)
(15)
where A is the amplitude function and S is the phase function. For normally incident waves, the phase function should be the same at all entrance grid points.
For convenience and
without loss of generality, we may choose S = 0 for this condition.
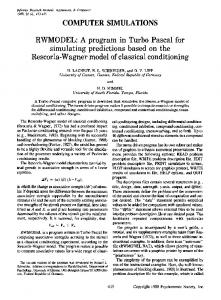
For oblique incident waves, see Fig. 2, the phase
function can be calculated as follows.
(16)
11
where xL is the local one-dimensional coordinate, L is the wave length at the boundary location, and 2 is the angle between the wave direction and the normal vector of the boundary.
Fig. 2. Calculation of Wave Phase at Given Boundary Grid Points.
NUMERICAL MODEL Equation 4 and these boundary finite difference equations were applied to all the water grid points in the study domain (Fig. 1), which has MP and NP grids in the x and y directions, respectively.
A banded matrix equation can be established as
follows (17)
where B is a banded matrix with a dimension of M x N, N is the
12
length of this banded matrix (same as the number of water grid points), M is the band width of this matrix, X is the unknown column matrix for the wave potential function, and G is another column matrix that includes the given boundary conditions.
In
general, M varies with the grid alignment as well as the geometry of the study domain.
The computer codes were written in such a
manner that when the x axis is selected parallel with the longer dimension of the study domain, the band width will be a minimum. As Behrendt (1985)pointed out in his finite element model, the length of each side of an element should not exceed 1/10 of the wave length in order to solve the elliptic equation.
A
similar requirement holds for this finite difference model, i.e.,
)x and )y should both less than 1/10 of the wave length. Although )x and )y are not required to be the same in this model, the less-than-1/10-wave-length requirement practically limits the choice of )x and )y.
This is because the maximum )x and )y is
usually desired in practical applications. The banded matrix equation was solved by using a thrifty banded matrix solver (Maa et al. 1997).
The traditional banded
matrix equation solver usually requires large computer memory space because it stores the entire banded matrix in memory.
For
practical applications, N is usually on the order of 104-105 and M is on the order of 102 - 103.
Thus, storing the matrix (using 16
byte complex numbers) alone may require 16 MB to 1.6 GB of
13
memory. In the thrifty banded matrix solver, the sparse band matrix is stored in two much-smaller matrices (one is a complex matrix, the other is an integer matrix, each with a size of 5 x N). These two small matrices require much less computer memory, e.g., only 1.2 to 12 MB is required for the previously mentioned banded matrix.
Furthermore, the solver constructs the banded matrix
equation one block at a time, and then, follows the standard Gaussian elimination method with partial pivoting for forward elimination.
It saves the results to the hard disk, and then
fetches the information from the two smaller matrices to continue the processes (i.e., constructing a block of the banded matrix equation and performing forward elimination).
This procedure
continues until the entire banded matrix equation is processed. The back substitution begins by reading the last saved data, also one block at a time, to solve the velocity potential.
The back
substitution also repeats until all the saved blocks are read and processed.
Unlike the virtual memory, this process uses minimal
disk I/O, leaving computing time for number crunching. reason, the efficiency is high.
For this
The computing times for the five
cases presented next will demonstrate this point.
MODEL VERIFICATIONS Five cases, in which either the analytical solution or
14
experimental results were available, were selected for model verification.
Case 1. Infinite Long Breakwater with One Gap Blue and Johnson (1949) provided experimental results for this case study, later generalized by Johnson (1953) and then documented in the Shore Protection Manual.
In this case, there
was an infinitely long straight breakwater with a gap of 2 wave lengths.
Waves normally approached this breakwater.
The given wave condition was specified along the gap with the same phase.
Along the breakwater, a total reflection
boundary condition (Eqs. 6 and 7 with " = 0) was specified.
On
the other three sides, a total passing through boundary condition was assigned (" = 1).
The grid size, wave parameters, and other
parameters used in the model are given in Table 1. For comparison, the calculated wave heights were normalized by the incident wave height, and then plotted on the left hand side of Fig. 3.
The results documented in the Shore Protection
Manual were duplicated on the right hand side of Fig. 3.
It is
obvious that there is an excellent agreement between these two, except at the gap.
More discussion of this difference is given
in the Discussion section. The calculated contours of a specified wave phase value (e.g., S = 3), which may be used to represent the wave crest lines, were also plotted in Fig. 3 to compare with those documented in the Shore Protection Manual.
15
Excellent agreement
between these two are also obvious. To insure that the computer codes were correct, we assigned the breakwater and the gap located on the left hand side, right hand side, top side, as well as bottom side of the study domain. The results were identical.
Fig. 3. Comparison of Wave Height Contours and Wave Crests for an Infinite-Long Breakwater with a Gap. The left half is a copy from the Shore Protection Manual, the right half is the model results
16
Table 1, Parameters used and Results in the Model Verifications -----------------------------------------------------------------------Parameters Case 1 Case 2 Case 3
Case 4
Case 5
H (m)
0.05
0.041
0.01
0.01
0.01
T (s)
0.8
0.9
varies
varies
0.73
0
60
0
0
0
h (m)
0.5
0.4
0.2573
0.1563 0.102
�x (m)
0.1
0.1
0.003212
0.05
0.02
�y (m)
0.1
0.1
0.003025
0.05
0.02
W x L (m)
10x8
22x9.6
MP x NP
101x81
221x97
141x62
M
163 (203)
195
125
43
123
N
8181
21437
4601
4221
6769
Computing time (s)
42 (62)
180
41
32
24
(deg)
0.4497 x 10x1 0.1845 201x21
0.25-
2.2x1.2 111x61
The computing time is based on a Pentium Pro Personal computer with 200 Mhz speed, 64 MB of memory, and Windows NT operation system. The memory requirement of this model to run the above five cases is about 7 MB. For Case 1, the different computing times represent the results of a different band width caused by selecting x axis parallel to the long (or short) side of the study domain. W, L are the width and length of the study domain. MP, NP are the grid number in x and y direction, respectively, see Fig. 1.
17
Case 2, A Finite-length Single Breakwater Goda et al. (1971) presented their analytical solution for this case study: a two-wave-length long straight breakwater was located in a constant water depth environment.
The incident
waves approached the breakwater with an angle of 60 degrees; and the analytical solution of normalized wave height distribution is plotted in Fig. 4a.
For numerical modeling, the given wave
condition was specified along the left border, except at the portion for the breakwater, where a total reflection boundary condition (" = 0) was used.
On the other three sides, the total
passing through boundary condition (" = 1) was used.
All
parameters used to simulate this case are also given in Table 1. The model results (contours of the normalized wave height) are plotted in Fig. 4b.
Reasonably good agreement can be found at
the near field after the breakwater.
For the far field, however,
the model results are about 20% higher. It is necessary to point out that the computing domain in the x direction was much larger than that displayed in Fig. 4b. The computing domain in the y direction was also slightly larger than that displayed in Fig. 4b (see Table 1 for the size).
The
selection of this computing domain was because the two possible boundary conditions on the open boundaries (" = 0 for the total reflection boundary condition, or " = 1 for the total passing through boundary condition) both required a much large simulation
18
domain to minimize the influence of reflected waves.
Although "
= 1 was specified along the three open boundaries, reflected waves were introduced because of the second order approximation of the passing through boundary condition and the large incident waves angle (30 degrees off from the normal vectors of the boundaries).
Therefore, the unwanted reflected waves propagate
into the computing domain and cause error at the far field.
It
is not clear at this time, however, how much error is contributed from the grid size selection inherent from the finite difference method. To improve the passing through open boundary condition, a third order approximate (Kirby 1989) is necessary, and that will be the goal for our next stage modifications.
19
Fig. 4. Comparison of Wave Height Contours for a Finite-Length Breakwater with Oblique Incident Waves. (a)Analytical solution from Goda et al. (1971); (b) Model results.
20
Case 3. Resonance in a Rectangular Harbor Many studies of this case have been conducted.
In addition
to the analytical solution given by Unluata and Mei (1973), there have been many physical model studies (e.g., Ippen and Goda 1963; Lee 1971) as well as numerical studies (e.g., Chen and Mei 1974; Lee 1971; Behrendt 1985).
The geometry of this harbor is given
in Fig. 5 with harbor length E = 0.3212 m, harbor width B = 0.0605 m, and a constant water depth of 0.2573 m. In the current model simulation, the entire computation domain is given in Fig. 5.
On the left hand side of this domain,
the given boundary condition was specified.
Along the harbor
perimeter, the total reflection boundary condition (" = 0) was specified.
At the top and bottom open boundaries, the total
passing through boundary condition was assigned (" = 1).
If this
harbor does not exist, the wave height would be doubled at the right side border (x = 0.1285 m, see Fig. 5) for any given wave condition because of the total reflection boundary condition specified there.
This doubled wave height (2Hi) was used to
normalize the calculated wave heights at the harbor end (x=0.4497 m) shown in Fig. 6.
For the harbor geometry given in Fig. 5,
Unluata and Mei found that the wave height at the harbor end became very large (H/2Hg 6 8, see Fig. 6) when the ratio of harbor length to wave length approached 1/4 (2BE/L = 1.324). This is the first resonance; the second resonance occurred at
21
2B E/ L = 4. 20 4.
Fig. 5. The Typical Rectangular Harbor. The Displayed Normalized Wave Height Contours is the Response near Harbor Resonance.
Fig. 6. Comparison with Analytical Solution (Solid line) and Model-Calculated Normalized Wave Height at the Harbor End. The dashed line is the model results with the open ocean boundary domain shown in Fig. 5 (12.85 x 18.45 cm). The dashed-dotted line is the model results when the open Ocean boundary domain increased to 19.27 x 30.15 cm.
22
Because an approximation (i.e., the rectangular open boundary) of the exact geometry for the open boundary was used, the model results (dashed line in Fig. 6) cannot be as accurate as the analytical solutions (solid line in Fig. 6).
When the
size of the open boundary domain (on the left hand side of Fig. 5) increased from 12.85 cm x 18.45 cm to 19.27 cm x 30.15 cm, the performance of this model also changed; see the dash-dotted line in Fig. 6.
As pointed out by Chen (personnel communication
1997), a semi-circle open boundary is needed for an accurate simulation of the resonance.
The calculated contours of the
normalized wave height at a near resonance frequency (see Fig. 5) further demonstrated that the scatter waves propagated outward from the harbor entrance and also showed why a semi-circular open boundary is needed. Although the performance of this model is not perfect at this time, it does indicate the resonance near the two resonant frequencies (Fig. 6).
As the results of the first stage study,
we will leave the model as is.
We may find a better way to
implement the semi-circle open boundary requirement in the next stage study.
23
Case 4, Influence of bottom slope and Curvature Davies and Heathershaw (1984) presented the results of a physical model study and analytical solution for evaluating the influence of bottom curvature and steep slope on wave reflection and transmission.
In their physical model study, monochromic
waves were generated at one end of a one-dimensional wave flume. At the middle of this flume, there was a selected number (1, 2, 4, and 10) of sinusoidal bedform.
The average water depth within
the sinusoidal bed area was the same as the water depth before and after the sinusoidal bedform.
The sinusoidal bedform had an
amplitude, b, of 0.05 m and length, Ls, of 1.0 m.
When waves
encountered this kind of bed, some of the wave energy reflected back and some passed through (e.g., see Fig. 7).
They measured
the reflection coefficients, kr (see Fig. 8 for four sinusoidal bedform), in terms of wave period, water depth, and number of sinusoidal bed forms. Although this is a one-dimensional case, we can use the twodimensional model to simulate the wave transformation along this flume.
The positive x direction was selected as the wave
propagation direction to reduce the band width of the matrix B. In the y direction, an arbitrary number of grid points (21 grid points) was selected to represent the channel width. the given wave boundary condition was specified.
At x = 0,
At the flume
end, a total passing through boundary condition was specified.
24
On both the two Y-directional borders, a total reflection boundary condition was used.
All other parameters used in the
model are given in Table 1. The model results clearly demonstrated the progress and reflective waves before the bed forms as well as the transmitted waves after the bed forms (Fig. 7).
Because of the small kr
(0.083) in this particular case, the normalized transmitted wave height was also close to 1.
Wave heights were larger than the
incident waves at many places where the bed form were located. The model also performed very well in identifying the maximum wave reflection; see Fig. 8.
This demonstrates a
satisfactory performance for this model when encountering irregular bathymetry.
25
Fig. 7. Calculated Wave Height Profile along a Wave Flume with Four Sinusoidal Bed forms, which are plotted on the bottom.
Fig. 8. Comparison of Calculated and Measured Wave Reflection Coefficient for the Four Sinusoidal Bed forms.
26
Case 5, A Simple but Practical Harbor Sato et al. (1990) presented the results (ratio of local and input wave heights) of a physical model study on a small harbor (Fig. 9a).
This case was selected because of the small study
domain, complicated boundary conditions, and realistic harbor geometry. The incident wave period was 0.73 s with the wave direction given in Fig. 9a.
The given incident wave height was not given
but that was immaterial because the measurements were normalized. Crashed stones were placed on the seaward side of the breakwater in order to dissipate wave energy.
For this reason, "
was selected as 0.8 to represent a nearly total passing through boundary condition on the seaward face of the breakwater.
Total
passing through boundary conditions (" = 1) were specified for the open sea boundary in both y directional borders.
Within the
harbor, the vertical wall was capable of reflecting most of the wave energy, and thus, a small " should be selected.
It was not
documented, however, what the " should be because no experimental data was available.
The model results with " = 0.03 (Fig. 9b)
were quite close to the measurements.
When " = 0, however, the
resulting wave heights at the node points were about 2 times larger than those when " = 0.03.
Here the node points referred
to those locations where the normalized wave heights were large. When using " = 0.1, on the other hand, the resulting wave heights were too small to compare with the measurements.
27
Fig. 9. Comparison of Wave Height Contours in a Simple Harbor (a)Laboratory measurements by Sato et al. (1990); (b) Model Results.
28
It may be argued that the selection of " = 0 with wave energy loss caused by bottom friction may also be able to give results similar to those given in Fig. 9a. because of the small " used in this case.
This is possible This argument will be
examined in our next stage study when the energy loss caused by bottom friction will be implemented.
DISCUSSION AND CONCLUSIONS Requiring the grid size to be less than 1/10 of the wave length is the major disadvantage of solving the elliptic equation.
Because of the small grid size, the band matrix, B,
can easily become very large, and thus, require more computing time.
For this reason, this method is not recommended when there
is no reflection and only weak diffraction.
A model using the
parabolic approximation should be used instead.
The inability to
simulate wave reflection and strong wave diffraction, however, prohibits the use of that approach for harbor planning purposes. The requirement of a small grid size (i.e., less than 1/10 of the wave length) improves the feasibility of using the finite difference method to simulate a complicated harbor geometry.
The
advantage in using the finite element method, on the other hand, diminishes as the grid size decreases. One advantage of using the direct method to solve the elliptic equation is that there is no convergence concern even
29
for a very complicated geometry.
In general, convergence is one
of the major concerns for irregular geometries using iteration methods. The most important advantage of using the direct method (i.e., forming a banded matrix equation and solving it using the Gaussian elimination method) to simulate wave transformation processes is depicted next.
For a given harbor geometry,
different wave conditions only change the column matrix G, and does not affect the banded matrix B in eq. 17.
This is important
because the computing times for the forward elimination and back substitution are proportional to N3 and N2, respectively (Mathews 1987), where N is the length of the banded matrix.
Since the
given wave conditions do not affect B, only a one-time computation of the forward elimination is needed.
This can save
significant computing time if many wave conditions are involved (usually it is true for harbor planning) for a harbor geometry. To examine the more realistic spectrum waves, this advantage is also important because it can improve the computing efficiency significantly.
Improving the computer codes for this purpose,
however, is rather straightforward, and will be given in the next stage study. In conclusion, by using the finite difference method and a simple book-keeping procedure to relax the huge memory requirements, a much simple numerical model for simulating wave
30
reflection, refraction, diffraction, shoaling, and harbor resonance for harbor planning purposes has been developed.
This
model can simulate these processes using small computers with reasonable speed.
With a more powerful computer, the time
required for modeling these processes will be much less. The effects of bottom friction are not yet included in this model.
It can easily be added later because it only slightly
affects the construction of the banded matrix equation, while the procedures for obtaining the solution remain the same. Wave breaking, another important phenomenon, is not examined in this study.
This model, however, can give unrealistically
large wave heights at the breaking line.
This feature can be
used in post-processing software to identify the breaking line. After breaking, unfortunately, this model will not be able to continue the simulation because the theory is no longer valid.
ACKNOWLEDGMENTS Financial support from the U.S. Department of the Interior, Minerals Management Service, Office of International and Marine Minerals, under Cooperative Agreement No 14-35-001-30740 is sincerely acknowledged.
Support from the National Science
Council of the Republic of China, Contract Number NSC 86-2611-E006-019 is also sincerely acknowledged.
Mr. M.-T. Maa helps to
prepare diagrams and proofread the manuscript.
31
REFERENCES Berkhoff, J. C. W., 1972, "Computation of Combined RefractionDiffraction." Proceedings, 13th International Conf. on Coastal Engrg., ASCE, 1, 471-490. Berkhoff, J. C. W., 1976, Mathematic Models for Simple Harmonic Linear Water Waves, Wave Diffraction and Refraction, Publication No. 1963, Delft Hydraulics Laboratory, Delft, The Netherlands. Behrendt, L., 1985, A Finite Element Model for Water Wave Diffraction Including Boundary Absorption and Bottom Friction, Series Paper 37, Institute of Hydrodynamics and Hydraulic Engrg., Technical Univ. of Denmark. Blue, F. L. Jr. and J. W. Johnson, 1949, "Diffraction of Water Waves passing Through a Breakwater Gap," Transactions, American Geophysical Union, 30(5), 705-718. Chamberlain, P.G. and D. Porter, 1995, "The Modified Mild-slope Equation," J. Fluid Mech., 291, 393-407. Chen, H.S. and C.C. Mei, 1974, Oscillations and Wave Forces in an Offshore Harbor, Rep. No. 190, Parsons Lab. MIT, Cambridge, Mass. Chen, H.S. and J.R. Houston, 1987, Calculation of Water Oscillation in Coastal Harbors, HARBS and HARBD User's Manual, Instruction Report CERC-87-2, CERC, Dept. of the Army, WES, Corps of Engineers, Vicksburg, Mississippi 39180-0631. Copeland, G.J.M., 1985, "A practical Alternative to the 'Mildslope' Wave Equation", Coastal Engrg., 9, 125-149. Dalrymple, R. A., Suh, K. D., Kirby, J. T., and Chae, J. W., 1989, "Models for Very Wide-angle Water Waves and Wave Diffraction, Part 2, Irregular Bathymetry," J. Fluid Mechanics, 201, 299-322. Davies, A.G. and A.D. Heathershaw, 1984, "Surface-wave Propagation over Sinusoidally Varying Topography," J. Fluid Mechanics, 144, 419-443. Dongarra, J.J., J.R. Bunch, C.B. Moler, and G.W. Stewwart, 1979, Linpack Users Guide, SIAM. Goda Y, Yoshimura T., Ito, M., 1971, Report of the Port and Harbor Research Institute, 10, (2).
32
Ippen, A.T. and Goda, Y., 1963, Wave Induced Oscillations in Harbors: The Solution for a Rectangular Harbor Connected to the Open Sea, Rep. No. 59, Hydrodynamics Lab, MIT, Cambridge, MASS. Johnson, J. W., 1953, "Generalized Wave Diffraction Diagrams,” Proceedings of the second Conference on Coastal Engineering, ASCE, 6-23. Kirby, J. T., 1986a, "Higher-order Approximations in the Parabolic Equation Method for Water Waves," J. of Geophysical Research, 91 (C1), 933-952. Kirby, J. T., 1986b, "Rational Approximations in the Parabolic Equation Method for Water Waves," Coastal Engrg., 10, 355-378. Kirby, J. T., 1988, "Parabolic Waves Computations in Nonorthogonal Coordinate Systems," J. of Waterway, Port, Coastal, and Ocean Engrg., ASCE, 114(6), 673-685. Kirby, J. T., 1989, "Note on Parabolic Radiation boundary conditions for Elliptic wave Calculation," Coastal Engrg., 13, 211-218. Kirby, J. T. and Dalrymple, R. A., 1991, User’s Manual, Combined Reffraction/Diffraction Model, REF/DIF 1, Ver 2.3, Center for Applied Coastal Research, Dept. Of Civil Engineering, Univ. Of Delaware, Newark, DE 19716. Lee, J.-J., 1971, "Wave-induced Oscillations in Harbors of Arbitrary geometry,"” J. Fluid. Mechanics, 45(2), 375-394. Li, B. and K. Anastasiou, 1992, "Efficient Elliptic Solvers for the Mild-slope Equation using the Multigrid Technique," Coastal Engrg., 245-266. Li, B., 1994a, "A Generalized Conjugate Gradient Model for the Mild Slope Equation," Coastal Engrg., 23, 215-225. Li, B., 1994b, "An Evolution Equation for Water Waves," Engrg., 23, 227-242.
Coastal
Maa, J. P.-Y., M.-H. Maa, C. Li, and Q. He, 1997, Using the Gaussian Elimination Method for Large Banded Matrix Equations, Special Scientific Report, No. 135, Virginia Institute of Marine Science, Gloucester Point, VA 23062. Madsen, P.A. and Larsen, J., 1987, "An Efficient Finitedifference Approach to the Mild-slope Equation," Coastal Engrg.,
33
11, 329-351 Massel, S. R., 1993, "Extended Refraction-diffraction Equation for Surface Waves," Coastal Engineering, 19, 97-126. Massel, S. R., 1995, Ocean Surface Waves: Their Physics and Prediction, World Scientific Publ., Singapore. Mathews, J. H., 1987, Numerical Methods for Computer Science, Engineering, and Mathematics, Prentice-Hall, Inc., Englewood Cliffs, New Jersey, 507pp. Panchang, V. G., Cushman-Roisin, B., and Pearce, B.R. (1988). "Combined Refraction-diffraction of Short Waves in Large Coastal Regions," Coastal Engrg., 12(2), 133-156. Porter, D. and D.J. Staziker, 1995, "Extensions of the Mild-slope Equation," J. Fluid Mech., 300, 367-382. Sato, N., M. Isobe, and T. Izumiya, 1990, "A Numerical Model for Calculating Wave Height Distribution in a Harbor of Arbitrary Shape,"” Coastal Engineering in Japan, 33(2), 119-132. Shore Protection Manual, 1977, Coastal Engineering Research Center, 3nd editions, U.S. Army, Corps of Engineers. Unluate U. and C.C. Mei, 1973, Long Wave Excitation in Harbors an Anslytical Study, Rep. No 171, Parsons Lab. MIT, Cambridge, MASS.
34
Appendix I. Finite Difference Equations for Boundary Conditions. The extended mild slope equation (Eq. 4) and the secondorder approximation of the partial reflection boundary conditions (Eqs. 6 and 7, in finite difference form) are combined together to form the finite difference equation at these boundaries. Notice that the word "right," "left," "top," or "bottom" are used to indicate that the boundary grid point (with an upper case index either I, or J) is on the right, left, top, or bottom side of the water cells. The origin of the Cartesian coordinates is located at the lower-left corner. Equation 10 is repeated here as Eq. I-5 for convenience. (1) Top side partial reflection boundary. Considering that this boundary condition is specified at the boundary grid, J, in the y direction and the water grid point is located on the lower side of this point, the finite difference equation for Eq. 7, with a positive sign, is (I-1) where $y = 2i"k)y and >y = (i")/(kr2)y). With Eq. 4 specified for grid point (i,J), the resulting finite difference equation can be found as follows.
(I-2) (2) Bottom side partial reflection boundary.
(I-3) (3) Left hand side partial reflection boundary.
(I-4)
1.1
(4) Right hand side partial reflection boundary.
(I-5) (5) Bottom-Left corner partial reflection boundary. Considering that this boundary condition is specified at the boundary grid (I,J), and the water grid point is located on the up right side of this point, using Eqs. 6, 7, and I-3 to eliminate the two velocity potential (NI,J-1 and NI-1,J) and the resulting finite difference equation is
(I-6) (6) Top-left corner partial reflection boundary.
(I-7)
1.2
(7) Top-right corner partial reflection boundary.
(I-8)
(8) Bottom-right corner partial reflection boundary.
(I-9) (9) Top side given boundary
(I-10)
(10) Bottom side given boundary.
1.3
(I-11) (11) Left hand side given boundary.
(I-12) (12) Right hand side given boundary. This equation is the same as Eq. 14, which is repeated here for convenience.
(I-13)
1.4
Appendix II. FORTRAN Source Codes for the main program RDE.FOR Program RDE c c c c c c c c c c c c c c c c c c c c c c c c c c c c c c c c c c c c c c c c c c c c c c c c
This program solves the extended mild slope equation for simulating water wave refraction, diffraction, reflection, and shoaling. It uses second order approximation on the governing and boundary conditions. This program uses a direct method to solve the huge Banded matrix equation, which was obtained by doing finite difference on the elliptic equation. iq,jq : parameters specified for reserving space for 2-D arrays They should be at least the same as mp and np. mp,np : number of grid points in x and y direction, respectively. In applications, the x-axis should be parallel to the longer dimension of the water body. The y axis should parallel to the short dimension of the water body. This allignment will generate a smaller banded width. dx,dy : grid sizes in x and y direction, respectively. In this program, only the equally spaced grid is allowed. But dx do not have to equal to dy. dlevel: water elev. that added to the bathymetric depth for storm tide. dmin : min. water depth at a point that this point will be considered as water. kq : the larger dimension of the banded coefficient matrix. The maximum kq equals to mp*np if all points in the x-y plane are water points. Practically, it should be much smaller (equal to the length of the total water cells in the study domain because of land cells. nbc : number of grid points that are assigned as either a passing through, a total reflection, or a partial reflection boundaries. ngc : number of grid points that are assigned to have a given boundary, e.g., wave height, period, and direction. id : a 2-D array to store the identification for each grid point. Detail explanation is given in the program. The following logical numbers are used to read or write files 1 : CONFILE for Control parameters. 9 : OUTFILE for storage output. This file contains calculation results for all cases. So it may be very big. 11: CHKFILE for storage data for checking purposes. This file erease itself when completed for each case and reused to save disk space. 15: BCDFILE for input ID codes and boundary conditions (given boundary as well as radiation boundary. 16: DEPFILE for input water grid.
2.1
implicit real*8 (a-h, o-y), integer*4 (i-n), complex*16 (z) parameter (iq=501, jq=401, kq=80000, nbc=1500, ngc=502, * iw=1000, jw=1700) c character*70 title character*20 outfile, confile, chkfile, depfile, bcdfile character*11 result character*1 id c common /files/ depfile, bcdfile common /waves/ period, waveH, angle0 common /bottm/ dep(iq,jq), id(iq,jq) common /matrx/ za(kq,5), ia(kq,5), zb(kq) common /gener/ mp, np, dx,dy, r, yorient, xl, yl, wk0 common /unknw/ n, mu, mL, m, Lda, imap(kq), jmap(kq) common /works/ zw(iw,jw), ipvt(kq) common /given/ nog, ig(ngc), jg(ngc) common /bound/ nobc, ibc(nbc), jbc(nbc) common /compx/ zp(ngc), zalp(nbc), phas(ngc) dimension period_g(85), waveH_g(85), angle0_g(85), dlevel_g(85) c zi=(0.0, 1.0) grav=9.8 pi=3.1415926 c 5
10 20 c c c c c c c c c c c c c c c
continue print*,'Key in the Control file name : ' read(*,'(a20)') confile open(1, file=confile, form='formatted',status='old', err=10) go to 20 print*,'File not found, or, type not matched ' go to 5 read(1,'(a70)') title print*, title call time(result)
name
: a 16 characters string to store the path, name of file. Later, three file types (chk, lis, grd) will be appended to open an input depth grid file and two output files. xorient: The angle of x-axis, counted clockwise from The North. xl, yl : The global x and y coordinates of the origin of the grid mp,np : Max. grid numbers in x and y direction, respectively. dx,dy : grid sizes in x and y direction, respectively. ncase : Number of cases (wave height, period, angle) in this control file dlevel: water elevation that added to the bathymetric depth, e.g. storm tide dmin : minimum water depth that will be considered as water read(1,'(a)') depfile
c
2.2
c c c
the following statement is needed to remove the space on right hand, since MS PowerStation uses all the space declared read(1,'(a)') bcdfile read(1,'(a)') outfile read(1,'(a)') chkfile
c read(1,*) yorient, xl, yl read(1,*) mp,np,dx,dy, ncase, dmin if(mp .gt. iq) then print*,'IQ is smaller than MP, change IQ to ',mp stop end if if(np .gt. jq) then print*,'JQ is smaller than NP, change JQ to ',np stop end if c r = dx/dy c c c c c c c
wave angle: counted clockwise, from North. For example, if waves come from NE, then the angle will be 45+180=225 degres. For wave coming from S, the angle will be 0 degrees. For waves coming from E, teh angle will be 90 degrees. The angle given is always reference to North. The angle that
52
print*,'The following waveH, period, and Angle are included' do ic=1,ncase read(1,*) waveH_g(ic),period_g(ic),angle0_g(ic),dlevel_g(ic) write(*,52) ic, waveH_g(ic), period_g(ic), angle0_g(ic), * dlevel_g(ic) format(' i, waveH(m), T(s), Ang(d),Surge(m)=',i4,2f8.2,2f7.1) end do
c c print*,'Output data goes to ', outfile open(9,file=outfile,form='formatted',status='unknown') c print*,'Water depth grid input from ',depfile call depth_in c print*,'Boundary condition input from ',bcdfile call bound_in c do 200 ic=1,ncase c print*,'Check data goes to ', chkfile open(11, file=chkfile, form='formatted',status='unknown') c print*,'case ',ic period=period_g(ic) waveH=waveh_g(ic)
2.3
angle0=angle0_g(ic) dlevel=dlevel_g(ic) c c c c c c c c c c c
change water depth, not now, wait until operational do i=1,mp do j=1,np dep(i,j)=dep(i,j)+dlevel end do end do wk0 : wave number at deep water
55
c c c c
wk0=4.0*pi*pi/(grav*period*period) write(11,'(a70)') title write(11,55) waveH, period, angle0, dlevel format(' waveH (m)=',f8.2/' T (s)=',f8.2/ * ' Ang (deg)=',f8.1/' Surge (m)=',f8.1/ * ' Given boundary conditions are specified at'/ * ' i j zph ')
calculate the given velocity potential based on wave height, period, direction, and grid locations
60
zpot=-zi*waveh*grav*period/(4.0*pi) do k=1,nog zp(k)=zpot*exp(zi*phas(k) ) write(11,60) ig(k),jg(k),zp(k) format(2i7,2f12.8) end do
c c construct the unknown COLUMN matrix ZX, in the eq. ZA*ZX=ZB c Get each unknown"s location: imap(map),jmap(map) c c map : the number of total unknown, or the length of X. later, c it is reassigned as N c map=0 do i=1,mp do j=1,np if(id(i,j) .ne. 'e' ) then map=map+1 imap(map)=i jmap(map)=j end if end do end do if(map .gt. kq) then print*,'Increase KQ to ', map stop end if c
2.4
c c c c c c c c c c c c c
if(n .lt. 0.9*kq) then print* print*,'----------------------------------------------' print*,'Its better to reduce the length of the Matrix,' print*,'KQ, & increase the length of matrix ZW: IW,' print*,'in order to reduce disk I/O' print*,'----------------------------------------------' end if print*,'Length of the Banded Matrix is',n print*,'The parameter KQ has been declared as',kq n: length of the banded matrix n=map
c c c
Set up the storage matrices ZA & IA and find out the band width mu=0 mL=0 do 80 map=1,n i=imap(map) j=jmap(map)
c if(id(i,j) .eq. '0') then call domain(i,j,map) go to 70 end if c if(id(i,j) .eq. 'g') then call given_bc(i,j,map) go to 70 end if c if(id(i,j) .eq. '1') then call bound_t(i,j,map) go to 70 end if if(id(i,j) .eq. '2') then call bound_b(i,j,map) go to 70 end if if(id(i,j) .eq. '3') then call bound_l(i,j,map) go to 70 end if if(id(i,j) .eq. '4') then call bound_r(i,j,map) go to 70 end if if(id(i,j).eq.'5' .or. id(i,j).eq.'o' .or. id(i,j).eq.'p') then call corner_lb(i,j,map) go to 70
2.5
end if if(id(i,j).eq.'6' .or. id(i,j).eq.'q' .or. id(i,j).eq.'r') then call corner_lt(i,j,map) go to 70 end if if(id(i,j).eq.'7' .or. id(i,j).eq.'u' .or. id(i,j).eq.'v') then call corner_rb(i,j,map) go to 70 end if if(id(i,j).eq.'8' .or. id(i,j).eq.'s' .or. id(i,j).eq.'t') then call corner_rt(i,j,map) go to 70 end if c 70
if(id(i,j).ne.'4' .and. id(i,j) .ne. '7' .and. id(i,j).ne.'8' * .and. id(i,j) .ne. 'c' .and. id(i,j) .ne. 'd' ) then mu_c=ia(map,5) - ia(map,3) else mu_c=0 end if if(mu_c .gt. mu) mu=mu_c if(id(i,j) .ne. '3' .and. id(i,j) .ne. '5'.and.id(i,j).ne. '6' * .and. id(i,j) .ne. 'a' .and. id(i,j) .ne. 'b' ) then mL_c=ia(map,3) - ia(map,1) else mL_c=0 end if if(mL_c .gt. mL) mL=mL_c write(11,75) i,j, ia(map,1),ia(map,2),ia(map,3), * ia(map,4),ia(map,5), za(map,1), za(map,2), * za(map,3), za(map,4),za(map,5), zb(map) 75 format(1x,2i5,3x,5i6,2x,2f7.3, 2x,2f7.3, 2x,2f7.3, * 2x,2f7.3, 2x,2f7.3, 2x,2f7.3 ) if(ia(map,1) .lt. 0 .or. ia(map,2) .lt. 0 .or. ia(map,3) .lt. 0 * .or. ia(map,4) .lt. 0 .or. ia(map,5) .lt. 0) then write(*,78) map,i,j, id(i,j), (ia(map,kk), kk=1,5) 78 format(' Map, i,j,id=',i10,2i5,a5/' ia(map,k)=',5i8/ * ' All 5 IAs should be non-negative, Check !') stop end if c 80
continue
c close(11) m=mL+mu+1 Lda=m+mL print*,'The band width & length =', m, n print*,'Upper band width=',mu print*,'Lower band width=',mL print*,'Lda for BMSOLVER=',Lda if(Lda .gt. iw) then write(*,90) Lda
2.6
90 c c c
format('Please change parameter IW to >=',i6,' and re-run') stop end if
uses the complex band matrix solver to solve ZA * ZX = ZB call bmsolver(ier_code)
c c c
output results if( ier_code .eq. 0) then
c 100 110 120 c
140
write(9,'(a60)') title write(9,100) mp,np, dx,dy format(2i5,2f10.6,2f10.3) write(9,110) yorient,xl,yl format(f10.2,2f10.5) write(9,120) waveh,period,angle0, dlevel, n format(4f10.3,i10/' i j id dep
real
imagin')
do k=1,n i=imap(k) j=jmap(k) write(9,140) i, j, id(i,j), dep(i,j), zb(k) format(2x,i5,1x,i5,a3,f10.4,2d18.10) end do
c 200
end if continue close(9)
c print*,result call time(result) print*,result c stop end c c----------------------------------------------------c subroutine depth_in c c This sub. reads ASCII depth grids, ID codes c implicit real*8 (a-h, o-y), integer*4 (i-n), complex*16 (z) parameter (iq=501, jq=401, nbc=1500, ngc=502) c character*70 dtitle,label character*20 depfile, bcdfile character*1 id c common /files/ depfile, bcdfile
2.7
common /bottm/ dep(iq,jq), id(iq,jq) common /gener/ mp, np, dx,dy, r, yorient, xl, yl, wk0 c
5
10
20 25
30
open(16, file=depfile, form='formatted',status='old') read(16,25) dtitle print*, dtitle read(16,25) label print*, label read(16,*) m_dep, n_dep, dx_d,dy_d, xl,yl,czmin,czmax,noz,yorii write(*,5) czmin, czmax, noz format(' The min., max., and # of raw survey are ',2f8.3,i8) if(m_dep .eq. mp .and. n_dep .eq. np .and. dx_d .eq. dx .and. * dy_d .eq. dy .and. yorii .eq. yorient) go to 20 write(*,10) m_dep, n_dep, dx_d, dy_d, yorii, * mp, np, dx, dy, yorient format(' The following two rows should be the same '/ * 5x,2i7, 2f10.3, f10.1/5x, 2i7, 2f10.3, f10.1/ * ' Found when reading depth grid file.'/' Usually this', * ' means the data file assignment is wrong.') stop continue read(16,25) label write(*,25) label format(a70) read(16,25) label do i=1,mp read(16,*) ins if(ins .eq. i) then read(16,*) (dep(i,j),j=1,np) else write(*,30) i,ins format(' Sequence wrong for depth input at',2i5) stop end if end do print*,'Completed reading water depth matrix, leave depth_in' close(16)
c return end c c----------------------------------------------------c subroutine bound_in c c This sub. reads ASCII given and radiation boundary conditions c implicit real*8 (a-h, o-y), integer*4 (i-n), complex*16 (z) parameter (iq=501, jq=401, nbc=1500, ngc=502) c character*70 dtitle,label character*20 bcdfile, depfile
2.8
character*1 id c common common common common common common
/files/ /bottm/ /gener/ /bound/ /given/ /compx/
depfile, bcdfile dep(iq,jq), id(iq,jq) mp, np, dx,dy, r, yorient, xl, yl, wk0 nobc, ibc(nbc), jbc(nbc) nog, ig(ngc), jg(ngc) zp(ngc), zalp(nbc), phas(ngc)
c open(15, file=bcdfile, form='formatted',status='old') c 2
5
read(15,2) dtitle format(a70) print*, dtitle read(15,2) label print*, label read(15,*) m_bcd, n_bcd, dx_b,dy_b, xl,yl,czmin,czmax,noz,yorii write(*,5) czmin, czmax, noz format(' The min., max., and # of raw survey are ',2f8.3,i8)
c
10
if(m_bcd .eq. mp .and. n_bcd .eq. np .and. dx_b .eq. dx .and. * dy_b .eq. dy .and. yorii .eq. yorient) go to 20 write(*,10) m_bcd, n_bcd, dx_b, dy_b, yorii, * mp, np, dx, dy, yorient format(' The following two rows should be the same '/ * 5x,2i7, 2f10.3, f10.1/5x, 2i7, 2f10.3, f10.1/ * ' Found when reading depth grid file.'/' Usually this', * ' means the data file assignment is wrong.') stop continue
20 c c ID code for each grid point c c : 0, water interior point c : 1, upper boundary condition c : 2, lower boundary condition c : 3, left boundary condition c : 4, right boundary condition c : 5, left bottom corner B.C. c : 6, left top corner B.C. c : 7, right bottom corner B.C. c : 8, right top corner B.C. c : g, grid point that have a given c : e, land point c : o, same as 5, also a given B.C. c : p, same as 5, also a given B.C. c : q, same as 6, also a given B.C. c : r, same as 6, also a given B.C. c : s, same as 7, also a given B.C. c : t, same as 7, also a given B.C. c : u, same as 8, also a given B.C. c : v, same as 8, also a given B.C.
2.9
wave condition for for for for for for for for
wave wave wave wave wave wave wave wave
coming coming coming coming coming coming coming coming
from from from from from from from from
bottom left left top top right right bottom
c c c c c c c c c c c c c c c c c c c c c c c
The following is an example j (y) ^ rgggggggggggggggggggggggggggggs | 3000000000000000000000000000004 | 3000000000000000000000000000004 | ............................... | or | | np eeeee611111111111111111111111118 .gggs .111t | q1111000000000000000000000000004 .0004 .000g | g0000000000000000000000000000004 .0004 .000g | g0000000000000000000000000000004 .0004 .000g | 30000000000000000000000000000004 .0004 .000g | 52200000000000000000000000222227 or .0004 or .000g | eee30000000000000000000004eeeeee .0004 .000g | eee30000000000000000000004eeeeee .0004 .000g | eee30000000000000000000004eeeeee .2227 .000g | 1 eeeogggggggggggggggggggggveeeeee .eeee .222u | 1 mp (x) |------------------------------------------------------------> i
30 35
c c c c c c c
read(15,2) label print*,label nblk=np/75 + 1 do nb=1,nblk read(15,2) label nb1=(nb-1)*75 + 1 nb2=nb1+74 if(nb2 .gt. np) nb2=np do i=1,mp read(15,30) ins1, (id(i,j),j=nb1,nb2) format(i5,75a1) if(ins1 .ne. i) then write(*,35) i,ins1 format(' Sequence wrong for ID input at',2i5) stop end if end do end do print*,'Completed reading ID code matrix'
nog
: number of grid points that a given wave boundary conditions are specified. ig,jg: one-D arrays to store the grid number of the boundary in I and J directions. read the grid number for given boundary points read(15,*) nog if(nog .gt. ngc) then print*,'NOG > NGC, change PARAMETER
2.10
NGC to ',nog
40
50
stop end if write(*,40) nog format(i5,' given boundary conditions') read(15,2) label print*,label do i=1,nog read(15,50) ins,ig(i),jg(i), id(ig(i),jg(i)), phas(i) format(1x,3i5,4x,a1,f10.5) if(ins .le. 3) then write(*,50) ins,ig(i),jg(i),id(ig(i),jg(i)), phas(i) end if end do print*,'Completed reading Given B.C.s'
c c nobc : number of grid points that a radiational B.C. is given c ibc,jbc: one-D arrays to store the grid number of the c boundary in I and J directions c zalp : one-D array to store wave reflection coefficient c at the boundary. If only one side is subject to c wave reflection (e.g., ID(i,j)=1, 2, 3, or 4), then c only the real part will be used. c If both sides are subject to wave reflection (e.g., c ID(i,j)=x, y), then the reflection coefficeint of c the second side will be stored as the imaginary part. c At a corner boundary point (e.g., ID=5,6,7,8), the c reflection coefficient in x direction is store as the c real part. The reflection coefficient in y direction c is stored in the imaginary part. c c read the radiational boundary points and the reflection coeff. c read(15,*) nobc if(nobc .gt. nbc) then print*,'NOBC > NBC, change parameter NBC to ',nobc stop end if write(*,60) nobc 60 format(i5,' radiational Boundary conditions') read(15,2) label print*, label zi=(0.0, 1.0) do i=1, nobc read(15,*) ins, ibc(i), jbc(i), id_bc, alp_r, alp_i zalp(i)=alp_r + zi*alp_i if(id_bc.ge.1 .and. id_bc.le.4 .and. alp_i.eq.0.0) go to 70 if(id_bc.ge.5 .and. id_bc.le.8) go to 70 write(*,65) i,ibc(i),jbc(i),id_bc, alp_i 65 format(' Boundary condition wrong at i, ibc,jbc= ',3i5/ * ' ID=',i3,' alp_i should = 0, but it is ',f8.3) stop 70 continue
2.11
if(alp_r .gt. 1.0 .or. alp_r .lt. 0.0 .or. alp_i .lt. 0.0 .or. alp_i .gt. 1.0) then write(*,80) i, ibc(i),jbc(i), alp_r, alp_i 80 format(' Boundary condition wrong at i, ibc,jbc= ',3i5/ * ' They should >= 0.0 and = m+ml, where ml is the lower band width. The size of JW depends on the available computer memory. In general, the large the JW, the less the disk IO, and thus, the faster the computing speed. As a rule of thumb, you may select JW = 2*IW and tried to see if your computer has enough memory to run the program. The procedures follows that given in the subroutine CGBFA & CGBSL from LINPACK. The major difference is just doing it one block at a time, stores the results in hard disk sequently. After forward elimination, reverse the process by reading the data from hard disk and do back substitute for the solution. implicit real*8 (a-h, o-y), integer*4 (i-n), complex*16 (z) parameter (iq=501, jq=401, kq=80000, iw=1000, jw=1700)
c character*8 tmpfile character*3 chrc character*1 id c common common common common common
/bottm/ /matrx/ /gener/ /unknw/ /works/
dep(iq,jq), id(iq,jq) za(kq,5), ia(kq,5), zb(kq) mp, np, dx,dy, r, yorient, xl,yl, wk0 n, mu, mL, m, Lda, imap(kq), jmap(kq) zw(iw,jw), ipvt(kq)
c cabs1(zdum)=abs(real(zdum)) + abs(aimag(zdum)) c c c c c c c c c
Gaussian elimination with partial pivoting NK: # of columns for the working matrix that will be saved. NW: The number of column needed for working, nw=m-1+nk NS: An index to show the number of working matrix. check working matrix dimension nk=450 nw=m+nk-1
c 5
10
write(*,5) iw, jw, Lda, nw format(' The working matrix, ZW(iw,jw) is ZW(',2i5,')'/ * ' The best condition should be iw ~> Lda= ',i5/ * ' and jw ~> nw = ',i5) if(nw .gt. jw) then write(*,10) Lda, nw format(' IW shoult be >= ',i5, ' and JW must be >=', i5/ * ' Please change program and re-run .'// * ' If no memory, you can reduce the NK') ierr_code=1 return end if
2.32
c c c
clear up the working matrix do i=1,iw do j=1,nw zw(i,j)=(0.0, 0.0) end do end do
c c c c c c c c
construct the first working matrix, ZW, which has a size of (Lda x nw). The thrify storaged matrices are expanded, only to the first (nk x 5) block. The flag is used to record, only onec, when ZA data starts lost. Later it will be used to re-fetch into the working matrix ns=0 map1=0 iflag=1 ne=nw if(ne .gt. n) ne=n
c do map=1,ne do i=1,5 j=ia(map,i) if(j .ne. 0) then if(j .le. nk+m-1) then ids=j-map zw(m-ids,j)=za(map,i) else if(iflag .eq. 1) then map1=map iflag=0 end if end if end if end do end do c c Gaussian elimination with partial pivoting c j1=min0(n,m)-1 jz=j1 ju=0 nt=0 index=0 c 100 continue c if(ju .ne. 0) ju=ju-nk if(jz .ne. j1) jz=jz-nk c
2.33
c c c
index=0, =1,
the first, 2nd, ..., block of matrix. the last block of matrix
if(index .eq. 0 .and. ne .ne. n) then nc=nk else nc=n-ns*nk-1 end if c do k=1,nc kp1=k+1 kr=ns*nk + k c c c
find L = pivot index Lm=min0(mL,n-ns*nk-k) L=icamax(Lm+1, zw(m,k), 1) + m -1 ipvt(kr)=L+kr-m
c c c c
zero pivot implies that this column are all zeros, a singular matrix. if(cabs1(zw(L,k)) .lt. 0.10e-8) goto 120
c c c
c c c c
interchange if necessary if(L .ne. m) then zt=zw(L,k) zw(L,k)=zw(m,k) zw(m,k)=zt print*,'************pivoting' end if compute multipliers zt=-(1.0d0,0.0d0)/zw(m,k) call cscal(Lm, zt, zw(m+1,k), 1)
c c c
swap ZB array, if necessary Lp=ipvt(kr) zt=zb(Lp) if(Lp .ne. kr) then zb(Lp)=zb(kr) zb(kr)=zt end if call caxpy(Lm, zt, zw(m+1,k), 1, zb(kr+1), 1)
c c c
row elimenation with column indexing ju=min0(max0(ju, mu+ipvt(kr)-ns*nk), n-ns*nk) mm=m
2.34
if(ju .ge. kp1) then do j=kp1,ju L=L-1 mm=mm-1 zt=zw(L,j) if(L .ne. mm) then zw(L,j)=zw(mm,j) zw(mm,j)=zt end if call caxpy(Lm, zt, zw(m+1,k), 1, zw(mm+1,j), 1) end do end if c go to 150 continue print*,'Zero diagonal element at (L,k)=', L, k stop 150 continue 120
c end do c c c c c
Eexcept the last working matrix, write the upper triangular matrix (from j=1,nk) into hard disk. For the last one, i.e., ncnk, go to back substitute directly. if(nc .eq. nk) then nt=nt+1 print*,'Writing tem. file #', nt tmpfile='t'//chrc(nt)//'.tmp' open(12,file=tmpfile,form='unformatted') write(12) ((zw(i,j),i=1,m),j=1,nk) close(12)
c c c
moving the rest working matrix forward to the beginning do j=nk+1, nk+m-1 L=j-nk do i=1,Lda zw(i,L)=zw(i,j) end do end do
c c c
clear the rest working area for reading new working matrix do j=m, nk+m-1 do i=1,Lda zw(i,j)=(0.0,0.0) end do end do
c c read in a full block of ZA and IA, by two steps c
2.35
ns=ns+1 if( (ns+1)*nk+m-1 .lt. n) then ne=nk index=0 c c c c c
For intermediate blocks, read in ZA and IA by two steps. First read in the upper triangular matrix that were cut off at the previous time when constructing the working matrix. if(map1 .ne. 0) then do map=map1, m-1+ns*nk do i=4,5 j=ia(map,i) if(j .ne. 0) then if(j .gt. m-1+ns*nk) then ids=j-map zw(m-ids,j-ns*nk)=za(map,i) end if end if end do end do end if
c c c
now read in next block of ZA and IA iflag=1 map1=0 do k=1,ne map=k + ns*nk + m-1 do i=1,5 j=ia(map,i) if(j .ne. 0) then if(j .le. ns*nk+ne+m-1) then ids=j-map zw(m-ids,j-ns*nk)=za(map,i) else if(iflag .eq. 1) then map1=map iflag=0 end if end if end if end do end do
c c c
End of read in a block of ZA and IA. else
c c c
This is to read the last block of ZA and IA ne=n-(m-1+ns*nk)
2.36
index=1 if(map1 .ne. 0) then do map=map1,m-1+ns*nk do i=4,5 j=ia(map,i) if(j .ne. 0) then if(j .gt. m-1+ns*nk) then ids=j-map zw(m-ids,j-ns*nk)=za(map,i) end if end if end do end do end if c c now read the last block of ZA and IA c iflag=1 map1=0 do k=1,ne map=m-1+ns*nk+k do i=1,5 j=ia(map,i) if(j .ne. 0) then if(j .le. m-1+ns*nk+ne) then ids=j-map zw(m-ids,j-ns*nk)=za(map,i) else ierr_code=2 write(*,180) 180 format(' If this happen, it is wrong. At the last ', * 'block,'/' it should have enough space to ', * 'include all the remaining matrix') return end if end if end do end do iflag=1 end if c goto 100 c else c c backward substitution from the last submatrix c if( nt .eq. 0) nc=n-1 do kb=1,nc+1 kr=n+1-kb k=nc+2-kb zb(kr)=zb(kr)/zw(m,k)
2.37
Lm=min0(kr,m)-1 La=m-Lm Lb=kr-Lm zt=-zb(kr) call caxpy(Lm, zt, zw(La,k), 1, zb(Lb), 1) end do c c c c
If one loop can include all elements, i.e., for a small banded matrix, just stops after this. if( nt .eq. 0 ) go to 400 end if
c c c
complete the rest backward substitute
ns=0 200 continue c c clear the working matrix for reading new submatrix from disk. c do j=1,nk+m-1 do i=1,m zw(i,j)=(0.0,0.0) end do end do c print*,'Reading tem. file #', nt open(14,file=tmpfile,form='unformatted') read(14) ((zw(i,j),i=1,m),j=1,nk) close(14,status='delete') c do kb=1,nk kr=n+1-(nc+1)-ns*nk-kb k=nk+1-kb zb(kr)=zb(kr)/zw(m,k) Lm=min0(kr,m)-1 La=m-Lm Lb=kr-Lm zt=-zb(kr) call caxpy(Lm, zt, zw(La,k), 1, zb(Lb), 1) end do ns=ns+1 nt=nt-1 tmpfile='t'//chrc(nt)//'.tmp' if(nt .gt. 0) goto 200 400 continue c c To restore the original sequence of ZB. Since it starts pivoting c at the 2nd. we started at 2nd too for restoring. c print*,'Restore the original sequency'
2.38
do 1000 kb=2,n k=n+1-kb L=ipvt(k) zt=zb(L) if( L .eq. k ) go to 1000 print*,'pivoting at L,k,kb=',L,k,kb zb(L)=zb(k) zb(k)=zt 1000 continue c return end c c character*3 function chrc(nt) c c It changes an input integer number NT to character c CHANGQING LI 06/94 c character*1 c1 character*2 c2 character*3 c3 c i1=nt i2=i1/10 if(i2 .gt. 0) then i3=i2/10 if(i3 .gt. 0) then i4=i3/10 if(i4 .gt. 0) then print*,'----------------------------------------' print*,'The given integer is > 999, not allowed.' print*,'----------------------------------------' chrc='-1' else c3=char(48+i3)//char(48+i2-i3*10)//char(48+i1-i2*10) chrc=c3 c write(11,*) c3 end if else c2=char(48+i2)//char(48+i1-i2*10) chrc=c2 c write(11,*) c2 end if else c1=char(48+i1) chrc=c1 c write(11,*) c1 end if c return end
2.39
c c SUBROUTINE CSCAL(N,ZCA,ZCX,INCX) C C C C C C C C C C C C C C C C C C C C C C C C C C C C C C C C
PURPOSE Complex vector scale x = a*x WRITTEN on Oct. 1, 79, REVISION on Aug. 01, 82 CATEGORY NO. D1A6 KEYWORDS BLAS,COMPLEX,LINEAR ALGEBRA,SCALE,VECTOR AUTHORS LAWSON, C. L., (JPL), HANSON, R. J., (SNLA) KINCAID, D. R., (U. OF TEXAS), and KROGH, F. T., (JPL) DESCRIPTION B L A S Subprogram Description of Parameters --Input-N number of elements in input vector(s) CA complex scale factor CX complex vector with N elements INCX storage spacing between elements of CX --Output-CSCAL complex result (unchanged if N .LE. 0) replace complex CX by complex CA*CX. For I = 0 to N-1, replace CX(1+I*INCX) with CA * CX(1+I*INCX) REFERENCES: LAWSON C.L., HANSON R.J., KINCAID D.R., KROGH F.T., "BASIC LINEAR ALGEBRA SUBPROGRAMS FOR FORTRAN USAGE," ALGORITHM NO. 539, TRANSACTIONS ON MATHEMATICAL SOFTWARE, VOLUME 5, NUMBER 3, SEPTEMBER 1979, 308-323 ROUTINES CALLED (NONE) implicit real*8 (a-h, o-y), integer*4 (i-n), complex*16 (z) dimension zcx(1) COMPLEX*8 CA, CX(1) FIRST EXECUTABLE STATEMENT CSCAL IF(N .LE. 0) RETURN NS = N*INCX DO I = 1,NS,INCX ZCX(I) = ZCA*ZCX(I) end do RETURN END
c c SUBROUTINE CAXPY(N,ZCA,ZCX,INCX,ZCY,INCY) C C C C C
WRITTEN on Oct. 01, 79, REVISION on April 25, 84 CATEGORY NO. D1A7 KEYWORDS BLAS,COMPLEX,LINEAR ALGEBRA,TRIAD,VECTOR AUTHOR LAWSON, C. L., (JPL), HANSON, R. J., (SNLA)
2.40
C C C C C C C C C C C C C C C C C C C C c c C C C C C C C C C C
KINCAID, D. R., (U. OF TEXAS), KROGH, F. T., (JPL) PURPOSE Complex computation y = a*x + y DESCRIPTION B L A S Subprogram Description of Parameters --Input-N number of elements in input vector(s) ZCA complex scalar multiplier ZCX complex vector with N elements INCX storage spacing between elements of CX ZCY complex vector with N elements INCY storage spacing between elements of CY --Output-ZCY complex result (unchanged if N .LE. 0) Overwrite complex ZCY with complex ZCA*ZCX + ZCY. For I = 0 to N-1, replace ZCY(LY+I*INCY) with ZCA*ZCX(LX+I*INCX) + ZCY(LY+I*INCY), where LX = 1 if INCX .GE. 0, else LX = (-INCX)*N and LY is defined in a similar way using INCY. REFERENCES LAWSON C.L., HANSON R.J., KINCAID D.R., KROGH F.T., *BASIC LINEAR ALGEBRA SUBPROGRAMS FOR FORTRAN USAGE*, ALGORITHM NO. 539, TRANSACTIONS ON MATHEMATICAL SOFTWARE, VOLUME 5, NUMBER 3, SEPTEMBER 1979, 308-323 ROUTINES CALLED (NONE) implicit real*8 (a-h, o-y), integer*4 (i-n), complex*16 (z) dimension zcx(1), zcy(1) COMPLEX CX(1),CY(1),CA FIRST EXECUTABLE STATEMENT CAXPY CANORM = ABS(REAL(ZCA)) + ABS(AIMAG(ZCA)) IF(N.LE.0 .OR. CANORM.EQ.0.E0) RETURN IF(INCX.EQ.INCY.AND.INCX.GT.0) GO TO 20 KX = 1 KY = 1 IF(INCX.LT.0) KX = 1+(1-N)*INCX IF(INCY.LT.0) KY = 1+(1-N)*INCY DO 10 I = 1,N ZCY(KY) = ZCY(KY) + ZCA*ZCX(KX) KX = KX + INCX KY = KY + INCY 10 CONTINUE RETURN 20 CONTINUE NS = N*INCX DO 30 I=1,NS,INCX ZCY(I) = ZCA*ZCX(I) + ZCY(I) 30 CONTINUE
2.41
RETURN END c c INTEGER FUNCTION ICAMAX(N,zCX,INCX) c C C C C C C C C C C C C C C C C C C C C C C C C C C C C C C C C
WRITTEN on Oct. 01, 79, REVISed on Aug. 01, 82 CATEGORY NO. D1A2 KEYWORDS BLAS,COMPLEX,LINEAR ALGEBRA,MAXIMUM COMPONENT,VECTOR AUTHOR LAWSON, C. L., (JPL), HANSON, R. J., (SNLA) KINCAID, D. R., (U. OF TEXAS), KROGH, F. T., (JPL) PURPOSE Find the location (or index) of the largest component of a complex vector DESCRIPTION B L A S Subprogram Description of Parameters --Input-N number of elements in input vector(s) zCX complex vector with N elements INCX storage spacing between elements of CX --Output-ICAMAX smallest index (zero if N .LE. 0) Returns the index of the component of CX having the largest sum of magnitudes of real and imaginary parts. ICAMAX = first I, I = 1 to N, to minimize ABS(REAL(CX(1-INCX+I*INCX))) + ABS(IMAG(CX(1-INCX+I*INCX))) REFERENCES LAWSON C.L., HANSON R.J., KINCAID D.R., KROGH F.T., *BASIC LINEAR ALGEBRA SUBPROGRAMS FOR FORTRAN USAGE*, ALGORITHM NO. 539, TRANSACTIONS ON MATHEMATICAL SOFTWARE, VOLUME 5, NUMBER 3, SEPTEMBER 1979, 308-323 ROUTINES CALLED (NONE)
implicit real*8 (a-h, o-y), integer*4 (i-n), complex*16 (z) dimension zcx(1) C COMPLEX CX(1) C***FIRST EXECUTABLE STATEMENT ICAMAX ICAMAX = 0 IF(N .LE. 0) RETURN ICAMAX = 1 IF(N .LE. 1) RETURN NS = N*INCX II = 1 SUMMAX = ABS(REAL(zCX(1))) + ABS(AIMAG(zCX(1))) DO 20 I=1,NS,INCX SUMRI = ABS(REAL(zCX(I))) + ABS(AIMAG(zCX(I))) IF(SUMMAX .GE. SUMRI) GO TO 10
2.42
SUMMAX = SUMRI ICAMAX = II 10 II = II + 1 20 CONTINUE RETURN END c c c function wn(depth, period) c c c c c c
This function calculate the airy's wave number period : in second. depth : in meter. wavek : in meter^-1 implicit real*8 (a-h, o-y) grav=9.8 dol0=depth/(1.56*period*period) if (dol0 .ge. 0.7) then wavel=1.56*period*period wavekh=6.2832*depth/wavel else if (dol0 .ge. 0.01) then cgm=6.2832/period y=cgm*cgm*depth/grav sum=1.0 + 0.6666666666*y + 0.355555555*y*y + * 0.1608465608*y*y*y + 0.0632098765*y*y*y*y + * 0.0217540484*y*y*y*y*y + 0.00654078*y*y*y*y*y*y wavekh=sqrt(y*y + y/sum) else
c c c
long wave c=sqrt(grav*depth) wavel=c*period wavekh=6.2832*depth/wavel end if end if
c wn=wavekh/depth return end c c subroutine e012(x,e0,e1,e2) c c c c c c
Massel's subroutine for calculating the three coefficients e0 is for bottom slope term. e1 is for slope square term. e2 is for curvature term. x = kh, is the only input parameter.
2.43
c implicit real*8 (a-h, o-y) sh=sinh(x) ch=cosh(x) th=tanh(x) dum=th + x*(1.0 - th*th) e0=x/dum*(1.0 - 3.0*th*th + 2.0*th/dum) c sh2=sinh(2.0*x) sh3=sinh(3.0*x) ch3=cosh(3.0*x) sh5=sinh(5.0*x) ch5=cosh(5.0*x) p=0.5*(1.0+2.0*x/sh2) t1w=1.0/(24.0*ch**3*(2.0*x+sh2)**2)* (x*(12.0+16.0*x**2)*ch + * 6.0*x*(ch3+ch5) + sh*(12.0+84.0*x**2) + * 3.0*(1.0-4.0*x**2)*sh3 -9.0*sh5) t2=0.125*(-4.0*x*ch + sh +8.0*x**2*sh + sh3)/ch**3/(2.0*x+sh2) * x/2.0*th/ch**2 e1=t1w/p/th e2=t2/p return end c
2.44
Appendix III. FORTRAN program to generate the input data file for plotting. The input file for this program is the output file generated by RDE.FOR program outform c c c c c c c c c c c c c c c c c c c c c c c c c
This program is the first post-process program for the program RDE.FOR. It converts the one-dimensional output to a two dimensional format for a faster graphic using RDPLT.M In this program, the conversion of x and y coodnated are NOT non-dimensionalized. This is for the convenience of comparison. iq,jq : parameters specified for reserving space for 2-D arrays. They should be at least the same as mp and np. mp,np : number of grid points in x and y direction, respectively. In applications, the x-axis should be parallel to the longer dimension of the water body. The y axis should parallel to the short dimension of the water body. This allignment will generate a smaller banded width. dx,dy : grid sizes in x and y direction, respectively. In this program, only the equally spaced grid is allowed. But dx do not have to equal to dy. tide : water elev. that added to the bathymetric depth for storm tide. dmin : min. water depth at a point that this point will be considered as water. id : a 2-D array to store the identification for each grid point. 0 for water cell; 1 for land cell. parameter (iq=330, jq=263)
c implicit real*8 (a-h,o-z) character*70 title,label character*5 name character*12 infile character*20 outfile character*1 idc character*2 chrc integer*1 id(iq,jq) c dimension wh(iq,jq), s(iq,jq), dep(iq,jq), dir(iq,jq) c pi=3.1415926 twopi=2.0*pi grav=9.8 c c c
Input bathemetry and incident wave condition print*,' Key in the input filename : ' read(*,'(a)') name
c
3.1
infile=name // '.lis' print*,'Input file name : ', infile open(1, file=infile, form='formatted',status='old') c 25
icase=0 continue icase=icase+1
c read(1,'(a70)', end=1000) title print*, title c c c c c c c
mp,np : Max. grid numbers in x and y direction, respectively. dx,dy : grid sizes in x and y direction, respectively. tide : water elev. that added to the bathymetric depth, e.g. storm tide dmin : min. water depth that will be considered as water read(1,*) mp,np,dx,dy if(mp .gt. iq) then print*,'IQ is smaller than MP, change IQ to ',mp stop end if if(np .gt. jq) then print*,'JQ is smaller than NP, change JQ to ',np stop end if
c c c
clear the matrices print*,'Clean the matrices...' do i=1,mp do j=1,np id(i,j)=1 dep(i,j)=0.0 wh(i,j)=0.0 s(i,j)=0.0 dir(i,j)=0.0 end do end do
c c c c
yorient: The azimuth of y-axis related to the True North xl, yl : The x and y coordinates of the origin of the grid read(1,*) yorient, xl, yl
c 30
read(1,*) waveH, period, angle0, tide, map write(*,30) waveH, period, angle0, tide format(' wave height(m)=',f8.3/' Period (s)=',f8.2/ * ' Angle(deg)=',f8.1/' Tide (m) =',f8.2)
c read(1,35) label write(*,35) label
3.2
35
format(a50) ph_g=grav*period*waveh/(4.0*pi)
c 65
c 70
80
do n=1,map read(1,65) i,j,idc,depth,phr,phi format(2x,i5,1x,i5,a3,f10.4,2d18.10) dep(i,j)=depth h=sqrt(phr*phr + phi*phi) wh(i,j)=h/ph_g s(i,j)=datan2(phi, phr) if( s(i,j) .lt. 0.0) s(i,j)=s(i,j) + twopi if(idc .ne. 'e') id(i,j)=0 if(i .eq. mp .and. j .eq. np) go to 70 end do mb=1 me=mp outfile=name // '_' // chrc(icase) // '.out' print*,'outfile name = ', outfile open(12,file=outfile,form='formatted',status='unknown') write(12,'(a60)') title write(12,80) mp,np, dx,dy, dmin, yorient,xl,yl format(2i5,2f10.5,2f10.3/f10.2,2f10.5) write(12,90) waveh,period,angle0, tide format(4f10.3)
90 c c write the ID code first c write(12,125) 125 format(' I.D. code for each grid point'/' +-------------> i') do j=1,np jj=np-j+1 write(12,130) jj, (id(i,jj),i=mb,me) 130 format(i5/(40i2)) end do c c write the wave height c write(12,135) 135 format(' Normalized wave height at each grid point'/ * ' +------------> i') do j=1,np jj=np-j+1 write(12,140) jj, (wh(i,jj),i=mb,me) 140 format(i5/(10f8.5)) end do c write(12,145) 145 format(' Wave phase for each grid point'/' +-------------> i') do j=1,np jj=np-j+1 write(12,150) jj, (s(i,jj),i=mb,me)
3.3
150
format(i5/(10f8.5)) end do
c pi=3.1415926 twopi=2.0*pi c c Calculate wave directions. Notice that the phase value only changes c from 0 to 2*pi. When it is more than 2*pi, it drop back to a little c more than 0. This cause problem for calculate wave direction c because it is not a continuous function (it is, but computer c can not understand it. So we set up a criterion: when the change of c phase is more than 4.0, it means the two grid points just across a c drop. We simply change the small phase S to S+2*PI and continue the c calculation. c do i=2, mp-1 do j=2, np-1 dss= s(i,j+1) - s(i,j-1) if( dss .lt. -4.0) dss=dss+twopi if( dss .gt. 4.0) dss=dss-twopi dsdy=dss/(2*dy) dss= s(i+1,j) - s(i-1,j) if( dss .lt. -4.0) dss=dss+twopi if( dss .gt. 4.0) dss=dss-twopi dsdx=dss/(2*dx) dir(i,j)=atan2(dsdy, dsdx) end do end do c do i=2, mp-1 dss= s(i,np) - s(i,np-1) if( dss .lt. -4.0) dss=dss+twopi if( dss .gt. 4.0) dss=dss-twopi dsdy=dss/dy dss= s(i+1,np) - s(i-1,np) if( dss .lt. -4.0) dss=dss+twopi if( dss .gt. 4.0) dss=dss-twopi dsdx=dss/(2.0*dx) dir(i,np)=atan2(dsdy, dsdx) end do c do i=2, mp-1 dss= s(i,2) - s(i,1) if( dss .lt. -4.0) dss=dss+twopi if( dss .gt. 4.0) dss=dss-twopi dsdy=dss/dy dss= s(i+1,1) - s(i-1,1) if( dss .lt. -4.0) dss=dss+twopi if( dss .gt. 4.0) dss=dss-twopi dsdx=dss/(2.0*dx) dir(i,1)=atan2(dsdy, dsdx) end do
3.4
c do j=2, np-1 dss= s(1,j+1) - s(1,j-1) if( dss .lt. -4.0) dss=dss+twopi if( dss .gt. 4.0) dss=dss-twopi dsdy=dss/(2.0*dy) dss= s(2,j) - s(1,j) if( dss .lt. -4.0) dss=dss+twopi if( dss .gt. 4.0) dss=dss-twopi dsdx=dss/dx dir(1,j)=atan2(dsdy, dsdx) end do c do j=2, np-1 dss= s(mp,j+1) - s(mp,j-1) if( dss .lt. -4.0) dss=dss+twopi if( dss .gt. 4.0) dss=dss-twopi dsdy=dss/(2.0*dy) dss= s(mp,j) - s(mp-1,j) if( dss .lt. -4.0) dss=dss+twopi if( dss .gt. 4.0) dss=dss-twopi dsdx=dss/dx dir(mp,j)=atan2(dsdy, dsdx) end do c 155
160
write(12,155) format(' Wave direction at each grid point'/' +------------> i') do j=1,np jj=np-j+1 write(12,160) jj, (dir(i,jj),i=mb,me) format(i5/(10f8.4)) end do
c 195
200
write(12,195) format(' Water depth for each grid point'/' +------------> i') do j=1,np jj=np-j+1 write(12,200) jj, (dep(i,jj),i=mb,me) format(i5/(10f8.3)) end do close(12)
c 1000
go to 25 continue stop end
c c character*2 function chrc(nt) c c It changes an input integer number NT to character
3.5
c character*2 c1 character*2 c2 c
c
c
i1=nt i2=i1/10 if(i2 .gt. 0) then i3=i2/10 if(i3 .gt. 0) then print*,'----------------------------------------' print*,'The given integer is > 99, not allowed.' print*,'----------------------------------------' chrc='-1' else c2=char(48+i2)//char(48+i1-i2*10) chrc=c2 write(11,*) c2 end if else c1=char(48+i1) chrc='0' // c1 write(11,*) c1 end if
c return end
3.6
Appendix IV. Matlab program (RDEPLOT.M) to generate graphics as the final output of the program RDE.FOR The input data files are from the program OUTFORM.FOR. % Program RDEPLOT.M % MathLab M file for plotting the outputs of RDE.FOR % It uses MatLab ver. 4.2C.1 for WINDOWS % % Program developed by Jerome P.-Y. Maa at % Virginia Institute of Marine Science, Feb. 1996 % clc; % % The directory (c:\break\*.out) may change for different application % [name,path]=uigetfile('c:\break\*.out','Available Data files'); file=[path,name]; [fid, message]=fopen(file); if fid == -1 message end % % read contour lines information % [name,path]=uigetfile('c:\break\*.lvl','Available contour level files'); file_lvl=[path,name]; [fid_lvl, message]=fopen(file_lvl); if fid_lvl == -1 message end ftitle=fgetl(fid_lvl); disp(ftitle); nh=fscanf(fid_lvl, '%d', 1); v_h=fscanf(fid_lvl, '%f', nh); ns=fscanf(fid_lvl, '%d', 1); v_s=fscanf(fid_lvl, '%f', ns); ndep=fscanf(fid_lvl, '%d', 1); v_dep=fscanf(fid_lvl, '%f', ndep); fclose(fid_lvl); % % read data % ftitle=fgetl(fid); disp(ftitle); mp=fscanf(fid, '%d', 1); np=fscanf(fid, '%d', 1); dx=fscanf(fid, '%f', 1); dy=fscanf(fid, '%f', 1); dmin=fscanf(fid, '%f', 1); dlevel=fscanf(fid, '%f', 1); disp(['mp= ',int2str(mp), ' np= ',int2str(np)] );
4.1
disp(['dx= ',num2str(dx), ' dy= ',num2str(dy)] ); xl=fscanf(fid, '%f', 1); yl=fscanf(fid, '%f', 1); yorient=fscanf(fid, '%f', 1); disp(['Yorient= ', num2str(yorient)] ); % waveh=fscanf(fid, '%f', 1); period=fscanf(fid, '%f', 1); angle0=fscanf(fid, '%f', 1); % disp(fgetl(fid) ); disp(fgetl(fid) ); fgetl(fid); % % read ID codes % id=[]; for j=1:np jj=np-j+1; jnk=fscanf(fid, '%d', 1); if jnk ~= jj disp(['ID Seq. error, j=',int2str(jnk),' jj=',int2str(jj)] ); disp('paused'); pause; end a=fscanf(fid, '%d', mp); id(jj, 1:mp)=a'; end clear a; % % read normalized wave heights % disp(fgetl(fid) ); disp(fgetl(fid) ); fgetl(fid); waveh=[]; for j=1:np jj=np-j+1; nk=fscanf(fid, '%d', 1); if nk ~= jj disp(['WaveH Seq. error, j=',int2str(nk),'jj=',int2str(jj)]); disp('paused'); pause; end a=fscanf(fid,'%f', mp); waveh(jj, 1:mp)=a'; end % % read phases % disp(fgetl(fid) ); disp(fgetl(fid) );
4.2
fgetl(fid); s=[]; for j=1:np jj=np-j+1; nk=fscanf(fid, '%d', 1); if nk ~= jj disp(['Phase Seq. error, j=',int2str(nk),'jj=',int2str(jj)]); disp('paused'); pause; end a=fscanf(fid,'%f', mp); s(jj, 1:mp)=a'; end % % read wave direction % disp(fgetl(fid) ); disp(fgetl(fid) );; fgetl(fid); dir=[]; for j=1:np jj=np-j+1; nk=fscanf(fid, '%d', 1); if nk ~= jj disp(['Dir Seq. error, j=',int2str(nk),'jj=',int2str(jj)] ); disp('paused'); pause; end a=fscanf(fid,'%f', mp); % % Because x axis is vertical and y axis is horizontal when plotting % The angle is calculated to reflect this % dir(jj, 1:mp)=a'; end % % read water depth % disp(fgetl(fid) ); disp(fgetl(fid) );; fgetl(fid); d=[]; for j=1:np jj=np-j+1; nk=fscanf(fid, '%d', 1); if nk ~= jj disp(['Depth Seq. error, j=',int2str(nk),'jj=',int2str(jj)]); disp('paused'); pause; end a=fscanf(fid,'%f', mp); d(jj, 1:mp)=a';
4.3
end clear a; fclose(fid); % % %
find the coordinates of x & y xmax=(mp-1)*dx; xmin=0; ymin=0; ymax=(np-1)*dy;
% axis_ratio=(xmax-xmin)/(ymax-ymin); % clc; dep_sel=0.5; disp('After plotted, you may drag a area for zoom in'); disp(' or use left mouse bottom to zoom in 2 times'); disp(' right mouse bottom to zoom out'); disp('The following options are available :'); disp(' 1. select plot area '); disp(' 2. plot wave height contours'); disp(' 3. plot wave vectors'); disp(' 4. plot water depth contours'); disp(' 5. plot wave phases'); disp(' 6. plot a profile parallel to X axis'); disp(' 7. plot a profile parallel to Y axis'); disp(' -1. exit'); iop=input('please select : '); if size(iop) == 0 iop=0; end % while (iop+1) %
%
if iop == 1 disp(['X axis ranged from ',num2str(xmin), ' to num2str(xmax),' km']); xs1=input('Select the min. of X plotting domain xs2=input('Select the max. of X plotting domain select Y dmain for plotting disp(['Y axis ranges from ', num2str(ymin),' to num2str(ymax),' km']); ys1=input('Select the min. of Y plotting domain ys2=input('Select the max. of Y plotting domain xc=xs1:dx:xs2; yc=ys1:dy:ys2; end
% % Plot the normalized wave height contours % if iop == 2 figure(1); clf; zoom off;
4.4
', : '); : '); ', : '); : ');
axis equal; set(gca,'linewidth',1); [cl,hhh]=contour(xc, yc, waveh, v_h); set(hhh, 'linewidth',2); clabel(cl, 'manual'); xlabel('x'); ylabel('y'); title('Wave Height Contours', 'fontsize',18); ans1=input('To: 0.hpgl file; 1.BMP file; 2.gif file : '); if ans1 == 0 print figure1 -dhpgl; end if ans1 == 1 print figure1 -dbmp256; end if ans1 == 2 print figure1 -dgif8; end zoom on; end % % %
plots the vectors
if iop == 3 % select X domain for plotting ans2=input('Want depth contour plots underlay the phase plot ? ', 's'); format short; clc; nx=input('to skip how many vectors in X domain : '); dxn=nx*dx; is1=xs1/dx+1; is2=xs2/dx+1; disp(['Selected area from i = ',int2str(is1),' to ', int2str(is2) ]); % select Y dmain for plotting ny=input('to skip how many vectors in y domain : '); dyn=dy*ny; js1=ys1/dy+1; js2=ys2/dy+1; disp(['Selected area from j = ',int2str(js1),' to ', int2str(js2) ]); xc=xs1:dxn:xs2; yc=ys1:dyn:ys2; % find the sub_matrix figure(2); clf; zoom off; waveh_s=[]; dir_s=[]; dep_s=[]; axis equal; mv_a=size(xc'); nv_a=size(yc'); mv=mv_a(1); nv=nv_a(1); for i=1: mv iold=is1+(i-1)*nx; for j=1:nv
4.5
jold=js1+(j-1)*ny; waveh_s(j,i)=waveh(jold, iold); dir_s(j,i)=dir(jold, iold); dep_s(j,i)=d(jold, iold); end end u=waveh_s.*cos(dir_s); v=waveh_s.*sin(dir_s); quiver(xc, yc, u, v, 2); set(gca,'aspectratio',[axis_ratio,1]); set(gca,'xlim',[xs1,xs2], 'ylim',[ys1,ys2]); xlabel('X (m)'); ylabel('Y (m)'); title('Wave Vectors'); if ans2 =='y' hold on; cl=contour(xc, yc, dep_s, v_dep); end ans2_2=input('To: 0.hpgl file; 1.BMP file; 2.gif file :'); if ans2_2 == 0 print figure2 -dhpgl; end if ans2_2 == 1 print figure2 -dbmp256; end if ans2_2 == 2 print figure2 -dgif8; end zoom on; end % % %
plot the depth contours
if iop == 4 figure(3); clf; zoom off; grid off; xc=xmin:dx:xmax; yc=ymin:dy:ymax; axis equal; [cl,hhh]=contour(xc, yc, d, v_dep); set(hhh, 'linewidth',3) set(gca,'aspectratio',[axis_ratio,1]); set(gca,'xlim',[xmin,xmax],'ylim',[ymin,ymax]); clabel(cl, 'manual'); xlabel('X (m)'); ylabel('Y (m)'); title('Water Depth Contours'); % check if need other type of output ans3=input('To: 0.return; 1.gif file; 2.BMP file : '); if ans3 == 1 print figure3 -dgif8; end if ans3 == 2 print figure3 -dbmp256; end zoom on; end % % plot the phase contours % if iop == 5 ans4=input('Want depth contour plots underlay the phase plot ? ', 's'); figure(4);
4.6
clf; zoom off; axis equal; xc=xmin:dx:xmax; yc=ymin:dy:ymax; cl=contour(xc, yc, s, v_s); set(gca,'aspectratio',[axis_ratio,1]); set(gca,'xlim',[xmin,xmax], 'ylim',[ymin,ymax]); clabel(cl, 'manual'); xlabel('X (m)'); ylabel('Y (m)'); title('Wave Phase Contours'); if ans4 =='y' hold on; cl=contour(xc, yc, d, v_dep); end ans4_2=input('To: 0.return; 1.BMP; 2.gif; 3.HPGL file: '); if ans4_2 == 1 print figure4 -dbmp256; end if ans4_2 == 2 print figure4 -dgif8; end if ans4_2 == 3 print figure4 -dhpgl; end zoom on; end % % %
plot wave height profile parallel to x axis if iop == 6 ks5=input(['Select a y grid number : ']); for i=1:mp yas(i)=waveh(ks5,i); das(i)=dep_sel - d(ks5,i); end ans51=input('Experimental data file name : ', 's'); namei=['\break\berk\', ans51, '.txt']; nameo=['\break\', ans51,'.dat']; disp(['Data coming from ', namei]); [fidi, message]=fopen(namei, 'r'); if fidi == -1 message end ftitle=fgetl(fidi); disp(ftitle); ndata=fscanf(fidi, '%d', 1); ftitle=fgetl(fidi); ftitle=fgetl(fidi); disp(ftitle); xd1=[]; yd=[]; for j=1:ndata a=fscanf(fid,'%f', 2); xd1(j)=a(1); yd(j)=a(2); end fclose(fidi);
4.7
xd=25.5-xd1 xw(1)=xc(3); xw(2)=xc(mp-3);
yw(1)=dep_sel;
yw(2)=dep_sel;
% figure(5) clf; zoom off; plot(xc, yas, 'r-', 'linewidth',3); hold on; plot(xc,das,'k-','linewidth',2); hold on; plot(xw,yw, 'g-', 'linewidth', 2); hold on; plot(xd,yd, 'ro', 'linewidth',3); set(gca, 'xlim', [4, 15]); set(gca, 'ylim', [0, 2.5]); ans52=input('To: 0.HPGL file; 1.BMP file; 2.gif file : '); if ans52 == 0 print figure5 -dhpgl; end if ans52 == 1 print figure5 -dbmp256; end if ans52 == 2 print figure5 -dgif8; end zoom on; ans52=input('Save in an ASCII file XPROFILE : ', 's'); if ans52 == 'y' [fido, message]=fopen(nameo,'wt'); if fid == -1 message end for i=1:mp fprintf(fido,'%10.4f %10.4f %10.4f\n',xc(i), das(i), yas(i) ); end fclose(fido); disp(['data is in file ', nameo]); end end % % %
plot wave height profile paralel to y axis
if iop == 7 ks6=input(['Select a x grid number :']); for j=1:np yas2(j)=waveh(j,ks6); das2(j)=dep_sel - d(j,ks6); end % save data to a disk file ans51=input('Experimental data file name : ', 's'); nameo=['\break\', ans51,'.dat']; % namei=['\break\berk\', ans51, '.txt']; disp(['Data coming from ', namei]); [fidi, message]=fopen(namei, 'r'); if fidi == -1 message
4.8
end ftitle=fgetl(fidi); disp(ftitle); ndata=fscanf(fidi, '%d', 1); ftitle=fgetl(fidi); ftitle=fgetl(fidi); disp(ftitle); xd1=[]; yd=[]; for j=1:ndata a=fscanf(fid,'%f', 2); xd1(j)=a(1); yd(j)=a(2); end fclose(fidi); xd=25.5-xd1 % ans61=input('Save in an ASCII file YPROFILE : ', 's'); if ans61 == 'y' outdata=[yc; das2; yas2]; [fido, message]=fopen(nameo,'wt'); if fido == -1 message end fprintf(fido,'%10.4f %10.4f %10.4f\n',outdata); fclose(fido); disp(['Data is in file : ', nameo]); end; % figure(6); clf; zoom off; axis equal; plot(yc, yas2, 'r-', 'linewidth',3); xw(1)=yc(2); xw(2)=yc(np-2); yw(1)=dep_sel; yw(2)=dep_sel; hold on; plot(xw,yw, 'g-', 'linewidth', 2); xlabel('Y (m)', 'fontsize', 15); ylabel('Wave Height (cm)', 'fontsize', 15); hold on; plot(yc,das2,'k-','linewidth',2); ans62=input('To: 0.return; 1.BMP file; 2.gif file : '); if ans62 == 1 print figure6 -dbmp256; end if ans62 == 2 print figure6 -dgif8; end zoom on; end % % %
plot wave trajectories if iop == 8 q81=input('Want Depth contours overlap ? : ', 's'); q82=input('Want plot every trajectories? : ', 's');
4.9
if q82 == 'n' jsk=input(' Skips how many grid points < 2, 3, 4>: '); else jsk=1; end ntraj=fix((np-5)/jsk); figure(8); clf; axis equal; zoom off; set(gca,'aspectratio',[axis_ratio,1]); set(gca,'xlim',[xmin,xmax], 'ylim',[ymin,ymax]); xlabel('X (m)'); ylabel('Y (m)'); title('Wave Trajectory Plot'); hold on; % compute locations of every point in a trajectory for j=1: ntraj xt=[]; yt=[]; k=1; kp=(j-1)*jsk + 10; if kp < (np-10) x1=xmax; y1=yc(kp); xt(k)=x1; yt(k)=y1; disp(['Traj. line #',int2str(j),', j=',int2str(kp)] ); angle=dir(kp,mp); for i=1:mp-1 ii=mp-i; k=k+1; x2=x1 - dx; y2=y1 + dx*sin(angle ); % find where the intersect point located in next x-grid level for L=2:np-1 if yc(L) dir1 angle= dir1 + slope*d1; else angle= dir2 + slope*(dy - d1); end % dep1=d(Ldown, ii);
4.10
dep2=d(Lup,ii); slope=abs(dep2- dep1)/dy; if dep2 > dep1 dep = dep1 + slope*d1; else dep = dep2 + slope*(dy - d1); end %
%
%
if dep >= 0.0 xt(k)=x2; yt(k)=y2; x1=x2; y1=y2; end end completed one trajectory line plot(xt,yt,'-'); hold on; end move to the start point of next trajectory line end
% hold on; if q81 == 'y' contour(xc, yc, d, v_dep, 'k'); end % check if need other type of output ans83=input('To: 0.return; 1.gif file; 2.HPGL file : '); if ans83 == 1 print figure8 -dbmp256; end if ans8_3 == 2 print figure8 -dhpgl; end zoom on; end % % clc; disp('The following options are available :'); disp(' 1. Select plot area'); disp(' 2. plot wave height contours'); disp(' 3. plot wave vectors'); disp(' 4. plot water depth contours'); disp(' 5. plot wave phases'); disp(' 6. plot a profile parallel to X axis'); disp(' 7. plot a profile parallel to Y axis'); disp(' 8. trajectory plot '); disp(' -1. exit'); iop=input('please select : '); if size(iop) == 0 iop=0; end %
4.11
end % end
4.12
Appendix V. Grid Generation and Control Parameter File Generation Program. The output files are used to run the program RDE.FOR This is an example to show how to generate data file. For a more complicated cases, a comprehensive program is needed. program bathymetric_matrix_6 c c c c c c c
This program generates the input water depth matrix, I.D. codes for each cell and boundary conditions that are needed for the wave refraction and diffraction program RDE.FOR the classic rectangular harbor, Chen and Mei's configuration parameter (iq=400,jq=200, kq=500, Lq=2000) character*1 id character*13 name character*17 grdfile, bcdfile, confile,lisfile, chkfile character*30 header character*80 title complex zalp
c common/const/ common/array/ common/bound/ common/given/ c c c c c c c c c c c c c c c c c c c c c c c c c c
mp : np : period : waveh : angle : wlength: dx dy r
mp, np, dx, dy, period, waveh, angle, r, dep_c depth(iq,jq), id(iq,jq) nobc, ibc(Lq), jbc(Lq), zalp(Lq) nog, ig(kq), jg(kq)
mesh number in x direction mesh number in y direction input wave period input wave height input wave angle input wave length
: spatial grid size in x-direction : spatial grid size in y-direction : dx/dy
ID_code for water depth : 0, water interior point : : : :
1, 2, 3, 4,
upper boundary condition point lower boundary condition point left boundary condition point right boundary condition point
: : : :
5, 6, 7, 8,
left bottom corner B.C. point left top corner B.C. point right bottom corner B.C. point right top corner B.C. point
: e, land point
5.1
c c c c
: g, grid point that has a given wave condition harbor length h=0.3212m, width=0.0605m, 5
10
12
14
16
20
c c c
print*,'Select 1. mei121; 2. mei122; 3. mei141; 4. Mei160: ' read(*,*) iption go to (10, 12, 14, 16) iption name='\break\Mei121' title=' Classic rectanglar harbor, Chen and Mei, MP=121' mp=121 m1=20 np=62 n1=21 n2=41 go to 20 name='\break\mei122' title=' Classic rectanglar harbor, Chen and Mei, Mp=122' mp=122 m1=20 np=62 n1=21 n2=41 go to 20 name='\break\mei141' title=' Classic rectanglar harbor, Chen and Mei, Mp=141' mp=141 m1=40 np=62 n1=21 n2=41 go to 20 name='\break\mei161' title=' Classic rectanglar harbor, Chen and Mei, Mp=161' mp=161 m1=60 np=101 n1=41 n2=61 dep_c=0.2573 period=2.2 waveh=0.01 angle=0.0 dx=0.003212 dy=0.003025 call Meil_bc(m1,n1,n2)
check array size
70
if(mp .gt. iq .or. np .gt. jq) then write(*,70) mp,np, iq,jq format(' Given array (mp,np)=',2i5,' is larger than ', * 'allocated (iq,jq)=',2i5)
5.2
stop end if c grdfile=name // '.grd' open(8,file=grdfile,form='formatted', status='unknown') write(8,'(a80)') title write(8,100) mp, np, dx, dy 100 format(' M N dx dy xL yL zmin ', * ' zmax noz yorient'/ 2i5, 2f10.6,' 0.000 0.000', * ' 0.10 0.10 0 0.0') c header=' Water depth metrix (meter) ' write(8,'(a30)') header header=' +-------------------------> j' write(8,'(a30)') header do i=1,mp write(8,120) i,(depth(i,j), j=1,np) 120 format(i5/(10f8.4)) end do close(8) c bcdfile=name // '.bcd' open(8,file=bcdfile,form='formatted', status='unknown') write(8,'(a80)') title write(8,100) mp, np, dx, dy header=' I.D. code for each grid point' write(8,'(a30)') header header=' +-------------------------> j' iblock=np/75 + 1 do ib=1,iblock write(8,'(a30)') header numb1=(ib-1)*75 + 1 numb2=numb1+75-1 if( numb2 .gt. np) numb2 = np do i=1,mp write(8,140) i,(id(i,j), j=numb1,numb2) 140 format(i4,1x,75a1) end do end do c header='Given B.C. at following points' phase=0.0 write(8,'(i5,2x,a30)') nog, header write(8,150) 150 format(' n i j id phase') do i=1,nog write(8,155) i, ig(i),jg(i), id(ig(i),jg(i)), phase end do 155 format(1x,3i5, 4x,a1, f10.6) c header='Radiation B. C. at points... ' write(8,'(i5,2x,a30)') nobc, header
5.3
160
170
write(8,160) format(' n i j id r_alp i_alp') do i=1,nobc write(8,170) i, ibc(i), jbc(i), id(ibc(i),jbc(i)), zalp(i) end do format(1x,3i5,4x,a1,2f8.2) close(8)
c c open an control file for control parameters c confile=name // '.con' lisfile=name // '.lis' chkfile=name // '.chk' icase=46 open(8,file=confile,form='formatted') write(8,'(a80)') title write(8,190) grdfile, bcdfile, lisfile, chkfile 190 format(a18/a18/a18/a18/' 0.0 0.0 0.0') write(8,200) mp, np, dx, dy, icase 200 format(2i5, 2f10.6,i5, ' 0.0') write(8,210) 210 format(' 0.01 2.20 0.0 0.0'/' 0.010 1.90 0.0 0.0'/ * ' 0.010 1.70 0.0 0.0'/' 0.010 1.50 0.0 0.0'/ * ' 0.010 1.40 0.0 0.0'/' 0.010 1.30 0.0 0.0'/ * ' 0.010 1.25 0.0 0.0'/' 0.010 1.20 0.0 0.0'/ * ' 0.010 1.18 0.0 0.0'/' 0.010 1.16 0.0 0.0'/ * ' 0.010 1.15 0.0 0.0'/' 0.010 1.14 0.0 0.0'/ * ' 0.010 1.13 0.0 0.0'/' 0.010 1.12 0.0 0.0'/ * ' 0.010 1.11 0.0 0.0'/' 0.010 1.105 0.0 0.0'/ * ' 0.010 1.10 0.0 0.0'/' 0.010 1.095 0.0 0.0'/ * ' 0.010 1.09 0.0 0.0'/' 0.010 1.085 0.0 0.0'/ * ' 0.010 1.08 0.0 0.0'/' 0.010 1.06 0.0 0.0'/ * ' 0.010 1.04 0.0 0.0'/' 0.010 1.00 0.0 0.0'/ * ' 0.010 0.95 0.0 0.0'/' 0.010 0.90 0.0 0.0'/ * ' 0.010 0.80 0.0 0.0'/' 0.010 0.70 0.0 0.0'/ * ' 0.010 0.65 0.0 0.0'/' 0.010 0.62 0.0 0.0'/ * ' 0.010 0.61 0.0 0.0'/' 0.010 0.60 0.0 0.0'/ * ' 0.010 0.59 0.0 0.0'/' 0.010 0.588 0.0 0.0'/ * ' 0.010 0.58 0.0 0.0'/' 0.010 0.57 0.0 0.0'/ * ' 0.010 0.564 0.0 0.0'/' 0.010 0.562 0.0 0.0'/ * ' 0.010 0.56 0.0 0.0'/' 0.010 0.558 0.0 0.0'/ * ' 0.010 0.555 0.0 0.0'/' 0.010 0.553 0.0 0.0'/ * ' 0.010 0.55 0.0 0.0'/' 0.010 0.54 0.0 0.0'/ * ' 0.010 0.535 0.0 0.0'/' 0.010 0.53 0.0 0.0') close(8) stop end c c-----------------------------------------------------------------subroutine MeiL_BC(m1,n1,n2) c c generates the water and ID depth matrix
5.4
c parameter (iq=400,jq=200, kq=500, Lq=2000) character*1 id complex zalp common/const/ mp, np, dx, dy, period, waveh, angle, r, dep_c common/array/ depth(iq,jq), id(iq,jq) common/bound/ nobc, ibc(Lq), jbc(Lq), zalp(Lq) common/given/ nog, ig(kq), jg(kq) c c first establish the ID c do j=1,np do i=1,mp id(i,j)='0' depth(i,j)=dep_c end do end do c c given boundary at the c nog=0 do j=2,np-1 nog=nog+1 ig(nog)=1 jg(nog)=j id(ig(nog),jg(nog) end do nog=nog+1 ig(nog)=1 jg(nog)=1 id(ig(nog),jg(nog) nog=nog+1 ig(nog)=1 jg(nog)=np id(ig(nog),jg(nog) c c c 10
c c c
code and water depth for the entire grid point
left hand side
)='g'
)='p'
)='q'
Check the Array size if(nog .gt. kq) then write(*,10) nog, kq, nog format(' The # of point for given B.C.=',i6,' > Kq=',i6/ * ' Change the statement to Kq=',i6,' and recompile') stop end if NOBC : number of boundary points
nobc=0 c c top side B.C.
5.5
c do i=2,m1-1 nobc=nobc+1 ibc(nobc)=i jbc(nobc)=np id(ibc(nobc), jbc(nobc) )='1' zalp(nobc)=1.0 end do do i=m1+1,mp-1 nobc=nobc+1 ibc(nobc)=i jbc(nobc)=n2 id(ibc(nobc), jbc(nobc))='1' zalp(nobc)=0.0 end do c c bottom side B.C. c do i=2,m1-1 nobc=nobc+1 ibc(nobc)=i jbc(nobc)=1 id(ibc(nobc), jbc(nobc))='2' zalp(nobc)=1.0 end do do i=m1+1,mp-1 nobc=nobc+1 ibc(nobc)=i jbc(nobc)=n1 id(ibc(nobc), jbc(nobc) )='2' zalp(nobc)=0.0 end do c c right side total reflection B.C. c do j=n1+1,n2-1 nobc=nobc+1 ibc(nobc)=mp jbc(nobc)=j id(ibc(nobc), jbc(nobc) )='4' zalp(nobc)=0.0 end do do j=2,n1-1 nobc=nobc+1 ibc(nobc)=m1 jbc(nobc)=j id(ibc(nobc), jbc(nobc) )='4' zalp(nobc)=0.0 end do do j=n2+1,np-1 nobc=nobc+1 ibc(nobc)=m1
5.6
jbc(nobc)=j id(ibc(nobc), jbc(nobc) )='4' zalp(nobc)=0.0 end do c c c
land points do i=m1+1,mp do j=1,n1-1 id(i,j)='e' end do do j=n2+1,np id(i,j)='e' end do end do
c c right bottom corner b.c. c nobc=nobc+1 ibc(nobc)=m1 jbc(nobc)=1 id(ibc(nobc), jbc(nobc) )='7' zalp(nobc)=(0.0, 1.0) nobc=nobc+1 ibc(nobc)=mp jbc(nobc)=n1 id(ibc(nobc), jbc(nobc) )='7' zalp(nobc)=(0.0, 0.0) c c right top corner b.c. c nobc=nobc+1 ibc(nobc)=m1 jbc(nobc)=np id(ibc(nobc), jbc(nobc) ) ='8' zalp(nobc)=(0.0, 1.0) nobc=nobc+1 ibc(nobc)=mp jbc(nobc)=n2 id(ibc(nobc), jbc(nobc) ) ='8' zalp(nobc)=(0.0, 0.0) c c check the array assignment c if(nobc .gt. Lq) then write(*,20) nobc, Lq, nobc 20 format(' The # of point for Radiation B.C.=',i6,' > Lq=',i6/ * ' Change the statement to Lq=',i6,' and recompile ') stop end if return end
5.7
5.8