International Journal of Obesity (2006) 30, 1742–1749 & 2006 Nature Publishing Group All rights reserved 0307-0565/06 $30.00 www.nature.com/ijo
ORIGINAL ARTICLE Joint association of coffee consumption and other factors to the risk of type 2 diabetes: a prospective study in Finland G Hu1,2, P Jousilahti1,2, M Peltonen1,2, S Bidel1,3 and J Tuomilehto1,2,4 1
Department of Epidemiology and Health Promotion, National Public Health Institute, Helsinki, Finland; Department of Public Health, University of Helsinki, Helsinki, Finland; 3Institute of Biomedicine, Helsinki, Finland and 4South Ostrobothnia Central Hospital, Seina¨joki, Finland 2
Objective: To examine joint associations of coffee consumption and other factors (including physical activity, obesity and alcohol consumption) with the risk of type 2 diabetes. Design: Prospective follow-up study. Subjects: In all, 10 188 Finnish men and 11 197 women aged 35–74 years without a history of stroke, coronary heart disease or diabetes at baseline. Measurement: A self-administered questionnaire data on coffee, tea, alcohol and other food consumption, physical activity, smoking, socio-economic factors and medical history, together with measured height, weight and blood pressure using standardized protocol. Results: During a mean follow-up of 13.4 years, there were 964 incident cases of type 2 diabetes. Multivariate-adjusted (age, study year, systolic blood pressure, education, smoking, physical activity, body mass index (BMI) and fruit, vegetable, sausage, bread, alcohol and tea consumption) hazard ratio of type 2 diabetes in participants who drank 0–2, 3–6 and X7 cups of coffee were 1.00, 0.77 and 0.66 (P ¼ 0.022 for trend) in men, 1.00, 0.71 and 0.52 (P ¼ 0.001 for trend) in women, and 1.00, 0.75 and 0.61 (Po0.001 for trend) in men and women combined (adjusted also for sex), respectively. This inverse association was consistent in subjects with any joint levels of physical activity and BMI, and in alcohol drinkers and non-drinkers. Among obese and inactive people, coffee drinking of seven cups or more daily reduced the risk of type 2 diabetes to half. Conclusions: Coffee drinking was associated with a reduced risk of type 2 diabetes in both men and women, and this association was observed regardless of the levels of physical activity, BMI and alcohol consumption. International Journal of Obesity (2006) 30, 1742–1749. doi:10.1038/sj.ijo.0803341; published online 25 April 2006 Keywords: coffee consumption; physical activity; joint association; type 2 diabetes
Introduction Coffee, one of the most consumed beverages in the world, has been found to have an inverse association with the risk of type 2 diabetes in recent years in some,1–6 but not all7,8 prospective studies. Several other factors, such as sedentary lifestyle, obesity and weight gain and alcohol consumption are also associated with the risk of type 2 diabetes.9–19 However, few of previous studies have examined the joint association of coffee consumption and other factors (includ-
Correspondence: Dr G Hu, Diabetes and Genetic Epidemiology Unit, Department of Epidemiology and Health Promotion, National Public Health Institute, Mannerheimintie 166, FIN-00300 Helsinki, Finland. E-mail:
[email protected] Received 30 August 2005; revised 4 March 2006; accepted 13 March 2006; published online 25 April 2006
ing physical activity, body mass index (BMI) and alcohol consumption) with the risk for type 2 diabetes. In our previous study, we have shown an inverse and graded association between coffee consumption and the risk of type 2 diabetes among the Finnish population; however, the significant association was stronger in women than in men.4 Research into potential health effects of coffee in this population is of particular interest as Finns have the highest per capita coffee consumption (11.4 kg/year) in the world.20 Our previous study included relatively small samples and short follow-up period and did not allow for the examination of the joint association of all these factors. In the present study, we have included one new survey (the 1997 cohort), and also the follow-up time is extended for further 6 years for all cohorts, and double incident diabetes cases are identified. Thus, the aim of the present study is to examine joint associations of coffee consumption
Coffee, other factors and diabetes G Hu et al
1743 and other factors with the risk of type 2 diabetes in a large prospective cohort.
Subjects and methods Subjects We carried out baseline surveys in two eastern Finnish provinces, North Karelia and Kuopio, and in the TurkuLoimaa region in southwestern Finland in 1982, 1987, 1992 and 1997.21 The survey was expanded to the Helsinki capital area in 1992 and northern province of Oulu in 1997. The original random sample was stratified by area, gender and 10-year age group according to the WHO MONICA (MONItoring trends and determinants of CArdiovascular disease) protocol.22,23 All four surveys included the age group of 25–64 years, and in the 1997 survey the age group of 65–74 years was also included. Subjects who participated in more than one survey are included only in the first survey cohort. The total sample size of the four surveys was 29 890. The participation rate varied by year from 74 to 88%.21 Our analysis includes participants of 35–74 years of age (23 342 subjects) because of the very few cases of type 2 diabetes in subjects 25–34 years of age during the follow-up. The final sample comprised 10 188 men and 11 197 women after excluding subjects diagnosed with coronary heart disease or stroke (n ¼ 1122), subjects with known diabetes at baseline (n ¼ 686), subjects with type 1 diabetes at baseline or during follow-up (n ¼ 32), and subjects with incomplete data on any variables required for this analysis (n ¼ 117). The participants gave an informed consent (verbal 1982–1992 and signed 1997). These surveys were conducted according to the ethical rules of the National Public Health Institute and the investigations were carried out in accordance with the Declaration of Helsinki.
Measurements A self-administered questionnaire was sent to the participants to be completed at home. The questionnaire included questions on medical history, socioeconomic factors, smoking habits, physical activity and dietary habits. Education level, measured as the total number of school years, was divided into birth cohort-specific tertiles. Based on the responses, the participants were classified as never, ex- and current-smokers. Current smokers were categorized into those who smoked o20, or X20 cigarettes/day. Physical activity included occupational, commuting and leisure time physical activity. A detailed description of the questions has been presented elsewhere.13,14,24–31 In addition, the physical activity questions have been successfully used elsewhere, showing a high correlation with physical fitness, as measured by maximal oxygen uptake.32 The subjects reported their occupational physical activity according to the following three categories: low, moderate and high. The daily commuting return journey to work was grouped into three
categories: (i) using motorized transportation, or not working outside home (0 min of walking or cycling); (ii) walking or bicycling 1–29 min; (iii) walking or bicycling for more than 30 min. Self-reported leisure time physical activity was classified into three categories: low, moderate and high. As our previous study has shown that moderate and high occupational, commuting or leisure time physical activity independently and significantly reduces risk of type 2 diabetes,13 physical activity were merged and regrouped into three categories: (i) low was defined as subjects who reported low levels of occupational, commuting (o30 min) and leisure time physical activity; (ii) moderate was defined as subjects who reported only one of the all three kinds of moderate to high physical activity; (iii) high was defined as subjects who reported two or three kinds of moderate to high physical activity. The subjects’ diet and food choices were assessed by two types of questions.33 First, the amount of food consumed daily was assessed (e.g., ‘How many slices of bread, and cups of coffee or tea do you have per day (1 cup of coffee equal to 1 deciliter; 1 cup of tea equal to 2 deciliter)?’).4 Coffee consumption was categorized into three categories: 0–2, 3–6 and X7 cups. Tea consumption was categorized into three categories: none, 1–2 and X3 as only a few people were drinking tea. Second, the frequency of consumption of vegetables and fruits over the last week (o1 time/week, 1–2, 3–5, 6–7 times/week), and the frequency of consumption of sausages over the past 12 months (o1 time/month, 1–2 times/month, 1 time/week, 2 times/week, almost daily, 41 time/day) were inquired. Alcohol consumption was categorized into three groups: none, 1–100 and 4100 g per week. At the study site, specially trained nurses measured height, weight and blood pressure using the standardized protocol according to the WHO MONICA project.23 Blood pressure was measured from the right arm of the participant who was seated for 5 min before the measurement using a standard sphygmomanometer. Weight was measured in light clothing and height without shoes. Body mass index was calculated as weight in kilograms divided by the square of the height in meters.
Diagnosis of diabetes We ascertained incident cases of diabetes from the National Hospital Discharge Register and the National Social Insurance Institution’s Drug Register. These register data were linked to the risk factor survey data with the unique personal identification numbers assigned to every resident of Finland. Antidiabetic drugs prescribed by a physician are free of charge in Finland subject to approval of the application to the Social Insurance Institution with a case history prepared by the treating physician attached. The diagnosis of diabetes is confirmed on the basis of the World Health Organization criteria: one or more classic symptoms plus a fasting plasma glucose level X7.8 mmol/l (X7.0 mmol/l from 1998) or the oral glucose tolerance test X11.1 mmol/l; at least 1 raised International Journal of Obesity
Coffee, other factors and diabetes G Hu et al
1744 plasma glucose concentrations on a fasting plasma glucose level X7.8 mmol/l (X7.0 mmol/l from 1998) or the oral glucose tolerance test 11.1 mmol/l in the absence of symptoms; or treatment with a hypoglycemic drug (oral antidiabetic agents or insulin).34,35 All patients (both in- and out-patients) who are entitled for free of-charge medication for diabetes are entered into a register maintained by the Social Insurance Institution. Data on type 1 and type 2 diabetes have been reported separately since 1987. Follow-up of each cohort member continued until the date of the diagnosis of type 2 diabetes, death or until the end of year 2003.
Statistical analyses Independent samples t-test or analysis of variance (ANOVA) was used to compare the means of continuous variables and w2 test was used to compare the prevalence of categorical variables between men and women and between subjects with different levels of coffee consumption. The Cox proportional hazard models were used to estimate single and joint effects of coffee consumption, and physical activity, BMI and alcohol consumption on the risk of type 2 diabetes. The multivariate models included age, study year, systolic blood pressure, education, smoking, frequency of vegetable, fruit and sausage consumption, bread consumption, tea and alcohol drinking, physical activity, BMI and coffee consumption. In stratified analyses, the subjects were classified according to physical activity (low, moderate or high), BMI (o25.0, 25–29.9 and X30 kg/m2) and alcohol consumption (yes and no). As the interactions between sex and each of coffee consumption, physical activity, BMI and alcohol consumption on risk of diabetes were not statistically significant, men and women were combined in some analyses. Statistical significance was considered to be Po0.05. All statistical analyses were performed with SPSS for Windows 12.0 (SPSS Inc., Chicago, IL, USA).
Table 1 Baseline characteristics of study sample by sex Variable
Men
Women
P-value
10 188 49.9 27.0 87 142 9.7 6.2
11 197 49.8 26.7 83 139 10.0 4.8
0.80 o0.001 o0.001 o0.001 o0.001 o0.001
Coffee consumption (%) 0–2 cups/day 3–6 cups/day X7 cups/day
19.5 56.0 24.5
20.2 65.3 14.5
Physical activity (%) Low Moderate High
10.7 43.4 45.9
13.3 40.6 46.1
BMI (%) o25 kg/m2 25–29.9 kg/m2 X30 kg/m2
30.8 50.1 19.1
42.1 36.7 21.2
Smoking (%) Never Past Current
36.0 29.3 34.7
72.6 10.5 16.9
Tea consumption (%) None 1–2 cups/day 3 cups/day
64.5 25.3 10.2
61.5 30.9 7.6
Alcohol consumption (%) None 1–100 g/week 4100 g/week
37.6 37.7 24.6
59.9 35.4 4.7
Daily consumption of vegetables (%) Daily consumption of fruits (%) Almost daily consumption of sausage (%)
17.4 20.8 17.1
29.6 40.2 22.6
Number of participants Age (years) BMI (kg/m2) Diastolic blood pressure (mm Hg) Systolic blood pressure (mm Hg) Education level (years) Bread consumption (slices/day)
o0.001
o0.001
o0.001
o0.001
o0.001
o0.001
o0.001 o0.001 o0.001
Abbreviation: BMI, body mass index. Values are given as means or percentages.
Results A total of 964 cases of type 2 diabetes were identified during a mean follow-up period of 13.4 years. General characteristics of the study population at baseline are given in Table 1. In general, older persons were less likely to drink coffee (Table 2). Coffee consumption had a direct association with bread consumption and current smoking in both sexes. Coffee drinking had an inverse association with blood pressure, education, low physical activity, tea drinking, alcohol consumption, daily consumption of vegetable and fruits in both sexes. Multivariate-adjusted (age, study year, systolic blood pressure, education, smoking, physical activity, BMI, and fruit, vegetable, sausage, bread, alcohol and tea consumption) hazard ratios of type 2 diabetes in participants who drank 0–2, 3–6 and X7 cups of coffee were 1.00, 0.77 and International Journal of Obesity
0.66 (P ¼ 0.022 for trend) in men, and 1.00, 0.71, and 0.52 (P ¼ 0.001 for trend) in women, respectively (Table 3). When both sexes were combined, sex- and multivariate-adjusted hazard ratios were 1.00, 0.75 and 0.61 (Po0.001 for trend), respectively. When coffee consumption was examined as a continuous variable, multivariate-adjusted hazard ratios of type 2 diabetes associated with an increment of one cup of coffee per day were 0.97 (95% confidence interval (CI): 0.94– 1.00; P ¼ 0.047) in men, 0.91 (95% CI: 0.87–0.95; Po0.001) in women, and 0.95 (95% CI: 0.92–0.97; Po0.001) in both sexes combined. Multivariate-adjusted hazard ratios of type 2 diabetes decreased significantly with increasing physical activity. The hazard ratios of type 2 diabetes associated with low, moderate and high physical activity were 1.00, 0.62 and 0.50 (Po0.001 for trend) in men, and 1.00, 0.80 and 0.65 (P ¼ 0.009 for trend) in women, respectively. Multivariate-
Coffee, other factors and diabetes G Hu et al
1745 Table 2
Baseline characteristics according to different levels of coffee consumption by sex Coffee consumption in men
Coffee consumption in women
P-value
0–2 cups/day
3–6 cups/day
X7 cups/day
P-value
0–2 cups/day
3–6 cups/day
X7 cups/day
1986 51.5 26.9 88 143 10.3 5.7
5704 50.3 27.1 87 143 9.7 6.0
2498 47.6 27.1 86 141 9.2 7.0
o0.001 0.08 o0.001 o0.001 o0.001 o0.001
2257 50.7 26.5 83 139 10.7 4.5
7314 50.2 26.7 83 139 9.9 4.8
1626 47.1 26.8 81 135 9.6 5.3
Physical activity (%) Low Moderate High
11.5 46.8 41.7
10.6 43.4 46.0
10.5 40.7 48.8
15.6 43.1 41.3
12.5 40.5 47.0
13.9 37.1 49.0
BMI (%) o25 kg/m2 25–29.9 kg/m2 X30 kg/m2
32.6 49.5 17.9
30.1 50.6 19.3
31.1 49.4 19.5
44.1 35.4 20.5
41.6 37.1 21.3
41.2 37.0 21.8
Smoking (%) Never Past Current
49.8 29.7 20.5
36.6 31.6 31.8
23.6 23.7 52.7
78.5 11.8 9.7
74.1 9.9 16.0
57.6 11.3 31.1
Tea consumption (%) None 1–2 cups/day 3 cups/day
32.0 39.5 28.5
66.0 26.8 7.2
86.9 10.5 2.6
33.9 44.3 21.8
65.0 30.5 4.5
84.4 14.1 1.5
Alcohol consumption (%) None 1–100 g/week 4100 g/week
35.9 37.8 26.3
36.3 39.0 24.7
42.1 34.7 23.2
57.3 37.3 5.4
59.9 35.6 4.5
63.4 32.1 4.5
Daily consumption of vegetables (%) Daily consumption of fruits (%) Almost daily consumption of sausage (%)
22.1 25.7 16.7
17.9 21.2 16.3
12.4 16.1 18.9
34.7 42.5 21.2
29.5 40.9 23.3
22.9 33.8 22.0
Number of participants Age (years) BMI (kg/m2) Diastolic blood pressure (mm Hg) Systolic blood pressure (mm Hg) Education level (years) Bread consumption (slices/day)
o0.001
o0.001
0.22
0.27
o0.001
o0.001
o0.001
o0.001
o0.001
o0.001 o0.001 0.017
o0.001 0.22 o0.001 o0.001 o0.001 o0.001
0.002
o0.001 o0.001 0.10
Abbreviation: BMI, body mass index. Values are given as means or percentages.
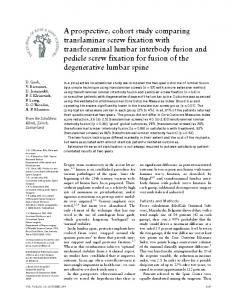
adjusted hazard ratios of type 2 diabetes at different levels of BMI (o25, 25–29.9 and 30 kg/m2) were 1.00, 2.90 and 8.46 (Po0.001 for trend) in men, and 1.00, 2.78 and 9.59 (Po0.001 for trend) in women, respectively. Multivariateadjusted hazard ratios of type 2 diabetes in participants who drank 0, 1–100 and 4100 g of alcohol per week were 1.00, 0.91 and 0.74 (P ¼ 0.064 for trend) in men, and 1.00, 0.74 and 0.23 (P ¼ 0.004 for trend) in women, respectively. When both sexes were combined, the positive association of BMI and the protective effects of physical activity and alcohol consumption were still significant (all Po0.01 for trend) after further adjustment for sex. No significant association between tea consumption and the risk of type 2 diabetes was found. In multivariate analyses after adjustment for other confounding factors, we estimated joint effects of coffee consumption and any one of physical activity (Figure 1a), BMI (Figure 1b) and alcohol consumption (Figure 1c) on the risk of type 2 diabetes. The inverse association between
coffee consumption and the risk of diabetes was found in the subjects at different levels of physical activity (low, moderate and high), in subjects at different levels of BMI (normal weight o25, overweight 25–29.9 and obese X30 kg/m2), and in alcohol drinkers and non-drinkers. The joint association of coffee consumption, physical activity and BMI with the risk of type 2 diabetes is shown in Figure 2. After adjustment for age, study year, sex, systolic blood pressure, education, smoking and fruit, vegetable, sausage, bread, alcohol and tea consumption. Coffee drinking reduced the risk of type 2 diabetes at any levels of physical activity and BMI; the direct association of BMI and the protective effect of physical activity on the risk of type 2 diabetes were also found at different levels of coffee consumption. In comparison with non-obese persons who reported moderate or high level of physical activity and drank at least seven cups of coffee daily, obese subjects who reported low level of physical activity and drank less than two cups of coffee showed about 11 times higher risk for the International Journal of Obesity
Coffee, other factors and diabetes G Hu et al
1746 Table 3
Hazard ratios for the development of type 2 diabetes by different levels of coffee consumption, physical activity, BMI, tea and alcohol consumption Number of new cases Men
Person-year
Adjusted hazard ratio (95% CI)a
Men and women combinedb
Women
Men
Women
Men
Women
Coffee consumption (cups/day) 0–2 103 3–6 289 X7 125 P-value for trend
102 293 52
24 089 74 314 34 233
28 514 101 708 24 340
1.00 0.77 (0.61–0.98) 0.66 (0.49–0.89) 0.022
1.00 0.71 (0.56–0.91) 0.52 (0.36–0.74) 0.001
1.00 0.75 (0.63–0.89) 0.61 (0.49–0.76) o0.001
Physical activity Low Moderate High P-value for trend
100 230 187
121 193 133
12 644 54 840 65 152
19 906 60 655 74 001
1.00 0.62 (0.48–0.78) 0.50 (0.39–0.65) o0.001
1.00 0.80 (0.64–1.01) 0.65 (0.50–0.86) 0.009
1.00 0.71 (0.60–0.84) 0.58 (0.48–0.70) o0.001
BMI categories (kg/m2) o25 25–29.9 X30 P-value for trend
44 222 251
42 126 279
42 084 67 260 22 292
66 672 57 386 30 504
1.00 2.90 (2.10–4.02) 8.46 (6.10–11.7) o0.001
1.00 2.78 (1.95–3.96) 9.59 (6.83–13.4) o0.001
1.00 2.91 (2.29–3.69) 9.17 (7.25–11.6) o0.001
Tea consumption (cups/day) None 360 1–2 113 X3 44 P-value for trend
296 122 29
86 578 32 418 13 640
96 794 46 375 11 393
1.00 0.89 (0.71–1.11) 0.83 (0.59–1.17) 0.41
1.00 0.92 (0.74–1.15) 0.85 (0.57–1.27) 0.61
1.00 0.90 (0.77–1.06) 0.83 (0.64–1.08) 0.23
Alcohol consumption (g/week) None 223 1–100 190 4100 104 P-value for trend
357 87 3
51 068 50 638 30 930
97 535 51 204 5823
1.00 0.91 (0.75–1.11) 0.74 (0.58–0.95) 0.064
1.00 0.74 (0.57–0.94) 0.23 (0.07–0.73) 0.004
1.00 0.84 (0.72–0.97) 0.69 (0.55–0.87) 0.002
Abbreviations: BMI, body mass index; CI, confidence interval. aCox proportional hazards model included age, study year, education, systolic blood pressure, bread consumption, frequency of vegetable consumption, frequency of fruit consumption, frequency of sausage consumption, coffee consumption, tea consumption, alcohol consumption, smoking, physical activity, and BMI (as a continuous variable, except BMI as a categorizing variable). bAdjusted also for sex.
development of type 2 diabetes. Further, among the obese and inactive people, coffee drinking (X7 versus 0–2 cups per day) reduced the risk of type 2 diabetes to approximately half. There were no statistically significant interactions between coffee consumption and physical activity (w2 ¼ 2.56, 2 df, P40.1), between coffee consumption and BMI (w2 ¼ 0.097, 1 df, P40.1), between coffee consumption and alcohol consumption (w2 ¼ 1.313, 2 df, P40.1), or between coffee consumption, physical activity and BMI (w2 ¼ 5.096, 2 df, P40.05) on the risk of type 2 diabetes.
Discussion Our previous analysis have shown an inverse and graded association between coffee consumption and risk of type 2 diabetes among the Finnish population.4 In the present analysis, we expanded the previous finding and addressed the joint association of coffee consumption and other factors, including physical activity, BMI and alcohol consumption, with regard to the risk of type 2 diabetes. The inverse and graded association between coffee consumption International Journal of Obesity
and the risk of type 2 diabetes was consistent in both men and women, in the subjects with any joint levels of physical activity and BMI, and in alcohol drinkers and non-drinkers. Particularly interesting was the finding that among obese and inactive people, coffee consumption halved the risk of type 2 diabetes. The inverse and graded association between coffee consumption and the risk of type 2 diabetes have been found in Dutch,1 Swedish,2 American,3 Finnish twins5 and our previous4 cohort studies. Several major differences between the present study and our previous analysis4 are that in the present study, we have included one new survey (the 1997 cohort) of 5996 samples. Also, the follow-up time is longer in the present analysis for all cohorts, and double incident diabetes cases are identified. Third, the significantly inverse association between coffee consumption and the risk of type 2 diabetes was confirmed in Finnish men and women separately. However, in our previous cohort the significant association was stronger in women than in men.4 Fourth, the present study showed that coffee consumption reduces the risk of diabetes at any level of physical activity and BMI. Alcohol consumption has been found to be associated with the risk of type 2 diabetes in some epidemiological studies.18
Coffee, other factors and diabetes G Hu et al
1747 11.2*
a
2.46*
3
12 1.95*
7.48* 1.64*
Relative risk
Relative risk
1.56*
2 1.37* 1.16
0.96
1
5.65*
8 4.47*
4.90*
1.90*
4 3.32*
1.03
1.39*
2.00*
1.00
Coffee 0-2 cups
0.94
0
0.88 1.00
Coffee 3-6 cups
0 Low
Coffee >=7 cups
Moderate High
Physical activity
b 12 8.80*
Relative risk
Coffee 3-6 cups Coffee >=7 cups
Figure 2 Relative risk of type 2 diabetes according to joint effects of coffee consumption, physical activity and body mass index (BMI). Cox proportional hazards model adjusted for age, study year, sex, education, systolic blood pressure, bread consumption, frequency of vegetable consumption, frequency of fruit consumption, frequency of sausage consumption, tea and alcohol consumption and smoking. Inactivity was defined as low physical activity; activity was defined as moderate or high physical activity. *Po0.05 compared with referent group.
11.8*
8 6.28*
3.70*
2.68*
4
1.20
2.30*
Coffee 0-2 cups
0.88
0
Coffee 3-6 cups
1.00
BMI >= 30 BMI 25-29.9
c
Coffee >=7 cups BMI < 25 1.78*
1.50*
2 1.42*
1.5 Relative risk
Inactivity & BMI >=30 Activity & BMI >=30 Inactivity & BMI Activity & BMI