The Academic Cost of Being Overweight: Rural vs. Urban Area. Differences - A Quantile Regression Approach. Christian Nsiah. Black Hills State University.
Research in Higher Education Journal
The Academic Cost of Being Overweight: Rural vs. Urban Area Differences - A Quantile Regression Approach Christian Nsiah Black Hills State University Prathibha V. Joshi Gordon College Abstract The number of overweight youth has more than doubled since the early 1970s. According to the Center for Disease Control, approximately 13 percent of children and adolescents are seriously overweight. Obesity among adolescents has been linked with behavioral and psychological problems, affecting adolescent socialization, self-esteem, and performance in all facets of life. Using data from the 1997 National Longitudinal Survey of Youth, we employ ordinary least squares, instrumental variables, and quantile regression models to investigate how being overweight can impact a youth’s education performance measured as actual creditweighted grade point average. Overall, we find a negative relationship between being overweight and GPA. We also find that the negative relationship is more pronounced in urban areas than in rural areas. The quantile regression estimate indicates that the magnitude of the relationship between youth’s GPA and being overweight depends on the GPA quantile in question. Keywords: Overweight, GPA, Quantile Regression, rural, urban, NLSY97.
The Academic Cost, Page 1
Research in Higher Education Journal Introduction Obesity among Americans constitutes one of the most important growing public health concerns today. While the Center for Disease Control reported that in 1991 there were no states with obesity rates of 19% or more, in 2004 it reported that 33 states had obesity rates greater than 20%. Moreover obesity has become a phenomenon affecting not only adults but also children and teenagers. The rate of childhood obesity in the United States is growing rapidly for children of all ages. These trends have made it necessary to understand the determinants of obesity as well as its medical, economic, and social consequences on American society. For example in determining the causes of the rapid growth of U.S. obesity rates, Rashad, Grossman and Chou (2006) use data on individuals from 1971-1994 to find that both growth in the number of restaurants per capita and higher cigarette taxes are associated with increases in body weight. Johnson, McInnes and Shinogle (2006) investigate obesity’s effects by estimating the medical cost of childhood obesity, finding higher medical expenditures among overweight children. Unlike studies that seek to discover the determinants of obesity, this study focuses on estimating the economic cost of being overweight. It differs from other similar work in that it investigates a specific dimension of this economic cost: the association between obesity and childhood educational performance. In particular we seek to determine if being overweight affects a child’s academic success. The unique aspect of this inquiry stems from its consideration of rural and urban differences as well as the application of a quantile regression analysis. Quantile regression goes beyond OLS methodology to allow the exploration of the entire range of conditional distribution. For this study, the quantile regression approach allows us to investigate if the relationship between being overweight and a student’s GPA differs by a conditional quantile GPA distribution. Literature Review The literature on the economics of obesity consistently has shown linkages between obesity and negative educational attainment among the adult population. This literature argues that people with higher educational attainment tend to be less obese, meaning those who are obese tend to be less educated (Cutler et al. 2003). While the literature provides a disturbing picture of the effects of obesity on adults, more and more often researchers are realizing that obesity has an even worse impact on youth. As shown by Case et al. (2002), the relationship between an adult’s health and economic outcomes such as education may be determined during childhood. Johnson, McInnes and Shinogle (2006) point out that obese children tend to become obese adults. It is thus possible that the negative relationship between an adult’s low educational attainment and obesity occurs much earlier than previously thought. A link between obesity and low educational attainment might actually start during childhood. Previous studies including Davidson and Birch (2001), Erickson et al. (2000), Freedman et al. (1999) and Power et al. (1997) indicate that childhood obesity may cause several health risks1 and psychosocial outcomes such as low self-esteem and depression. However, Swallen et al. (2005) use the 1996 National Longitudinal Study of Adolescents Health to find a significant relationship between adolescents’ BMI and physical health but not psychosocial outcomes. In their investigation of the relationship between cigarette smoking and body weight, Cawley,
The Academic Cost, Page 2
Research in Higher Education Journal Markowitz and Tauras (2006) find that smoking cigarettes is less common among lighter adolescent girls, whether weight is measured by body mass index or weight in pounds. The health risk coupled with the psychosocial effects of obesity can have a detrimental effect on all aspects of the life of youths, including academic performance as postulated by Datar et al. (2004). Obesity can lead to a loss of confidence in life, but especially in academics. Those who are obese may find themselves on the fringes of society, and may face less acceptance in middle and high school. They particularly can receive negative reinforcement from other students, which may prevent them from effectively participating in normal educational pursuits or even force them to abandon such pursuits entirely. Despite this possibility, however, only a few studies have investigated the linkages between obesity and educational outcomes of children. Using data from the National Longitudinal Study of Adolescent Health, Sabia (2007) finds a consistent pattern across different models that shows a significant negative relationship between body mass index and grade point average (GPA) for white females aged 14-17. For nonwhite females and males, there is less convincing evidence of a causal link between body weight and academic performance. Yet using data on American kindergarten children, Datar et al (2004) indicates overweight children have significantly lower math and reading scores relative to children who are not overweight. Faulkner et al (2001) shows that overweight adolescents consider themselves to be worse students, whether that perception is true or not. A few studies have been done in other countries, including the Mo-suwan et al. study (1999) that uses data from Thailand to discover that being overweight significantly reduces academic performance from grades 7 to 9. They did not find similar results for children in grades 3 to 6, though. The study done by Li (1995) employs data on Chinese primary school children to find that obese children have a notably lower intelligence quotient (IQ)2 than non-obese children. This brief literature survey indicates that little has been done to explore the relationship between obesity and the academic performance of American teenagers on a comprehensive scale. This study seeks to address that relationship by using the 1997 National Longitudinal Survey of Youth (NLSY97) data to examine exactly how being overweight and/or obese affects educational outcomes of American high school students. This study also investigates if the relationship between being overweight and a student’s GPA differs by conditional quantile GPA distributions. Furthermore, the study seeks to examine whether the impact of obesity on educational outcomes is different in urban areas than in rural areas. We argue that being overweight does indeed have a negative influence on the academic performance of high school students, especially in urban regions of the country. The study is divided into the following sections: section 2 is about the empirical models, section 3 introduces the data, section 4 presents the estimation results, and the last section summarizes the study and provides some conclusions. Empirical Models IV Model The relationship between obesity and educational attainment may be endogenous in that there may be unobserved individual, location, and/or family characteristics that are correlated with both being overweight and educational attainment. If this is the case, then ordinary least squares estimates of the relationship between being overweight and educational attainment may have an endogeneity and/or heterogeneity bias. The Academic Cost, Page 3
Research in Higher Education Journal In addressing this issue of possible bias, a common method found in the literature (Sabia, 2007) is the use of instrumental variables.3 Since this is a common practice, this study employs a system of two-stage least squares (2SLS) IV modeling approach where it jointly estimates equation 1, which calculates the educational attainment, and equation 2, which is the body weight equation. (1) where Eit denotes educational outcome of person i at time t, X denotes a vector of individual, family, peers, and location characteristics, B is a scalar vector of parameters, W is a measure of weight class. (2) The reporting parents’ BMI from the NLSY97 study is calculated from their self reported weight and height, and from this the study creates a variable that classifies them into overweight or normal weight. This variable is employed as the exclusion restriction for identification of the standard IV model. Data This study employs 4 year (1997-2000) panel data from the 1997 National Longitudinal Survey of Youth to analyze the relationship between being overweight and a youth’s educational performance measured as actual credit-weighted grade point average. The NLSY97 consists of a nationally representative sample of approximately 9,000 youths aged twelve to sixteen on December 31, 1996 (Horrigan and Walker 2001, Michael and Pergamit 2001, Pergamit et al 2001). The respondents of NLSY97 have been interviewed on an annual basis since 1997. The survey follows the lives of the respondents and looks at the important decisions they make. Although it primary focuses on labor market behavior, the NLSY97 provides information on a rich array of socioeconomic and demographic information that is relevant to the individuals’ choice behavior. Further, the survey collects information on parents, siblings, children, and spouses of the respondents (Zietz and Joshi 2005). Dependent Variable The dependent variable used to proxy academic achievement is the Carnegie creditweighted overall high school grade point average (GPA). The data on high school GPA comes from the transcript data of the NLSY97. The transcript survey data comes directly from high school transcripts secured from youths' high schools after respondents are no longer enrolled as students. This survey data presents information on various aspects of the students’ tenure in high school, including grades for each course the respondents took per term of high school. This dependent variable indicates grade point averages across all courses on a 5-point grading scale. For each course, the quality grade is weighted by Carnegie credits. Previous studies in this area have used self reported grades as the dependent variable, which may be upwardly biased (Sabia, 2007). Our study does not have this limitation with our dependent variable because it does employ the more unbiased credit-weighted overall high school GPA. Independent Variables of Interest Similar to Cawley (2004) and Sabia (2007), we use two indicators of youth overweight status to measure the impact of being overweight or obese on academic performance. The first measure of overweight used in this study is a 0/1 clinically overweight status indicator variable The Academic Cost, Page 4
Research in Higher Education Journal (COVW). The variable is obtained by first calculating the youths’ Body Mass Index (BMI) from their reported height and weight from the NLSY97 for each year. Then using the Center for Disease Control and Prevention (CDC) age and gender specific measures of obesity for children aged 2-204, we classify our sample into underweight, normal weight, overweight, and obese. For our study we collapse these classifications into three by combining students denoted as clinical overweight and obese together. The reference group is the youths with normal weight. Based on the CDC criteria described above, 2.55% of the sample can be classified as clinically underweight, 71.37% have normal weight, and 26.07% of the sample can be classified as either overweight or obese. The second measure of overweight/obese status employed by this study comes from the youths’ own perception about their weight status. In the NLSY97 study, students were asked to describe their weight. The possible choices presented to the respondents are 1 - very underweight, 2 - slightly underweight, 3 - about the right weight, 4 - slightly overweight, and 5 very overweight. For the purpose of this study we combine classification 1 and 2 to form the underweight classification (SUNW), and we combine classification 4 and above into the overweight/obese group (SOVW). Thus we end up with 3 weight groups similar to that of the estimated weight classification presented above. The weight groups include underweight, normal weight, and overweight/obese. For our sample, 14.20% perceive themselves as underweight, 57.04% consider themselves as having a normal weight, and 28.77% perceive themselves as overweight or obese. The correlation between the measure for clinically overweight or obese and the measure for self perceived overweight or obese is 0.48, whereas the correlation between the underweight measures is 0.15. Other Independent Variables An interesting variable included in this study is the students’ self reported health status (HEALTH). This variable is used to check if being overweight has other effects on educational outcomes (e.g. psychological) outside any health issues that may be caused by complications from weight problems. In essence, we expect students with good health to perform better. By comparing the results of a regression that controls for both health status and weight class to the estimation results from a regression that only controls for weight class, we can discern if being overweight does have other impacts on educational outcomes besides health issues. In addition, a student’s family background may influence their performance at school. We include parental annual income (PINC) and the highest grade completed by the parents (PDEG). High levels of parents’ education and income are likely to be positively correlated to student achievement, possibly inducing students to aspire for better grades. Further, the study also controls for parental support of students. Regardless of the parents’ education and income, if they are not active participants in a youth’s life or education then the youth may not do very well in school. There are a number of other variables that are used as controls and their inclusion is justified by many previous research studies. The study includes 0/1 indicator variables that identify nonwhites and females. Other control variables used includes a substance use index, annual hours of work by the student, percent of their peers who plan to attend college, percent of peers who play sports, 0/1 indicator variables for regions of residence, and a 0/1 indicator variable for residence in metropolitan statistical area (MSA). The data description and summary statistics are presented in Table 1.
The Academic Cost, Page 5
Research in Higher Education Journal Table 1. Data Description and Summary Statistics Variable Description GPA Annual Overall Credit Weighted GPA (Actual Transcript Data) 0/1 indicator variable, 1 denotes overweight according to CDC Adolescent COVW BMI percentiles category 0/1 indicator variable, 1 denotes underweight according to CDC CUNW Adolescent BMI percentiles category SOVW 0/1 indicator variable, 1 denotes overrweight according to respondent SUNW 0/1 indicator variable, 1 denotes underweight according to respondent FEM 0/1 indicator variable, 1 denotes female NWHITE 0/1 indicator variable, 1 denotes nonwhite HRSWK Annual hours worked/10,000 SUBSU Subs use index Inverse of parent supportive index [father + mother supportive index; PSUP (1='Very supportive' ,2='Somewhat supportive' 3='Not very supportive')] PINC Parent's own annual income/10,000 PDEG Average Highest grade completed by parents % Peers that play sports, or in clubs at school (190%) PCOLL % Peers that plan to go to college (190%) HEALTH Respondent's health (1 Excellent, 2 Very good, 3 Good, 4 Fair, 5 Poor) MSA 0/1 indicator variable, 1 denotes respondent live in an MSA NEAST 0/1 indicator variable, 1 denotes respondent live in the North East NCENT 0/1 indicator variable, 1 denotes respondent live in the North Central SOUTH 0/1 indicator variable, 1 denotes respondent live in the South WEST 0/1 indicator variable, 1 denotes respondent live in the West POVW 0/1 indicator variable, 1 if responding parent is overweight RURAL 0/1 indicator variable, 1 denotes respondent live in a rural area URBAN 0/1 indicator variable, 1 denotes respondent live in a urban area
Mean STD Min Max 2.862 0.681 0.000 4.210 0.329 0.470 0.000 1.000 0.023 0.497 0.016 0.488 0.418 0.439 1.080
0.150 0.500 0.124 0.500 0.493 0.652 1.113
0.000 0.000 0.000 0.000 0.000 0.000 0.000
1.000 1.000 1.000 1.000 1.000 6.468 3.000
0.408 0.111 0.167 0.500 3.047 3.121 0.000 23.782 5.080 2.741 0.000 14.000
3.689 1.048 1.000 3.569 1.077 1.000 1.953 0.921 1.000 0.369 0.483 0.000 0.174 0.379 0.000 0.225 0.418 0.000 0.379 0.485 0.000 0.223 0.416 0.000 0.238 0.426 0.000 0.221 0.415 0.000 0.779 0.415 0.000 Notes: The data used for this study is a panel data from the NLSY97 covering the years between 1997-2000
5.000 5.000 5.000 1.000 1.000 1.000 1.000 1.000 1.000 1.000 1.000
An important instrument used in our model is the overweight status of the parent(s) who also responded in the NLSY97 study, which is derived from the BMI calculated from their self reported height and weight. In our sample, 23.81% of the responding parents are classified as overweight or obese. Although this overweight measure is directly derived from the responding parent’s BMI, the height and weight data used to calculate the BMI are self reported. This can be a problem if unobserved factors correlated with the parents assessment of their height and weight are also correlated with the youth’s academic outcomes; thus we have to keep this plausible flaw in mind when interpreting the estimates.
The Academic Cost, Page 6
Research in Higher Education Journal Estimation Results The estimation results of our model are presented in Tables 2 and 3, which differ by the indicator of overweight status used. Within each table there are three distinct groups of regressions representing the overall sample, rural residents, and urban area residents. Under each group there are two regression results, one that does not control for the youth’s overall health and the other that includes the youth’s overall health in the regression. Columns 1 and 2 of Table 2 present the results of the overall sample, with column 2 controlling for the student’s general health. The results from column 1 indicate that compared to students classified as having healthy weight, overweight/obese students attain a 0.326 lower mean GPA. When correcting for the students’ general health, the results from column 2 indicate that overweight and obese students attain a 0.301 lower mean GPA than their healthy weight colleagues, a reduction of 0.025 from the previous case. This finding indicates that aside from health related effects, being overweight and/or obese may have other negative impacts on educational outcomes. Columns 3 through 6 of Table 2 present the results for rural and urban residents. The results indicate that overweight residents of urban areas attain a 0.481 lower mean GPA than their healthy weight counterparts when not controlling for students’ health and a 0.456 lower mean GPA when controlling for it. This significant negative impact of being overweight is not seen in the sample for rural residents. The finding suggests that the dynamics of how being overweight can impact educational outcomes is different for urban and rural residents. Table 2. Estimation Results with Actual Estimated Overweight Status. Variable Constant COVW CUNW FEM NWHITE HRSWK PSUP PINC PDEG SPORTS PCOLL MSA NEAST NCENT SOUTH SUBSU HEALTH
Observations R-squared Wald-test
2.512 (0.097) -0.326 (0.145) -0.062 (0.071) 0.140 (0.026) -0.184 (0.032) 0.021 (0.026) 0.519 (0.107) 0.014 (0.004) 0.018 (0.005) 0.033 (0.013) 0.011 (0.013) 0.038 (0.028) -0.104 (0.039) 0.057 (0.033) 0.129 (0.032) -0.084 (0.011)
Overall *** 2.590 (0.091) ** -0.301 (0.151) -0.063 (0.071) *** 0.147 (0.027) *** -0.183 (0.031) 0.021 (0.025) *** 0.482 (0107) *** 0.014 (0.003) *** 0.018 (0.005) ** 0.032 (0.013) 0.010 (0.013) 0.035 (0.028) *** -0.105 (0.039) * 0.055 (0.033) *** 0.126 (0.032) *** -0.081 (0.011) -0.036 (0.017)
2344 0.127 362.80 ***
*** **
*** ***
*** *** *** **
*** * *** *** **
2370 0.134 382.79 ***
2.592 (0.118) -0.481 (0.199) -0.091 (0.087) 0.096 (0.034) -0.164 (0.039) 0.023 (0.033) 0.530 (0.131) 0.015 (0.004) 0.017 (0.006) 0.022 (0.015) 0.013 (0.016) 0.041 (0.039) -0.100 (0.046) 0.065 (0.039) 0.121 (0.037) -0.084 (0.013)
Urban *** 2.644 (0.109) ** -0.456 (0.213) -0.090 (0.087) *** 0.101 (0.036) *** -0.164 (0.038) 0.023 (0.033) *** 0.505 (0.232) *** 0.015 (0.004) *** 0.017 (0.005) 0.022 (0.015) 0.012 (0.015) 0.039 (0.031) ** -0.100 (0.045) * 0.063 (0.039) *** 0.119 (0.037) *** -0.083 (0.013) -0.025 (0.022)
1662 0.120 258.48 ***
*** **
*** ***
*** *** ***
**
*** ***
1622 0.125 271.57 ***
2.303 (0.179) -0.095 (0.213) -0.022 (0.128) 0.224 (0.042) -0.203 (0.070) 0.004 (0.044) 0.538 (0.193) 0.010 (0.007) 0.020 (0.009) 0.059 (0.023) 0.007 (0.022) 0.282 (0.624) -0.092 (0.084) 0.083 (0.074) 0.160 (0.077) -0.079 (0.020)
Rural *** 2.428 (0.172) -0.080 (0.216) -0.029 (0.127) *** 0.236 (0.043) *** -0.201 (0.070) 0.002 (0.044) *** 0.476 (0.190) 0.009 (0.007) ** 0.021 (0.009) ** 0.055 (0.023) 0.007 (0.022) 0.230 (0.627) -0.095 (0.083) 0.080 (0.074) ** 0.160 (0.077) *** -0.075 (0.021) -0.054 (0.029)
708 0.148 112.60 ***
***
*** ***
**
** **
** *** *
708 0.158 119.72 ***
Note: Student overweight status is instrumented with respondent parent’s weight-class
The Academic Cost, Page 7
Research in Higher Education Journal Table 3. Estimation Results with Student Perceived Overweight Status Variable Constant SOVW SUNW FEM NWHITE HRSWK PSUP PINC PDEG SPORTS PCOLL MSA NEAST NCENT SOUTH SUBSU HEALTH
2.811 (0.250) -0.747 (0.411) -0.487 (0.247) 0.206 (0.037) -0.207 (0.036) 0.105 (0.053) 0.244 (0.199) 0.017 (0.004) 0.016 (0.006) 0.056 (0.021) 0.011 (0.016) 0.040 (0.034) -0.134 (0.048) 0.006 (0.048) 0.115 (0.039) -0.077 (0.013)
Overall *** 2.810 (0.205) * -0.746 (0.425) ** -0.486 (0.272) *** 0.206 (0.036) *** -0.207 (0.036) ** 0.103 (0.057) 0.247 (0.186) *** 0.017 (0.004) *** 0.016 (0.006) *** 0.056 (0.022) 0.011 (0.015) 0.040 (0.035) *** -0.134 (0.048) 0.007 (0.049) *** 0.115 (0.039) *** -0.077 (0.013) 0.000 (0.038)
Observations 2344 R-squared 0.091 Wald-test 239.71 ***
*** * * *** *** *
*** ** ***
***
*** ***
2370 0.098 251.92 ***
2.870 (0.250) -0.807 (0.411) -0.467 (0.247) 0.180 (0.040) -0.195 (0.042) 0.118 (0.056) 0.281 (0.198) 0.019 (0.005) 0.016 (0.007) 0.043 (0.022) 0.017 (0.019) 0.042 (0.038) -0.151 (0.059) -0.005 (0.058) 0.086 (0.047) -0.080 (0.015)
Urban *** 2.865 (0.211) * -0.810 (0.464) * -0.468 (0.271) *** 0.180 (0.040) *** -0.196 (0.041) ** 0.117 (0.060) 0.286 (0.188) *** 0.019 (0.005) ** 0.016 (0.007) ** 0.043 (0.022) 0.017 (0.019) 0.043 (0.038) ** -0.151 (0.060) -0.005 (0.059) ** 0.086 (0.047) *** -0.080 (0.015) 0.003 (0.038)
1662 0.110 170.89 ***
Rural *** * * *** *** *
*** ** *
**
* ***
1622 0.118 178.13 ***
2.529 (0.761) -0.494 (1.337) -0.526 (0.776) 0.262 (0.112) -0.217 (0.081) 0.044 (0.130) 0.288 (0.752) 0.012 (0.009) 0.018 (0.013) 0.079 (0.062) 0.006 (0.027) 0.441 (0.918) -0.068 (0.120) 0.084 (0.085) 0.200 (0.134) -0.077 (0.022)
***
** ***
***
708 0.125 91.29 ***
2.562 (0.555) -0.457 (1.490) -0.510 (0.857) 0.264 (0.097) -0.215 (0.084) 0.036 (0.141) 0.288 (0.682) 0.011 (0.010) 0.019 (0.014) 0.076 (0.075) 0.005 (0.027) 0.410 (1.036) -0.072 (0.128) 0.082 (0.082) 0.195 (0.140) -0.076 (0.027) -0.021 (0.128)
***
*** **
***
708 0.132 100.04 ***
Note: Student overweight status is instrumented with respondent parent’s weight-class
Table 3 presents the estimation results for the relationship between perceptions of being overweight and GPA. The results indicate that students who do perceive themselves as being overweight attain a 0.747 lower mean GPA than their counterparts who perceive themselves as having a healthy weight. When controlling for the health of the students, there is not much of a difference in the relationship between the perception of being overweight and GPA. The results in Table 3 further indicate that similar to the findings in Table 2, the perception of being overweight has more of a significant negative impact on educational outcomes in urban areas than rural areas.
The Academic Cost, Page 8
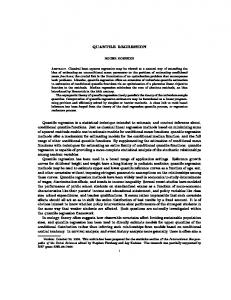
Research in Higher Education Journal Quantile Regression Results “Quantile regression allows the exploration of the entire range of conditional distribution versus just exploring relationships at the mean, as in the case of studies that employ OLS methodology in their estimations”(Koenker and Hallock 2001). For this study in particular, the quantile regression approach allows us to investigate if the relationship between being overweight and student GPA differs by a conditional quantile GPA distribution. We run quantile estimates for the 10th through the 90th quantiles. We present results in Figures 1 and 2 for the variable of interest relevant to the discussion of the quantile regression analysis. The results show some variations across different points on the conditional distribution of student GPA as well as differences between urban and rural residents. The dotted lines denote the 90% confidence bound, whereas the solid lines are the quantile regression estimates. Figure 1: Quantile regression results for overweight and GPA. Overweight without health
Overweight with health
0
0 0
2
4
6
8
10
-0.05
0
2
4
6
8
10
-0.05
-0.1
-0.1
-0.15
-0.15
-0.2
-0.2
-0.25
-0.25
l
Overweight urban without health
Overweight urban with health
0
0 0
2
4
6
8
10
0
-0.05
-0.05
-0.1
-0.1
-0.15
-0.15
-0.2
-0.2
-0.25
-0.25
-0.3
-0.3
2
Overweight rural without health 0.2
0.1
0.15
0.05
0.1
0
0.05 2
4
6
6
8
10
Overweight rural with health
0.15
0
4
8
10
-0.05
0
-0.1
-0.05
-0.15
-0.1
-0.2
-0.15
-0.25
-0.2
0
2
4
6
8
10
Figure 1 shows six quantile regression results for overweight and GPA using the overall sample. It is clear from Figure 1 that compared to healthy weight students, overweight students attain lower GPA’s across all conditional quantiles of GPA. However, this negative relationship is more pronounced in the lower than in the middle and upper quantiles. This result suggests that low achievers are more affected by being overweight than high achievers. Even with the inclusion of the health variable, the results seem to be the same (the second figure on the right). In terms of the urban and rural characteristics, the results show a similar trend for urban residents as in the overall sample estimation, where being overweight impacts educational outcomes more severely in lower GPA quantiles. The estimation result for rural residents is quite different, though. In this situation, the relationship between being overweight and GPA is only negative in the 10th, 70th, 80th and 90th quantiles, whereas the rest of the quantiles show a small positive relationship. The Academic Cost, Page 9
Research in Higher Education Journal
Figure 2: Quantile regression results for Student Perceived Overweight Status and GPA. Perception overall without health
Perception overall with health 0.12
0.1 0.08
0.1
0.06
0.08
0.04
0.06
0.02
0.04
0 0.02 -0.02 0
-0.04 -0.06
-0.02
-0.08
-0.04 0
2
4
6
8
10
2
4
6
8
10
-0.06
Perception urban without health
Perception urban with health
0.04
0.04
0.02
0.02
0
0 0
2
4
6
8
10
0
-0.02
-0.02
-0.04
-0.04
-0.06
-0.06
-0.08
-0.08
-0.1
-0.1
Perception rural without health
2
4
6
8
10
Perception rural with health
0.3
0.3
0.25
0.25
0.2
0.2
0.15
0.15
0.1
0.1
0.05
0.05
0
0 0
-0.05
0
2
4
6
8
10
0
2
4
6
8
10
-0.05
Figure 2 shows six quantile regression results for Student Perceived Overweight Status and GPA using the overall sample as well. It is clear from Figure 2 that students who perceive themselves as being overweight have a lower GPA than their counterparts who perceive themselves as having a healthy weight, especially across the 70th,80th, and 90th conditional quantiles of GPA. Thus this negative relationship is more pronounced in lower quantiles. This result suggests that students who perceive themselves as overweight are more harshly affected by that perception itself. Even with the inclusion of the health variable, the results appear similar (the second figure on the right). When evaluating the urban and rural characteristics, the results show that the impact of a perceived overweight status on educational outcomes is more severe in all the GPA quantiles. Overall, then, student perception in urban areas greatly affects their GPA. Yet the estimation result for rural residents does not show the same outcome. In this situation, the relationship between being students’ perception of being overweight and GPA is positive at all quantiles levels. Hence students in urban areas are much more affected by their perception of being overweight than students in rural areas, indicating that perhaps students in rural areas do not believe that being overweight is a serious obstacle to a positive academic outcome and thus do not allow their own perceptions to impede their academic progress.
The Academic Cost, Page 10
Research in Higher Education Journal Summary and Conclusions The goal of this study has been to investigate whether overweight students pay a price for their weight in terms of educational outcomes. It also explores if the magnitude of this price changes with different measures of obesity and type of educational outcome considered. Using both the youths’ own perception of being overweight or not as well as the estimated clinical overweight status for each youth as measures of being overweight, we show that youths who are overweight generally achieve relatively lower educational outcomes. The effect of the youths’ own perception of being overweight is slightly higher than when classified as clinically overweight, suggesting that the perception itself has more influence over the students’ academic performance. Further, we find that the impact of being overweight on educational outcomes may depend on the conditional distribution of educational outcomes in question, with low achievers struggling more with their weight and its influence on their grades. Our results also indicate that there is some difference in the dynamics of the relationship between weight status and educational outcomes in an urban or rural area. These results raise some interesting questions. Do rural students care less about their own weight than urban students? Do overweight rural students receive more acceptance from other rural students than do overweight urban students from the other urban students? Answers to these questions should prove to be complex and are beyond the scope of this study. Nevertheless, the difference between rural and urban areas in terms of why some overweight students find more or less acceptance deserves to be explored by additional studies. The links between obesity and educational outcome identified in this study should provide some policy conclusions to educators, particularly in the health sector. Perhaps the most important policy would be to improve the primary health of children in order to help control the development of obesity at a very young age as well as to help improve the academic performance of these kids. To do this, it is necessary to educate parents and children about the consequences of obesity – the economic, social, health, and psychological problems that may affect the child at a relatively young age. School educators on their part, as is already seen these days in some schools, can provide a healthy diet in their cafeteria. Educators also may want to consider encouraging a positive climate that is focused on academic excellence regardless of weight. Obesity is a growing problem not only among adults but also teen-agers and younger children. It is seen all around the world. This study describes the relationship between obesity and educational outcomes among American high school students. It leaves room for future research work to be conducted in this area. Notes 1
Including hypertension, dyslipidemia (for example, high total cholesterol or high levels of triglycerides), type 2 diabetes, coronary heart disease, stroke, gallbladder disease, osteoarthritis, sleep apnea and respiratory problems, and some cancers (endometrial, breast, and colon). 2 Note Datar et al. (2004) indicates that whiles IQ can serve as a measure of innate ability and likely affects educational attainment; it cannot necessarily be seen as educational attainment. 3 If the identification assumptions underlying the IV model are satisfied, then this estimate will control for any reverse causality whereby educational attainment may cause changes in obesity. 4 CDC website: www.CDC.gov. If an individual's BMI falls in the 5th percentile or lower in the age-sex specific BMI distribution, then the individual is clinically classified as underweight. If the individual's BMI falls in the 5th to 85th percentile the individual is classified as having a The Academic Cost, Page 11
Research in Higher Education Journal normal body weight. An individual in the 85th to 95th percentile is classified as at-risk of being obese, whereas an individual in the 95th percentile or higher is classified as obese. References
Case A., Lubotsky, D. and Paxson, C. (2002). Economic Status and Health in Childhood: The Origins of the Gradient. American Economic Review, 1308 -1334 Cawley J., Markowitz, S. and Tauras, J. (2006). Obesity, Cigarette Prices, Youth Access Laws, and Adolescent Smoking Initiation. Eastern Economic Journal, 149-170. Cawley J. (2004). The Impact of Obesity on Wages. Journal of Human Resources, 451-474. Cutler, M., Glaeser, D., Shapiro, L.E. and Jesse, M. (2003). Why Have Americans Become More Obese? Journal of Economics Perspectives, 93 –111. Datar A., Sturm, R. and Magnabosco, J.L.(2004). Childhood Overweight and Academic Performance: National Study of Kindergartners and First-Graders. Obesity Research, 5868. Davidson K.K., and Birch, L.L. (2001). Weight Status, Parent Reaction, and Self-concept in Five-year-old Girls. Pediatrics, 46-53. Erickson S, Robinson, K. and Cabral, H.J. (2000). Are Overweight Children Unhappy? Archives of Pediatrics and Adolescent Medicine, 931-935. Falkner N.H., Neumark-Sztainer, D., Story, M., Jeffery, R.W., Beuhring, T. and Resnick, M.D. (2001). Social, Educational, and Psychological Correlates of Weight Status in Adolescents. Obesity Research, 32-42. Freedman D.S., Dietz, W.H., Srinivasan, S.R. and Berenson, G.S. (1999). Relation of Overweight to Cardiovascular Risk Factors Among Children and Adolescents: The Bogalusa Heart Study. Pediatrics, 1175–1182. Horrigan, M. and Walker, J. (2001). The NLSY97: An Introduction. Monthly Labor Review, 3-5. Johnson, E., McInnes, M.M. and Shinogle, J.A. (2006). What is the Economic Cost of Overweight Children? Eastern Economic Journal, 171-187. Koenker, R. and Hallock K.F. (2001). Quantile Regression. Journal of Economic Perspectives, 143–156. Li X. (1995). A Study of Intelligence and Personality in Children With Simple Obesity. International Journal of Obesity, 355-367. Michael, R.T. and Pergamit, M.R. (2001). The National Longitudinal Survey of Youth, 1997 cohort. Journal of Human Resources, 628-640. Mo-suwan L, Lebel, L., Puetpaiboon, A. and Junjana, C. (1999). School Performance and Weight Status of Children and Young Adolescents in a Transitional Society in Thailand. International Journal of Obesity, 272-277. Pergamit, M.R., Pierret, C.R., Rothstein, D.S., and Veum, J.R. (2001). Data Watch. The National Longitudinal Surveys. Journal of Economic Perspectives, 239-253. Power C, Lake, J.K. and Cole, T.J. (1997). Measurement and Long-Term Health Risks of Child and Adolescent Fatness. International Journal of Obesity, 507–526. Rashad, I., Grossman, M. and Chou, S.Y. (2006). The Super Size of America: An Economic Estimation of Body Mass Index and Obesity in Adults. Eastern Economic Journal, 133148. Sabia J. J. (2007). The Effect of Body Weight on Adolescent Academic Performance. Southern Economic Journal, 871-900. The Academic Cost, Page 12
Research in Higher Education Journal Swallen, K.C., Reither, E.N., Haas, S.A. and Meier, A.M. (2005). Overweight, Obesity, and Health-Related Quality of Life Among Adolescents: The National Longitudinal Study of Adolescent Health. Pediatrics, 340-347 (doi:10.1542/peds.2004-0678). Zietz, J. and Joshi, P. (2005). Academic Choice Behavior of High School Students: Economic Rationale and Empirical Evidence. Economics of Education Review, 297-308.
The Academic Cost, Page 13