Apr 26, 2018 - Keywords: hidden semi-Markov model; vector autoregressive; regular- ized EM algorithm; multivariate financial returns. 1 Introduction.
A Regularized Vector Autoregressive Hidden Semi-Markov Model, with Application to Multivariate Financial Data Zekun Xu and Ye Liu
arXiv:1804.10308v1 [stat.AP] 26 Apr 2018
North Carolina State University
Abstract. A regularized vector autoregressive hidden semi-Markov model is developed to analyze multivariate financial time series with switching data generating regimes. Furthermore, an augmented EM algorithm is proposed for parameter estimation by embedding regularized estimators for the state-dependent covariance matrices and autoregression matrices in the M-step. The performance of the proposed regularized estimators is evaluated both in the simulation experiments and on the New York Stock Exchange financial portfolio data. Keywords: hidden semi-Markov model; vector autoregressive; regularized EM algorithm; multivariate financial returns
1
Introduction
In finance and economics, it is often assumed that the financial returns follow a white noise process. However, empirical evidence suggests that this assumption may be too strong to hold in practice. Ding et al.(1993)[1] found that there is substantial correlation between absolute returns. Andersen et al.(2001)[2] indicated that realized volatilities and correlations show strong temporal dependence and appear to be well described by long-memory processes. Moreover, Fan et al.(2017)[3] commented that the squared and the absolute returns of both S&P 500 index and the Apply stock exhibit significant serial correlations. Therefore, it is reasonable to model the financial return series using an autoregressive process. The drawback of an autoregressive process is that it alone cannot model the volatility clustering and heavy-tailed distribution in the financial return series. This is because such financial return series often have more than one latent data generating mechanisms. For example, the performance of a financial portfolio in a stable economy is expected to follow a different autoregressive process from that in a volatile economy. Ryden et al.(1998)[4] showed that a hidden Markov model (HMM) can reproduce most of the stylized facts for daily return series established by Granger and Ding (1995)[5]. HMM is a bivariate discrete time stochastic process {St , Yt }t≥0 such that (A1) {St } is a Markov chain, i.e. P (St |St−1 , ..., S1 ) = P (St |St−1 ). (A2) {Yt } is a sequence of conditional independent random variables given {St }.
In a Gaussian HMM, the marginal distributions for observed series are essentially modeled as a mixture of Gaussian distributions such that volatility clustering and heavy-tailedness are automatically incorporated in the model framework. Further, the transition between the latent states are directly modeled in HMM so as to account for the temporal dependence in the series. However, assumptions (A1) and (A2) may both be too strong to hold in practice. Assumption (A1) indicates that the current latent state depends only on the most recent latent state in the past; beyond that, it is memoryless. Ryden et al.(1998)[4] illustrated that the stylized fact of the very slowly decaying autocorrelation for absolute (or squared) returns cannot be described by a HMM. Bulla et al.(2006)[6] proposed the use of hidden semi-Markov model (HSMM) to overcome the lack of flexibility of HMM to model the temporal higher order dependence in financial returns. In HSMM, the latent state durations are explicitly modeled rather than assuming them to be geometric as in HMM. This has the practical advantage since it is typical that the longer time the economy spends in one of the latent states the more likely it will switch to another latent state. In the meantime, assumption (A2) can be dropped in the class of Markov-switching models proposed by Hamilton (1989)[7] where {Yt } is allowed to follow state-dependent Gaussian vector autoregressive processes, also known as vector autoregressive hidden Markov models (VAR-HMM). Yang (2000) [8] pointed out another interesting feature that VAR-HMM can occasionally behave in a nonstationary manner although being stationary and mean reverting in the long run. For general applicability, we are going to adopt the most flexible framework of a pth order vector autoregressive hidden semi-Markov model [VAR(p)-HSMM] to analyze multivariate financial time series. Note that both VAR and HMM are special cases in the VAR(p)-HSMM framework. Our goal is to make inference on the parameters that determine the data generating mechanism, as well as evaluate the prediction performance. A potential problem of VAR(p)-HSMM is the large number of parameters to be estimated when the dimension of Yt is high. A multivariate M-state VAR(p)-HSMM series of dimension d has M d(d+1) 2 parameters in the state-dependent covariance matrices and M pd2 parameters in the autoregression matrices. Unless the time series is extremely long, we are not able to reliably estimate the covariance and autoregression matrices even when the dimension d is moderate. Therefore, regularizations are needed to stabilize the parameter estimation. Stadler et al.(2013)[9], Fiecas et al.(2017)[10], and Monbet et al.(2017)[11] proposed different versions of a penalized log-likelihood procedure with regularization on the state-dependent inverse covariance matrices in a Gaussian HMM to form a more stable regularized estimator. So far, there is no literature that elaborates on the regularized estimation for VAR(p)-HSMM framework. Neither has the regularized VAR(p)-HSMM framework been used to model multivariate financial returns yet. Thus, our contribution is to provide a detailed parameter estimation procedure for a regularized VAR(p)-HSMM. The model framework of VAR(p)-HSMM is provided in Section 2, where we integrated the LASSO regularization by Tib-
shirani (1996)[12] on autoregression matrices, and shrinkage regularization by Ledoit et al.(2004)[13] on covariance matrices into the EM algorithm. Section 3 presents simulation studies on finite samples to evaluate the performance of the proposed regularized estimators in different scenarios. Section 4 provides an empirical analysis on the NYSE financial portfolio of 50 stocks using the regularized VAR(p)-HSMM. Section 5 gives a brief discussion. All the analyses utilize the R package ”rarhsmm”, which has been developed for fitting regularized VAR(p)HSMM.
2 2.1
Methodology Model framework
Denote by yt ∈ Rd for t=1,...,T to be the observed multivariate data at time t, where d is the dimension for each yt . Denote by St ∈ {1, ..., M } to be the latent state at time t, where M is the fixed finite number of states. Let δ = [δ1 , ..., δM ] be the prior probability of latent states. Further, we denote the latent state duration densities by r = [r1 , ..., rM ] such that ri (n) = P (stay n times in latent state i)
n = 1, 2, ..., D,
where D is the fixed maximum state duration, i.e. any state duration greater than D will be censored at D. In addition, denote by Q = {qij } for i=1,...,M and j=1,...,M the state transition matrix such that qij = P (St+1 = j|St = i)
t = 1, ..., T − 1,
PM where j=1 qij = 1 ∀ i ∈ 1, ..., M Thus, the data generating mechanism for VAR(p)-HSMM, can be described as follows. First, an initial state, S1 = i (i ∈ 1, ..., M ) is chosen according to the initial state distribution δi . Second, a duration n is chosen according to the latent state duration density ri (n). Third, observations y1 , ..., yn ∈ Rd are chosen according to the state-dependent pth order Gaussian vector autoregressive process p X yt = µi + Aki yt−k + �ti where �ti ∼ N (0, Σi ), (1) k=1
for i = 1,...,M and t = 1,...,n, where µi ∈ Rd and Σi ∈ Rd×d are the conditional mean and covariance matrix of yt given St , yt−1 , ..., yt−p ; Aki ∈ Rd×d is the k th -order autoregression matrix conditioning on St = i. Fourth, the next state, Sn+1 = j, is chosen according to the state transition probability qij , the i, j th element in the transition matrix Q. An implicit constraint is that there should be no transition back to the same state because we generate exactly n observations in latent state i in the previous steps, i.e. S1:n = i. Then the data generating process repeats the previous steps until we end up with T observations.
Denote by θ = [δ, r, Q, µ, Σ, A] the set of all parameters in VAR(p)-HSMM, where there are M − 1 free parameters in δ, M (D − 1) in r, M (M − 2) in Q, M d in µ, M d(d+1) in Σ, and M pd2 in A. 2 Our VAR(p)-HSMM framework is a natural generalization of the VAR(p)HMM framework [7,8,11,14] by allowing for the explicit modeling of the state duration distributions. In particular, we set all the latent state duration densities to be discrete nonparametric distributions with arbitrary point mass assigned to the feasible duration values so as to allow for the most flexibility. 2.2
Regularization
There are two motivations for us to apply regularization on the VAR(p)-HSMM framework. On the one hand, the daily financial time series is typically not long enough for us to reliably estimate all the parameters in the state-dependent covariance matrices in the VAR(p)-HSMM. Those covariance matrices may not be invertible especially when the dimension of yt is high. On the other hand, we assume that the state-dependent autoregression matrices to be sparse, i.e. many entries are nearly zero. Although the white noise assumption is often used in financial return data, the empirical evidence indicates that the IID assumption is too strong and too restrictive to be true in general [3,15]. Thus, a regularized estimator for autoregression matrices can shrink the negligible correlations to zero while allow for the possibility that some correlations may be significant. The regularized estimator for state-dependent covariance matrices follows the work of Ledoit et al.(2004) [13], Sancetta et al.(2008)[16], and Fiecas et al.(2017)[10] such that each regularized estimator is a convex combination of the maximum likelihood estimator and a scaled identity matrix with the same trace, Σr =
1 ˆ mle + λΣ cI Σ 1 + λΣ 1 + λΣ
s.t
ˆ tr(Σ
mle
) = tr(cI),
where λΣ ≥ 0 controls the strength of the regularization. Note that when λΣ = 0, ˆ mle . This regularized estimator results in shrinkage on the covariwe have Σr = Σ ance estimates and ensures the positive definiteness of the estimated covariance matrix when the sample covariance matrix is close to singularity. This holds even if λΣ is very small so that we do not increase much bias when stabilizing the estimate. Besides, this regularization yields not only invertible but also wellconditioned covariance estimates. As λΣ increases, the dispersion between the smallest and the largest eigenvalues for the estimated covariance matrix shrinks so that the matrix becomes more regular. The regularized estimator for state-dependent autoregressive coefficients is based on the classic LASSO regularization[12] such that
ar = arg min k vec(yp+1:T ) − µ + a
p X k=1
2 aT k vec(yp+1−k:T −k )k2 + λa kak1 ,
T T T T T where vec is the vectorization operator, and a = [aT p , ..., a1 ] = [vec(Ap ) , ..., vec(A1 ) ] is the vectorization of the state-dependent autoregression matrices. Here λa ≥ 0 controls the strength of the regularization on the `1 LASSO penalty, i.e. a larger λa will induce a more sparse estimator.
2.3
Cross-validation
The selection of the optimal regularization parameters λΣ and λa will be based on a similar cross-validation scheme by minimizing one-step-ahead mean-square forecast error (MSFE) as was described in Banbura et al. (2010) [17] and Nicholson et al. (2017) [18]. More specifically, the data is divided into three periods: one for training (1:T1 ), one for validation (T1 :T2 ), and one for forecasting (T2 :T ). The validation process starts by fitting a model using all data up to time T1 ,λa and forecast yλT1Σ+1 . Then we sequentially add one observation at a time and repeat this process until time T2 . Finally, from time T2 to T, we evaluate the one-step-ahead forecast error by minimizing M SF E(λΣ , λa ) =
TX 2 −1 1 Σ ,λa − yt+1 k2F , kyλt+1 T2 − T1 t=T1
q where k.kF is the Frobenius norm defined as kAkF = tr(AT A). A twodimensional grid-search is adopted to find the regularization values that minimize the MSFE, with 15 grid points in each dimension. 2.4
Parameter estimation
The parameter estimation procedure follows the general framework of EM algorithm for the class of hidden Markov models proposed by Baum et al. [19] and popularized by Dempster et al. [20]. Regarding the implementation of the EM algorithm to maximize the penalized likelihood function, the monotonic property and convergence results have been proved in Green (1990)[21] and De Pierro (1995)[22]. In the E-step, the standard forward-backward variables are generalized on the basis of Rabiner [23] and Yu [24]. Define fj,n (yt+1:t+n ) = P (yt+1:t+n |St+1:t+n = j), i.e. the state-dependent multivariate autoregressive Gaussian density for state j that lasts for duration n. Then, define the forward variables αt (j, n) = P (St−n+1:t = j, y1:t |θ), where j = 1, ..., M , t = 1, ..., T , and n = {1, ..., min(D, t)}. Initialize α0 (j, n) = δj
j = 1, ..., M,
(2)
Define the recursion αt (j, n) =
M min(D,t) X X
αt−n (i, n0 )qij ri (n)fj,n (yt−n+1:t ) for t = 1, ..., T.
(3)
n0 =1
i=1
Similarly, define the backward variables βt (j, n) = P (yt+1:T |St−n+1:t = j, θ) where j = 1, ..., M , t = 1, ..., T , and n = {1, ..., min(D, t)}. Initialize βT (j, n) = 1 and define the recursion βt (j, n) =
M min(D,T X X −t) i=1
qji rj (n)fi,n0 (yt+1:t+n0 )βt+n0 (i, n0 ) for t = T − 1, ..., 1.
n0 =1
(4) In addition, define the following 3 sets of auxiliary variables ξt (i, j) = P (St = i, St+1 = j, y1:T |θ) min(D,t) min(D,T −t)
=
X
X
n0 =1
n=1
αt (i, n0 )qij fj,n (yt+1:t+n )βt+n (j, n),
ηt (j, n) = P (St−n+1:t = j, y1:T |θ) = αt (j, n)βt (j, n),
(5)
(6)
min(D,t,T −t)
X
γt (j) = P (St = j, y1:T |θ) =
ηt (j, n).
(7)
n=1
Then in the E-step, we are ready to compute Q(θ|θ (l) ) = Eθ(l) {log[Pθ (y1 , ..., yT , S1 , ..., ST )]|y1 , ..., yT } = Eθ(l) {log[Pθ (S1 , ..., ST )]|y1 , ..., yT } + Eθ(l) {log[Pθ (V y1 , ..., yT |S1 , ..., ST )]|y1 , ..., yT } " # T M D M M X T X X X X X X ηt (j, n) ξt (i, j) log qij + log rj (n) γ0 (i) log δi + = γ (i) γt (i) t t=1 j=1 n=1 t=1 i=1 j6=i i=1 M T X X γt (j) log P (yt |yt−1:max(1,t−p) , µj , Σj , Aj ) , + t=1 j=1
(8) where θ (l) is the parameter value at the lth iteration, and P (yt |yt−1:max(1,t−p) , µj , Σj , Aj ) is the state-dependent density for the pth order Gaussian autoregressive process. In the M-step, we can harness the separability of parameters in Q(θ|θ (l) ) to maximize each component individually as follows, δj = γ0 (j)/
X
γ0 (j),
(9)
j
qij =
X t
rj (n) =
X t
ξt (i, j)/
XX j6=i
ηt (j, n)/
ξt (i, j),
XX n
(10)
t
t
ηt (j, n).
(11)
Then µj is updated as the unpenalized intercept in the weighted least squares regression for the VAR model with LASSO regularization, where each observation yt |yt−1:t−p is weighted by γt (j). The autoregression matrix Aj is updated as the coefficients in the same weighted least squares regression with LASSO regularization. These updates are carried out using coordinate descent algorithm detailed by Friedman et al.(2007) [25]. Σj is updated as a convex combination of the weighted error variance from VAR and a scaled identity matrix with the same trace. 2.5
Asymptotic properties
The asymptotic properties for the maximum likelihood estimators in HMM under suitable regularity conditions have been proved successively in Leroux (1992)[26], Bickel et al.(1998)[27], Douc et al.(2001)[28], Cappe et al.(2009)[29], and An et al.(2013)[30]. Furthermore, Barbu and Limnios (2009)[31] (also in Trevezas and Limnios 2011[32]) extended proof for the consistency and asymptotic normality of the maximum likelihood estimators for finite-state discrete-time hidden semi-Markov models. The conditions and results are summarized as follows, (B1) If for any states i, j ∈ {1, ..., M }, there is a positive integer τ such that P (St+τ = j|St = i) > 0 (B2) The conditional state duration distributions ri (.) have finite support ∀i ∈ {1, ..., M }. Under assumptions (B1) and (B2), the maximum likelihood estimator θˆT is strongly consistent as T −→ ∞. In the class of hidden semi-Markov model with a finite state space, assumption (B1) means that the Markov chain is irreducible. This holds when all the states communicate with each other, i.e. there is only one communication class in the transition matrix. (B2) automatically holds when we use the discrete nonparametric state duration distribution in the hidden semi-Markov model because we explicit assign probability mass to a finite collection of possible durations. In case a state duration density with infinite support is adopted, we can censor the distribution at a maximum duration D to satisfy the assumption. 2.6
Computational cost
To compute the likelihood in the E-step, Rabiner (1989)[23] pointed out that the computational complexity O(M 2 T ) for an M -state HMM with length T , and O(M 2 D2 T ) for an M-state explicit duration HSMM censored at the largest duration D. Further in our VAR(p)-HSMM framework, the dimension of the observed series is d and the order of autoregression is p. Therefore, we have to include the computational cost of O(d3 +d2 p) to compute the multivariate normal density in each forward-backward variable. This adds to a total computational cost O(M 2 D2 T (d3 + d2 p)) in the E-step.
In the M -step, the most computationally expensive part is the update for the the autoregression matrices under the elastic net regularization. Based on the results from Friedman et al.(2007) [25], the computational cost of the coordinate descent algorithm to solve LASSO is O(M d2 pT ) for M pth order vector autoregressions of dimension d. This computational cost is dominated by that from the E-step. Therefore, the total computational complexity is O(M 2 D2 T (d3 + d2 p)) for each EM iteration. As we can see, the algorithm scales linearly in the length of the series T and autoregression order p, but scales quadratically with the number of latent states M and the maximum censored duration D, and scales cubically with the dimension d.
3
Simulation studies
We conducted simulation experiments to evaluate how well the regularized estimators from VAR-HSMM retrieve the true parameter values as compared to the nonregularized VAR-HSMM. The first-order vector autoregressive hidden Markov series [VAR(1)-HSMM] were simulated with length 500. In each latent state, the observations follow a corresponding multivariate Gaussian distribution using the following parameter settings: The common parameters are set up as follows, – – – –
Number of latent states (M ) = 2 Dimension (d) = 50 Mean in state 1 (µ1 ) and state 2 (µ2 ) are both 050×1 Prior probability (π) = (0.5, � 0.5) � 01 – Transition matrix (Q) = 10 – Maximum latent state duration (D) = 30 Since the latent state durations [ri (.)] are explicitly modeled by discrete nonparametric distributions with equal point mass assigned to all feasible durations, the diagonal elements in the transition matrix (Q) are set to 0, i.e. no transition back to the same state is allowed. Then the simulations are done separately for the sparse matrices and dense matrices settings on the covariance and autoregression matrices using the following specifications, 1. Sparse matrices: – Sparse covariance matrices: Σ1 with entries Σ1,ij = e−|i−j| if |i − j| < 2 and 0 otherwise; Σ2 with entries Σ2,ij = e−2|i−j| if |i − j| < 2 and 0 otherwise – Sparse autoregression matrices: A1 is a tridiagonal matrix with 0.1 on the main diagonal, and 0.05 on the first diagonal above and below; A2 = 050×50 . 2. Dense matrices:
– Dense covariance matrices: Σ1 with entries Σ1,ij = e−|i−j| ; Σ2 with entries Σ2,ij = e−2|i−j| 1 −|i−j| e ; A2 – Dense autoregression matrices: A1 with entries A1,ij = 10 1 −2|i−j| with entries A2,ij = 10 e Two models are used for parameter estimation. Model 1 is VAR(1)-HSMM without regularization, whereas Model 2 is the regularized VAR(1)-HSMM. In Model 2, the regularization parameters λΣ and λa are selected using crossvalidation by minimizing one-step-ahead mean-square forecast error (MSFE) as described in Section 2.3. We set 15 grid points for λΣ that fall with equal space on the log scale between 0.0001 and 1. Similarly, we set 15 grid points for λa that fall with equal space on the log scale between 0.1 and 100. The first 300 observations are used for training, the next 100 for validation, and the last 100 for forecasting.
Parameter
Sparse Matrices Dense Matrices Model 1 Model 2 Model 1 Model 2 (nonregularized) (regularized) (nonregularized) (regularized) 4.243 (0.292) 0.863 (0.001) 4.061 (0.269) 0.808 (0.001) 3.676 (0.259) 0.001 (0.001) 3.680 (0.255) 0.720 (0.001) 3.307 (0.195) 2.490 (0.113) 3.325 (0.194) 3.379 (0.205) 3.233 (0.179) 2.220 (0.121) 3.244 (0.175) 3.308 (0.195) 0.523 (0.076) 0.519 (0.065) 0.524 (0.077) 0.521 (0.069) 0.504 (0.069) 0.464 (0.053) 0.525 (0.074) 0.504 (0.058) 0.256 (0.034) 0.302 (0.043) 0.259 (0.036) 0.275 (0.038) 0.255 (0.035) 0.301 (0.042) 0.259 (0.037) 0.276 (0.037)
kAˆ1 − A1 kF kAˆ2 − A2 kF kΣˆ1 − Σ1 kF kΣˆ2 − Σ2 kF kµˆ1 − µ1 kF kµˆ2 − µ2 kF krˆ1 − r1 kF krˆ2 − r2 kF Misclassification of states 2.5% (0.9%) 3.5% (1.1%) 5.2% (1.5%) 5.7% (1.5%) Table 1. Mean (standard error) for the difference in parameters and the misclassification of latent states with different matrix settings via 1000 simulations. Model 1 is the nonregularized VAR(1)-HSMM, while Model 2 is the regularized VAR(1)-HSMM. For Model 2, the regularization parameters are chosen using cross-validation by minimizing MSFE as defined in Section 2.3.
As can be seen from Table 1, the major advantage of the regularized VAR(1)HSMM (Model 2) over the nonregularized model (Model 1) lies in the estimation for the state-dependent autoregression matrices and covariance matrices, which is excatly what we would expect. In both the sparse and dense settings for the autoregression matrices (first 2 rows in Table 1), the regularized estimator from Model 2 produces a significantly smaller mean Frobenius norm difference than the nonregularized estimator. As for the estimation for the covariance matrices (row 3 and 4 in Table 1), the regularized estimator does a better job when the underlying true matrices are indeed sparse, while no significant differences are detected when the true matrices are dense. As for the rest, both Model 1 and
Model 2 are comparable in in terms of the performance on the state-dependent means, latent state durations, and misclassification rates of latent states.
4
Analysis on the NYSE portfolio data
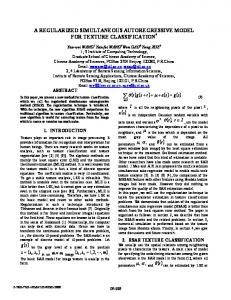
The financial portfolio data consists of the daily closing price of 50 most active NYSE stocks from 2015-01-02 to 2016-12-30 so that each time series is of length 504. This data set is publicly available for download in the R package ”rarhsmm”. We use the log return as the observed multivariate sequence {yt } with dimension 50 such that pricet+1 yt = log t = 1, ..., 503, pricet The left panel in Figure 1 shows there is a fairly strong, positive correlation in the lag 0 log returns among most of the 50 stocks. In contrast, the right panel displays the lag 1 correlation matrix, which is rather sparse. Indeed, 83 of the lag 1 sample correlations are significantly different from zero after testing by Fisher z-transformation (p < 0.05). This sparsity motivates the use of regularized estimators on the state-dependent autoregression matrices in the VAR(p)-HSMM framework. The model selection is performed among the competing regularized models [VAR, HMM, VAR(p)-HSMM] using the minimum MSFE criterion. The first 303 observations were used for training, the next 100 for validation, and the final 100 for forecasting. We set 15 grid points that fall with equal space on the log scale between 0.0001 and 1 for LASSO parameter on VAR coefficients. Similarly, we set 15 grid points that fall with equal space on the log scale between 0.1 and 100 for the shrinkage on the covariances. When fitting the VAR-HSMMs, the maximum latent state duration is set to be 30 and all latent state duration densities are chosen to be discrete nonparametric. From Table 2, all competing models perform comparably well in terms of the MSFE. Both regularized VAR(1)-HSMM and VAR(2)-HSMM with 2 states achieved the lowest MSFE of 2.271. Thus, the regularized VAR(1)-HSMM is selected to be the final model since it is simpler. The scatter plot in Figure 2 depicts the log returns of the 50 stocks from 2015-01-02 to 2016-12-30. A sequence of the decoded latent states using Viterbi algorithm is overlaid on top of the scatter plot. We can see that state 2 corresponds to the period with a higher volatility in the log return of the 50 stocks while state 1 represents a relatively stable economic period. Figure 3 displays the scatter plot and empirical distributions for the fitted means and variances in the two latent states (stable versus volatile). In the left panel, we can see that the means in both states are centered around 0, but the spread in the means of state 2 is much larger than that in state 1. From the scatter plot in right panel, it seems that most of the stocks have a larger variance for log return in state 2 than in state 1 since the majority of the points lie above the 45 degree line. This result also corroborates the claim that state 2 stands for a more volatile economy than state 1.
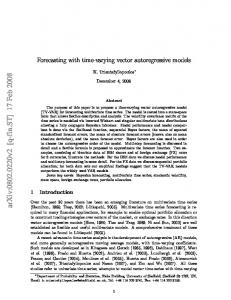
In Figure 4, both plots in the left panel for the fitted lag 0 correlation in state 1 and 2 show that there exists a relatively strong, postive correlation among most of the 50 stocks. However, both plots are sparse in the right panel, which stand for the fitted lag 1 correlation in the two latent states. Interestingly, we notice that all fitted VAR coefficients in state 1 (stable) are zero after regularization, whereas 200 of the VAR coefficients remain nonzero in state 2 (volatile). This may indicate that the financial returns in the stable economy does seem to follow a white noise process. In contrast, the financial returns show some evidence of autocorrelation when the economy is volatile.
1 0.8 0.6 0.4 0.2 0 −0.2 −0.4 −0.6 −0.8 −1
Fig. 1. The vertical and horizontal axes in both plots represent the index of the 50 stocks, i.e. from 1 to 50, while the color stands for the strength of correlation. The left panel shows the lag 0 sample correlation among the log returns of the 50 stocks. The right panel shows the lag 1 sample correlation among the log returns of the 50 stocks, where only 83 of them are significantly different from zero after testing by Fisher z-transformation (p < 0.05).
Model ID Model specification MSFE 1 Regularized VAR(1) 2.293 2 Regularized HMM with 2 latent states 2.288 3 Regularized VAR(1)-HSMM with 2 latent states 2.271 4 Regularized VAR(2)-HSMM with 2 latent states 2.271 5 Regularized VAR(1)-HSMM with 3 latent states 2.289 Table 2. The regularization parameters are selected using cross-validation by minimizing one-step-ahead mean-square forecast error (MSFE). We set 15 grid points that fall with equal space on the log scale between 0.0001 and 1 for LASSO parameter on VAR coefficients. Similarly, we set 15 grid points that fall with equal space on the log scale between 0.1 and 100 for the shrinkage on the covariances.
Fig. 2. The plot depicts the log returns of the 50 stocks from 2015-01-02 to 2016-12-30. A sequence of the decoded latent states using Viterbi algorithm is overlaid on top of the scatter plot. We can see that state 2 corresponds to the period with a higher volatility in the log return of the 50 stocks.
Fig. 3. The left panel presents the scatter plot and empirical distributions of the fitted means in state 1 (stable) and 2 (volatile). The right panel shows the scatter plot and empirical distributions of the fitted variances in state 1 and 2.
Fitted lag 0 correlation in state 1 (Stable)
Fitted lag 0 correlation in state 2 (Volatile)
1
Fitted lag 1 correlation in state 1 (Stable)
1
0.8
0.8
0.6
0.6
0.4
0.4
0.2
0.2
0
0
−0.2
−0.2
−0.4
−0.4
−0.6
−0.6
−0.8
−0.8
−1
−1
1
Fitted lag 1 correlation in state 2 (Volatile)
1
0.8
0.8
0.6
0.6
0.4
0.4
0.2
0.2
0
0
−0.2
−0.2
−0.4
−0.4
−0.6
−0.6
−0.8
−0.8
−1
−1
Fig. 4. The two plots on the left stand for the fitted lag 0 correlation in state 1 and 2 respectively, where both shows strong, positive correlation. The two plots on the right represent the fitted lag 1 correlation in state 1 and 2 respectively, which are both sparse. Specifically, all fitted VAR coefficients in state 1 (stable) are zero after regularization, while 200 of the VAR coefficients are still nonzero in state 2 (volatile).
5
Discussions
The class of regularized VAR-HSMM provides a flexible framework to model the switching data generating regimes in multivariate financial time series data, which can work especially well when these state-dependent covariance and autoregression matrices are indeed sparse. In the case study in Section 4, the maximum latent duration (D) is set to be 30 so as to account for the potential long temporal dependence. We do not want D to be too small, in which case the VAR(p)-HSMM would boil down to VAR(p)-HMM. Although the computation cost of the algorithm increases quadratically in D, the number of parameters only increases linearly in D. In the final regularized model of VAR(1)-HSMM, there are 2909 estimated parameters that are nonzero, where 2550 of them belong to the state-dependent covariance matrices. The fitted means in both states are centered around zero, and there exists strong, positive correlation among most
of the stocks in both states. However, the financial returns in state 1 (stable) seems to satisfy the white noise assumption while there is some evidence of lag 1 correlation in state 2 (volatile). In addition, there are other choices of regularization on the covariance and autoregression matrices. For instance, graphical LASSO [33] could be used on the state-dependent covariance matrices and SCAD [34] could be used on the autoregression matrices, which is the strategy adopted by [11] in their VAR-HMM. Another common technique to reduce the number of parameters in covariance and autoregression matrices is to make parametric assumptions on their structures, which will in turn require testing the goodness-of-fit for those assumptions.
References 1. Z. Ding, C. W. Granger, R. F. Engle, A long memory property of stock market returns and a new model, Journal of empirical finance 1 (1993) 83 -106. 2. T. G. Andersen, T. Bollerslev, F. X. Diebold, H. Ebens, The distribution of realized stock return volatility, Journal of financial economics 61 (2001) 43 - 76. 3. J. Fan, Q. Yao, The Elements of Financial Econometrics, Cambridge University Press, 2017. 4. T. Ryden, T. Terasvirta, S. Asbrink, Stylized facts of daily return series and the hidden markov model, Journal of applied econometrics (1998) 217 - 244. 5. C. W. J. Granger, Z. Ding, Some properties of absolute return: An alternative measure of risk, Annales d’Economie et de Statistique (1995) 67 - 91. 6. J. Bulla, I. Bulla, Stylized facts of financial time series and hidden semi-markov models, Computational Statistics & Data Analysis 51 (2006) 2192 - 2209. 7. J. D. Hamilton, A new approach to the economic analysis of nonstationary time series and the business cycle, Econometrica: Journal of the Econometric Society (1989) 357 - 384. 8. Some properties of vector autoregressive processes with markov-switching coefficients, Econometric Theory 16 (2000) 23 - 43. 9. N. Stadler S. Mukherjee, et al., Penalized estimation in high-dimensional hidden markov models with state-specific graphical models, The Annals of Applied Statistics 7 (2013) 2157 - 2179. 10. M. Fiecas, J. Franke, R. von Sachs, J. Tadjuidje Kamgaing, Shrinkage estimation for multivariate hidden markov models, Journal of the American Statistical Association 112 (2017) 424 - 435. 11. V. Monbet, P. Ailliot, Sparse vector markov switching autoregressive models. application to multivariate time series of temperature, Computational Statistics & Data Analysis 108 (2017) 40 - 51. 12. R. Tibshirani, Regression shrinkage and selection via the lasso, Journal of the Royal Statistical Society. Series B (Methodological) (1996) 267 - 288. 13. O. Ledoit, M. Wolf, A well-conditioned estimator for large-dimensional covariance matrices, Journal of multivariate analysis 88 (2004) 365 - 411. 14. C. Francq, J.-M. Zakoan, Stationarity of multivariate markov-switching arma models, Journal of Econometrics 102 (2001) 339 - 364. 15. F. Jurgen, W. Hardle, C. Hafner, Statistics of Financial Markets: An Introduction, Springer, 2011. 16. A. Sancetta, Sample covariance shrinkage for high dimensional dependent data, Journal of Multivariate Analysis 99 (2008) 949 - 967.
17. M. Banbura, D. Giannone, L. Reichlin, Large bayesian vector auto regressions, Journal of Applied Econometrics 25 (2010) 71 - 92. 18. W. B. Nicholson, D. S. Matteson, J. Bien, Varx-l: Structured regularization for large vector autoregressions with exogenous variables, International Journal of Forecasting 33 (2017) 627 - 651. 19. L. E. Baum, T. Petrie, G. Soules, N. Weiss, A maximization technique occurring in the statistical analysis of probabilistic functions of markov chains, The annals of mathematical statistics 41 (1970) 164 - 171. 20. A. P. Dempster, N. M. Laird, D. B. Rubin, Maximum likelihood from incomplete data via the em algorithm, Journal of the royal statistical society. Series B (methodological) (1977) 1 - 38. 21. P. J. Green, On use of the em for penalized likelihood estimation, Journal of the Royal Statistical Society. Series B (Methodological) (1990) 443 - 452. 22. A. R. De Pierro, A modified expectation maximization algorithm for penalized likelihood estimation in emission tomography, IEEE transactions on medical imaging 14 (1995) 132 - 137. 23. L. R. Rabiner, A tutorial on hidden markov models and selected applications in speech recognition, Proceedings of the IEEE 77 (1989) 257 - 286. 24. S.-Z. Yu, Hidden semi-markov models, Artificial intelligence 174 (2010) 215 - 243. 25. J. Friedman, T. Hastie, H. Hofling, R. Tibshirani, et al., Pathwise coordinate optimization, The Annals of Applied Statistics 1 (2007) 302 - 332. 26. B. G. Leroux, Maximum-likelihood estimation for hidden markov models, Stochastic processes and their applications 40 (1992) 127 - 143. 27. P. J. Bickel, Y. Ritov, T. Ryden, et al., Asymptotic normality of the maximumlikelihood estimator for general hidden markov models, The Annals of Statistics 26 (1998) 1614 - 1635. 28. R. Douc, C. Matias, et al., Asymptotics of the maximum likelihood estimator for general hidden markov models, Bernoulli 7 (2001) 381 - 420. 29. O. Cappe, E. Moulines, T. Ryden, Inference in hidden markov models, Springer Series in Statistics, 2005. 30. Y. An, Y. Hu, J. Hopkins, M. Shum, Identifiability and inference of hidden Markov models, Technical Report, Technical report, 2013. 31. V. S. Barbu, N. Limnios, Semi-Markov chains and hidden semi-Markov models toward applications: their use in reliability and DNA analysis, volume 191, Springer Science & Business Media, 2009. 32. S. Trevezas, N. Limnios, Exact mle and asymptotic properties for nonparametric semi-markov models, Journal of Nonparametric Statistics 23 (2011) 719 - 739. 33. Yuan, M. and Lin, Y. Model selection and estimation in the Gaussian graphical model. Biometrika, pp.19-35, 2007. 34. Fan, J. and Li, R. Variable selection via nonconcave penalized likelihood and its oracle properties. Journal of the American statistical Association, 96(456), pp.13481360, 2001.