Page 1 ... KEYWORDS: ascertainment, stochastic EM algorithm, missing data, outcome- .... data problems, such as the Expectation Maximization (EM) algorithm ...
The International Journal of Biostatistics Volume 6, Issue 1
2010
Article 23
A Stochastic EM Type Algorithm for Parameter Estimation in Models with Continuous Outcomes, under Complex Ascertainment Maria Grünewald, Stockholm University Keith Humphreys, Karolinska Institutet Ola Hössjer, Stockholm University
Recommended Citation: Grünewald, Maria; Humphreys, Keith; and Hössjer, Ola (2010) "A Stochastic EM Type Algorithm for Parameter Estimation in Models with Continuous Outcomes, under Complex Ascertainment," The International Journal of Biostatistics: Vol. 6: Iss. 1, Article 23. DOI: 10.2202/1557-4679.1222 Available at: http://www.bepress.com/ijb/vol6/iss1/23 ©2010 Berkeley Electronic Press. All rights reserved.
A Stochastic EM Type Algorithm for Parameter Estimation in Models with Continuous Outcomes, under Complex Ascertainment Maria Grünewald, Keith Humphreys, and Ola Hössjer
Abstract Outcome-dependent sampling probabilities can be used to increase efficiency in observational studies. For continuous outcomes, appropriate consideration of sampling design in estimating parameters of interest is often computationally cumbersome. In this article, we suggest a Stochastic EM type algorithm for estimation when ascertainment probabilities are known or estimable. The computational complexity of the likelihood is avoided by filling in missing data so that an approximation of the full data likelihood can be used. The method is not restricted to any specific distribution of the data and can be used for a broad range of statistical models. KEYWORDS: ascertainment, stochastic EM algorithm, missing data, outcome-dependent sampling, genetic epidemiology Author Notes: We are very grateful to Jonathan Prince for providing the AD data set and for valuable discussions. Keith Humphreys work was supported by the Swedish Research Council, grant number 523-2006-972, Maria Grünewald's work was supported by the Swedish Foundation for Strategic Research (SSF), grant number A3 02:129, and Ola Hössjer's work was supported by the Swedish Research Council, grant number 621-2005-2810.
Grünewald et al.: A Stochastic EM Type Algorithm for Parameter Estimation
1 1.1
Introduction Complex ascertainment - background
Most standard statistical tools for analyzing data from observational studies assume that simple random sampling is used. Outcome dependent sampling may however increase study efficiency. The case-control design (Breslow, 1982), for example, has been widely used in epidemiology. An attractive feature of the design is that unbiased estimates of relative risks can be obtained by performing statistical analysis on the data using a logistic regression model, as if the data were from a prospective study. More complex sampling designs may further increase efficiency. In the twostage case-control design some covariate information is recorded on all subjects included in a study (Stage 1) whilst other covariate information, e.g. more expensive covariates, is gathered only on a subset of samples (Stage 2); the probability that the subject is included in Stage 2 is dependent on Stage 1 covariates. There is a large literature dealing with how to analyze outcome dependent, and two-stage, samples when the outcome is categorical, using a pseudo or semi-parametric likelihood (Breslow and Cain, 1988, Breslow and Holubkov, 1997, Breslow and Chatterjee, 1999, Chen, 2003). In general, there is less written about how to deal with continuous outcomes under complex sampling designs, although some of the above mentioned literature does touch on the topic. Outcome dependent sampling based on continuous outcomes is common in genetic epidemiology. In an ongoing study (www.biobanks.se/cardiovascular.htm) at the second author’s institute individuals in the upper and lower tertiles of cholesterol distributions are selected from a cohort study of 60 year old men in Stockholm, for genotyping. This particular study has a two-stage cohort design and hence the study base is clearly defined. For such designs outcome variables Y are known for the entire cohort sample – unbiased estimation of regression parameters is possible and computationally straightforward via application of the EM algorithm. Often study bases are instead ill-defined, e.g. hospital-based studies; it is these study designs which we focus on in this article. One example is the genetic association study of type II diabetes described by Gu, Abulaiti, Ostenson, Humphreys, Wahlestedt, Brookes, and Efendic (2004) where sampling probabilities are directly dependent on continuous outcomes, which define the diabetes phenotype. Parameter estimation in regression models with continuous outcomes measured in such samples, i.e. obtained under outcome dependent sampling, will be biased unless the ascertainment scheme is accounted for. Another example of a study in which a continuous outcome is studied under a complex sampling scheme is provided by Prince, Zetterberg, Andreasen, Marcusson, and Blennow (2004), where association between variants in the ApoE gene and cerebrospinal fluid levels of Aβ 42 (the 42Published by Berkeley Electronic Press, 2010
1
The International Journal of Biostatistics, Vol. 6 [2010], Iss. 1, Art. 23
amino acid fragment of β -amyloid) is studied in Alzheimer’s patients and healthy controls. An analysis of the Alzheimer’s disease data set is reported in Section 3.3. Various inference procedures for complex ascertainment schemes have been proposed. We start by reviewing some of these.
1.2
Full likelihood approach
Although not fitting fully into the classical framework of missing data problems (Little and Rubin, 1987), ascertainment can still be viewed as a missing data problem. In missing data problems data are partitioned into observed data, Zobs , and missing data Zmis , and there is typically a well-defined set of subjects for which some variables have missing values, while there is partially complete information, Zobs , on remaining variables. In our setting all variables can be viewed as belonging to Zmis when a subject is not ascertained. In more detail, we let Zcom = (Z1 , ..., Zncom ) denote the complete data set before ascertainment, where Z j = (X j ,Y j ) contains explanatory variables (X j ) and response variables (Y j ) of individual j. We assume that Z j are independent and identically distributed, parameterized by θ and that either Z j are completely observed (A j = 1) or not observed at all (A j = 0), where A j is the ascertainment or sampling indicator of individual j. Individuals are sampled independently, with sampling probabilities not depending on data on other individuals, so that P(A j = 1|Zcom , θ ) = P(A j = 1|Z j , θ )
(1)
for all j. In all examples, we also assume that P(A j = 1|X j ,Y j , θ ) = P(A j = 1|Y j ), i.e. the probability of ascertainment is independent of θ and X j given observed data for individual j. However, this restriction is not needed to define the method. Put Acom = (A1 , . . . , Ancom ). The likelihood of complete data, Lcom (θ , Zcom , Acom ) =P(Zcom , Acom |θ , ncom ) ncom
ncom
j=1
j=1
= ∏ P(Z j |θ )P(A j |Z j ) ∝
∏ P(Z j |θ )
(2)
is not known, since not all Z j are observed. The full likelihood of observed data is obtained by integrating (2) over the missing variables ncom and Z mis , weighted by their joint probability distribution. This means in particular that we must put a ’prior’ distribution Qncom = P(ncom ) on ncom , assumed not to depend on θ . Without loss of generality, we assume that the first nobs individuals are ascertained and decompose Zcom = (Zobs , Zmis ) into observed data Zobs = (Z1 , . . . , Znobs ) and missing http://www.bepress.com/ijb/vol6/iss1/23 DOI: 10.2202/1557-4679.1222
2
Grünewald et al.: A Stochastic EM Type Algorithm for Parameter Estimation
data Zmis = (Znobs +1 , . . . , Zncom ). Then Acom becomes a known function of Zobs and Zmis and can be dropped in the notation. The full likelihood can be written L(θ ; Zobs ) = P(Zobs |θ )
µ obs ¶Z n +m = ∑ Qnobs +m P(Zobs , Zmis |θ , nmis )dZmis mis m n =m m=0 µ ¶ ∞ nobs nobs + m m = ∑ Qnobs +m (1 − Pθ ) ∏ P(A j = 1|Z j )P(Z j |θ ), m j=1 m=0 ∞
(3)
where nmis = ncom − nobs is the number of missing observations, i.e. the dimensionality of Zmis and Z Z
Pθ = P(A j = 1|θ ) =
Yj X j
P(A j = 1|Y j )P(X j ,Y j |θ )dX j dY j .
(4)
A particular feature of the ascertainment problem is that nmis is unknown, making (3) an intractable sum of terms. Indeed, the intractability of (3) is in some sense explained by the fact that data are ’not missing at random’ (NMAR, Little and Rubin, 2002), and sampling probabilities cannot be determined from Zobs alone.
1.3
Conditioning on ascertainment
A second general approach for correcting for ascertainment is to base inference on observed data conditional on ascertainment, giving a conditional likelihood
L
cond
obs
(θ ; Z
nobs
nobs
P(A j = 1|Y j )P(Z j |θ ) Pθ j=1
) = ∏ P(Z j |A j = 1, θ ) = ∏ j=1
nobs
P(Z j |θ ) Lnaive (θ ; Zobs ) ∝∏ = , obs Pθ Pn j=1
(5)
θ
where L
naive
(θ ; Z
obs
nobs
) = ∏ P(Z j |θ ) j=1
is the naive likelihood, not taking ascertainment into account, or equivalently, assuming P(A j |Z j ) ≡ 1. However, this form of the likelihood also makes likelihoodbased estimation computationally difficult. The computational problem arises when Published by Berkeley Electronic Press, 2010
3
The International Journal of Biostatistics, Vol. 6 [2010], Iss. 1, Art. 23
(4) is intractable. For continuous Y some examples of such settings are: if X is continuous or a mixture of discrete and continuous variables, or if ascertainment probability is a continuous function of Y , which could be the case in size biased sampling, see Patil (2002). When analytical solutions are not available, methods for numerical integration, such as importance sampling, can be used. This approach is investigated here as a comparison to the SEM type algorithm described in Subsection 2.1. An attractive approach to estimation for study designs where samples are drawn with different probabilities in different regions of the space of a continuous outcome, Y , is described by Zhou, Chen, Rissanen, Korrick, Hu, Salonen, and Longnecker (2007). They describe a semi-parametric empirical likelihood approach to analyze data that consist of both a simple random sample and supplement samples from strata that are presumed highly informative based on their values of Y . Features of the approach are that no parametric assumptions are required for covariates and that ascertainment probabilities are not required to be known or estimated. Often it is advantageous not to make parametric assumptions for covariates, although in genetics it can be advantageous (Chen and Chatterjee, 2007). Comparison with the approach by Zhou et al. (2007) is included in one of the examples in Section 4.
1.4 Retrospective likelihood approach A third alternative to (3) and (5) is to use the retrospective likelihood P(X|Y, A), utilizing the fact that ascertainment probabilities cancel out of the likelihood when A is independent of X|Y , leaving P(X|Y, A) = P(X|Y ). However, Y is typically not ancillary. This implies loss of information when conditioning on Y, and often the set of parameters describing the relationship between X and Y is not identifiable (Liang, 1983). Some, but not all of the parameters may however be identifiable. See Chen (2003) for a discussion of parameter identification for the general odds ratio function.
1.5
Summary of the paper
When inference is based on (3), it is useful to consider algorithms used in missing data problems, such as the Expectation Maximization (EM) algorithm (Dempster, Laird, and Rubin, 1977) and its extensions. Wacholder and Weinberg (1994) used the EM algorithm to obtain Maximum Likelihood estimates in case-control studies with complex ascertainment. If calculating the expected complete data likelihood in the EM algorithm requires computationally demanding numerical integration, http://www.bepress.com/ijb/vol6/iss1/23 DOI: 10.2202/1557-4679.1222
4
Grünewald et al.: A Stochastic EM Type Algorithm for Parameter Estimation
one way to side-step the problem is to simulate the missing data, and use the value of the observed sample mean instead of the calculated expectation. In this spirit we describe a novel approach for parameter estimation for data with ascertainment on one or more variables, when sampling probabilities are known/estimable. Ascertainment is allowed to depend on explanatory and/or outcome variables, which may be continuous and/or categorical. The algorithm is similar to a Stochastic EM (SEM) algorithm (Celeux and Diebolt, 1985). This approach is general in the sense that it is not restricted to a particular design. The SEM algorithm has been shown to be useful in a wide range of missing data problems such as time-to-event data with censoring data sets (Ip, 1994) and haplotype estimation (Tregouet, Escolano, Tiret, Mallet, and Golmard, 2004). The basic idea of the method is to regenerate the missing data. Combined with the observed data, an artificial random sample from the targeted population is then formed. Parameter estimates are obtained using using the Maximum Likelihood approach for the artificial random sample. The effect of randomness of the artificial sample on the model parameter estimates is reduced by averaging over estimates from repeated generations. The SEM algorithm is known to be more robust to poorly specified starting values than the deterministic EM algorithm (Gilks, Richardson, and Speigelhalter, 1996), which is a highly attractive feature in our setting. For further reading on the SEM algorithm see Gilks et al. (1996) and McLachlan and Krishnan (1997). We will first, in Section 2.1, present the SEM type algorithm for use in the ascertainment problem as described above. Two other approaches, a data augmentation method due to Clayton (2003), and a method based on importance sampling are presented in Section 2.2 for comparison. Some examples are presented in Section 3. Analysis of the example data sets are presented in Section 4, evaluating the SEM type algorithm and comparing it with other methods. The results are discussed in Section 5.
2 2.1
Methods A SEM type algorithm for the full likelihood approach
2.1.1 The SEM algorithm for incomplete data Suppose interest is in estimating θ in a data set where some data are missing. If the incomplete data can be augmented to resemble complete data, an approximation of the full likelihood (3) can be used. The essential idea is to inflate the observed sample, using simulated observations.
Published by Berkeley Electronic Press, 2010
5
The International Journal of Biostatistics, Vol. 6 [2010], Iss. 1, Art. 23
The resulting algorithm is iterative, and can be summarized as follows: 1. Select a starting parameter value θˆ0 = θ ∗ . Put i = 1. 2. (Simulation-step) Simulate N = 1 set of missing data Zmis = (Zi(nobs +1) , . . . , Zincom ) i i ∼ Zmis |Zobs , θˆi−1 . Put Zcom = (Zobs , Zmis ) and compute the likelihood i
i
Lappr (θ ; Zcom ) i µ com ¶ nobs ncom i ni = Qncom P(Z | θ )P(A = 1|Z ) · j j j ∏ P(Zi j |θ )P(Ai j = 0|Zi j ) i nobs ∏ j=1 j=nobs +1 nobs
∝
ncom i
∏ P(Z j |θ ) · ∏ obs j=1
j=n
P(Zi j |θ )
(6)
+1
which can be viewed as a Monte Carlo approximation of the full likelihood (3) of the observed data set, using a single imputed sample, and Ai j are the ascertainment indicators of Zicom . 3. (Maximization-step) Obtain new parameter estimates θˆi = arg maxθ Lappr (θ ; Zcom i ). 4. i → i + 1. If i ≤ B + I, go to Step 2, otherwise compute θ˜ =
B+I
∑
θˆi /I,
i=B+1
where B is the burn-in time and I the number of iterations after burn-in. The required size of the chain, I, is determined both by the specific problem at hand and by how much extra variability is accepted. Gilks et al. (1996) suggest, in the setting of Markov chain Monte Carlo, that parallel chains are run, so that comparison can be made. For large I estimates from a converged SEM algorithm will be similar to estimates from a converged EM algorithm. As mentioned above, the SEM algorithm can be viewed as an iterative single imputation method within a likelihood framework. By using N = 1 missing data sets per iteration, the ascertainment probabilities enter into the Simulation-step likelihood as a multiplicative constant, and hence can be dropped in the Maximizationstep. As a result, regression and covariate distribution parameters can be estimated separately in the Maximization-step, as for a simple random sample. 2.1.2 Applying a SEM type algorithm to the ascertainment problem We now discuss in more detail how to generate missing data in the simulation step of the SEM-algorithm. The non-ascertained component is considered missing and http://www.bepress.com/ijb/vol6/iss1/23 DOI: 10.2202/1557-4679.1222
6
Grünewald et al.: A Stochastic EM Type Algorithm for Parameter Estimation
is imputed as Zimis in Iteration i of the algorithm. It thus remains to specify how to simulate from P(Zmis |Zobs , θ ) for any parameter vector θ . Normally when the SEM algorithm is used to fill in missing data there is a fixed sample size and data are filled in for those observations where data are missing. Here we assume that the sample size, ncom , of the representative data, is not known, as it would be in a two-stage cohort design. It follows from (1) that nmis and Zobs are conditionally independent given nobs , and also that Zobs and Zmis are conditionally independent given nmis . Hence P(Zmis |Zobs , θ ) = P(nmis |Zobs , θ )P(Zmis |nmis , Zobs , θ ) = P(nmis |nobs , θ ) · P(Zmis |nmis , θ ) = P(n
mis
|n
obs
ncom
,θ)·
∏ obs
j=n
P(Z j |A j = 0, θ ).
(7)
+1
Since the last product of (7) is obtained from the parametric model, it remains only to specify P(nmis |nobs , θ ). Let Pθ and Qn be as in (3). It follows from Bayes’ Rule that P(nmis = m|nobs = k, θ ) = P(ncom = k + m|nobs = k, θ ) ∝ P(nobs = k|ncom = k + m, θ )Qm+k µ ¶ m+k k = Pθ (1 − Pθ )m Qm+k k
(8)
for m = 0, 1, 2, . . . where the proportionality constant does not depend on m. In particular, with the improper ’prior’ Qn = 1/n we obtain nmis = m|nobs = k, θ ∼ NegBin(k, Pθ ).
(9)
Now (7)-(9) naturally give rise to a rejection algorithm for generating Zmis : mis Simulate: Simulate data Z mis j , A j , j = 1, 2, . . . independently from P(A, Z|θ ) = obs P(Z|θ )P(A|Y ) and stop when |{ j; Amis j = 1}| = n . Reject: Throw away the observations Z mis with A j = 1 and keep those Z mis with j j A j = 0.
Alternatively, given any Qm , we may use a standard simulation technique for mis discrete random variables to first generate nmis from (8), and then sample Z mis j ,Aj , j = Published by Berkeley Electronic Press, 2010
7
The International Journal of Biostatistics, Vol. 6 [2010], Iss. 1, Art. 23
1, 2, . . . until |{ j; A j = 0}| = n mis. However, the rejection algorithm based on (9) is particularly appealing, since we obtain, in each simulation, an ascertained data set of correct size nobs . In the rest of the paper, we will use (9). 2.1.3 Variance calculation An approximation of the variance of θ˜ can, according to Gilks et al. (1996), be computed by utilizing the property that the observed data likelihood in the EM algorithm can be specified in terms of the complete data likelihood (Louis, 1982), but replacing the theoretical mean and variance with bootstrap estimates (Efron, 1992). The bootstrap estimates are obtained as follows: Fill in the missing data with simucom com lated data K times, using θ˜ , to obtain pseudo complete data sets Zcom 1 , Z2 . . . ZK . The observed information is −l 00 (θ , Zobs ) = Eθ [−l 00 (θ , Zcom )] −Covθ [l 0 (θ , Zcom )],
(10)
where l = logL is the log likelihood and the expectation and covariance are calculated over the K pseudo samples. The covariance matrix is then obtained by taking the inverse of the information matrix as usual. The variance is scaled with respect to nobs .
2.2
Importance sampling and data augmentation
We now summarize two alternative strategies to obtain parameter estimates in data with non-random ascertainment. These approaches, in common with the SEM type algorithm, are simulation based and use Maximum Likelihood for estimation. Both approaches yield parameter estimates that can be viewed as Monte Carlo approximations of the Maximum Likelihood estimates obtained from the conditional likelihood (5). 2.2.1 Importance sampling As mentioned above the difficulty in calculating the likelihood of the ascertained data lies in the integration of (5). Importance sampling (Hammersley and Handscomb, 1964) is a Monte Carlo method used for numerical integration. The basic idea is to sample from one distribution to obtain the expectation of another. This is advantageous for sampling efficiently but also when drawing samples from the target distribution is difficult. In general terms, for a random variable X which has density f1 (x), the expectation of some function g of X can be written as
http://www.bepress.com/ijb/vol6/iss1/23 DOI: 10.2202/1557-4679.1222
8
Grünewald et al.: A Stochastic EM Type Algorithm for Parameter Estimation
Z
µ = E f1 [g(X)] =
Z
f1 f1 g(x) f2 dx = E f2 [ g(X)] f2 f2
g(x) f1 dx =
for f2 > 0 whenever the support of f2 includes that of g f1 > 0. This means that samples can be drawn from f2 to obtain the expectation of g(x) under f1 . We can apply the importance sampling technique to approximate (5). One way to implement importance sampling in this context is to draw observations from a distribution which has the same parametric form as the target distribution P(Z|θ ), but in the place of θ , use na¨ıve guesses of the values of θ , which we call θ ∗ , in analogy with the starting values for the SEM type algorithm. In this case P(A = 1|θ ) is estimated by noting that Z
P(A = 1|θ ) =
Z
P(A = 1|Z)P(Z|θ )dZ =
[P(A = 1|Z)
P(Z|θ ) ]P(Z|θ ∗ )dZ. P(Z|θ ∗ )
If we draw N˙ observations from P(Z|θ ∗ ) which we denote as Z1∗ , . . . , ZN∗˙ , we can estimate P(A = 1|θ ) by ˆ = 1|θ ) = 1 P(A N˙
N˙
P(Z ∗j |θ )
j=1
P(Z ∗j |θ ∗ )
∑ P(A = 1|Z ∗j )
.
(11)
As a consequence, the contribution of individual i to the logarithm of the likelihood (5) is, up to a constant, log(P(Zi |θ )) − log(P(A = 1|θ )), and can be approximated by replacing P(A = 1|θ ) by (11), thereby obtaining log(P(Zi |θ )) − log(
1 N˙
N˙
P(Z ∗j |θ )
j=1
P(Z ∗j |θ ∗ )
∑ P(A = 1|Z ∗j )
).
(12)
Since the approximation of the likelihood is expressed in terms of θ an approximation of the information matrix can be computed as minus the second derivative of the log likelihood as usual. 2.2.2 Data augmentation Clayton (2003) derives an ascertainment corrected likelihood by using an analogy to the conditional likelihood for matched case-control data. The idea behind this approach is to simulate a number of ascertained pseudo-observations Zi1 , . . . , ZiN¨ Published by Berkeley Electronic Press, 2010
9
The International Journal of Biostatistics, Vol. 6 [2010], Iss. 1, Art. 23
for each real observation Zi and use these in combination with the real data to build the likelihood. As in the importance sampling method the true parameter values ¨ θ are unknown and are substituted by guesses, θ ∗ . This means that {Zi j }Nj=1 are drawn from P(Zi |θ ∗ , Ai = 1). Given the pseudo-observations the log likelihood contribution of individual i can, up to a constant, be written as ¨ N+1
log(P(Zi |θ )) − log( ∑
j=1
P(Zi j |θ ) ) P(Zi j |θ ∗ )
(13)
where Zi,N+1 = Zi . It is easy to see that (13) equals the log conditional likelihood ¨ contribution of individual i. The reason is that the ascertainment probabilities then cancel out. Clayton shows that the derivative of (13) with respect to θ yields a score function which can be interpreted as a Monte Carlo approximation of the score function obtained from (5). Since an expression for the likelihood is available, parameter estimates can be obtained using Maximum Likelihood. Variances of these estimates are obtained as usual by calculating the information matrix from the likelihood. The likelihood (13) is similar to the likelihood approximated with the importance sampler, (12), especially when ascertainment probabilities are 0/1. The essential differences are that • Data are drawn under ascertainment in (13), using the data augmentation method, while they were drawn from the population distribution in (12), using the importance sampler. • The sum in the second term is over the pseudo-observations only in (12) while the real observation are also included in (13). • In (13) a separate correction term for ascertainment is calculated for each real observation while in (12) P(A = 1) is calculated only once. The last of these differences means that while N˙ pseudo-observations are produced in the importance sampler, for a sample size of nobs real observations, N¨ × nobs pseudo-observations are produced in the data augmentation method.
2.3
Comparison of full and conditional likelihood
In Subsection 2.1 we introduced a new computational approximation of the full likelihood and in Subsection 2.2 we reviewed to approximations of the conditional
http://www.bepress.com/ijb/vol6/iss1/23 DOI: 10.2202/1557-4679.1222
10
Grünewald et al.: A Stochastic EM Type Algorithm for Parameter Estimation
likelihood. It is then of interest to compare the two likelihoods. It follows from (3) that µ obs ¶ ∞ n +m obs naive obs L(θ ; Z ) ∝ L (θ ; Z ) ∑ Qnobs +m (1 − Pθ )m . m m=0 Note that this holds since P(A j = 1|Z j ) is assumed known, and therefore is independent of θ . However, for the particular choice Qn = 1/n adopted in Subsection 2.2, it is possible to show (using e.g. the probability distribution of a negative binomial random variable) that µ obs ¶ ∞ 1 n +m ∑ Qnobs+m m (1 − Pθ )m = nobsPnobs . m=0 θ From (5) we obtain the conclusion L(θ ) ∝ Lcond (θ ).
(14)
That is, when Qn = 1/n, the full and conditional likelihoods are equivalent. Thus our SEM type algorithm can also be viewed as a computational approximation of the conditional likelihood (1.5). However, the equivalence (14) does not hold for general ’priors’ Qn .
3
Examples
To illustrate the performance of the methods described above we will look at two simulated data examples, and one real data example. The simulated data examples are included to allow comparison of the results with true answers. Sensitivity to poorly specified starting values and ascertainment probabilities is investigated. The first simulation example is based on a univariate continuous outcome and the second simulation is based on a more complex example with a multivariate outcome. For this example we found that our method provides valid parameter estimates while the importance sampler and the data augmentation method fail when θ ∗ is poorly specified. Both examples are based on a single explanatory variable X. The simulations are inspired by genetic epidemiology, where non-random ascertainment is widely used for the reason that genetic data have traditionally been more expensive to collect than response variable measurements. In particular the outcomes are thought of as traits representing the metabolic syndrome (Agardh, Ahlbom, Andersson, Efendic, Grill, Hallqvist, Norman, and Ostenson, 2003). The metabolic syndrome comprises many health related outcomes that can affect each other in complex ways. In our simulation studies we represent only simplified models of the metabolic syndrome, using outcome variables only to represent BMI and plasma glucose level. Published by Berkeley Electronic Press, 2010
11
The International Journal of Biostatistics, Vol. 6 [2010], Iss. 1, Art. 23
In the examples ascertainment probabilities are assumed known. In reality, these quantities will usually have to be either estimated from data, or inferred from external sources, adding an extra source of uncertainty that has not been taken into account here. In the second real data example ascertainment probabilities are calculated from age stratified prevalences of Alzheimer’s disease published in Fratiglioni, Grut, Forsell, Viitanen, Grafstrom, Holmen, Ericsson, Backman, Ahlbom, and Winblad (1991).
3.1
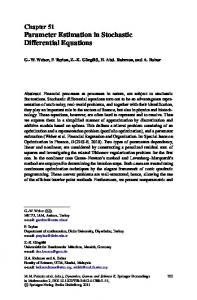
Simulation Model i X(Genotype) → Y (BMI) → A (Ascertainment).
Figure 1: Data structure in simulation Model i. For the first simulation model we use a single categorical covariate, X. The model the genotypes (AA, Aa, aa) , , is based on a genetics example where X = (0 1 2) represents of a single nucleotide polymorphism (SNP) with alleles A and a and a minor allele frequency of exp(β0X )/(1 + exp(β0X )) ≈ 0.2 (β0X = −1.4), so that genotypes AA, Aa and aa have approximate population frequencies 0.64, 0.32 and 0.04. The distribution of the univariate outcome, conditional on X = x is Gaussian 2 with mean √ β0Y + βXY × x and variance σY . We use values β0Y = 24, βXY = 4 and σY = 2, chosen so that Y loosely represents BMI. Individuals with a BMI of 30 or more are defined as obese (as according to the WHO definition). About 10 percent of the Swedish population in the ages of 25-64 have such a BMI according to the WHO MONICA project (Tolonen, Kari, and Ruokokoski, 2000). Ascertainment probabilities are dependent on outcome/phenotype values: P(A|y ≥ 30) = 1, P(A|y < 30) = 0.067, giving approximately equal numbers of obese and non-obese subjects. Sampling is continued until the required total sample size is obtained (we based simulations on sample sizes of 300 and 3000). This sampling procedure is similar to the one used by Gu et al. (2004). The difference is that in our simulation subgroup sample sizes are not fixed, whereas in Gu et al. (2004) they are. In simulating data we generate samples with random subgroup sample sizes, since this corresponds directly to the way the data are analyzed. The asymptotic equivalence of estimators, whether the subgroup sample sizes are regarded as fixed or random, has been discussed by Breslow, Robins, and Wellner (2000) in the case-control setting. The simulation model can be represented graphically as depicted in Figure 1.
http://www.bepress.com/ijb/vol6/iss1/23 DOI: 10.2202/1557-4679.1222
12
Grünewald et al.: A Stochastic EM Type Algorithm for Parameter Estimation
Y1 (BMI) %
&
X (Genotype)
↓ &
A (Ascertainment). %
Y2 (Plasma Glucose) Figure 2: Data structure in simulation Model ii. In this example, due to the simplicity of the model, evaluation of the integral (4) would actually be straightforward.
3.2
Simulation Model ii
In the second simulation we again assume a single categorical covariate, X, representing a SNP genotype. Instead of a single outcome as in Model i, we here use two, Y1 and Y2 , considered to represent BMI and plasma glucose level, respectively. Obesity, measured in terms of BMI, is a co-morbid disease of plasma glucose level; BMI is dependent on genotype and, in turn, affects plasma glucose level. The genotype is assumed to have an additive effect on both outcomes, and Y1 has an additive effect on Y2 . Given X = x, Y1 has distribution N(β0Y1 + βXY1 × x, σY1 ) and Y2 , given X = x and Y1 = y1 has distribution N(β0Y2 + βXY2 × x + βY1Y2 × y1 , σY2 ). Parameter √values are chosen to represent outcomes accordingly; β0Y1 = 24, βXY1 = 4, σY1 = 2, β0Y2 = 3, βXY2 = 1, βY1Y2 = 1/15 and σY2 = 0.5. The ascertainment probability is dependent upon both outcomes, as specified in Table 1. Model ii can be illustrated graphically as in Figure 2.
Y1 < 30 Y1 ≥ 30 Y2 < 7.8 0.1 0.3 Y2 ≥ 7.8 0.3 1 Table 1: Ascertainment probabilities in Model ii.
Published by Berkeley Electronic Press, 2010
13
The International Journal of Biostatistics, Vol. 6 [2010], Iss. 1, Art. 23
Y1 (Aβ 42) % X (ApoE)
↓ &
A (Ascertainment) %
Y2 (AD) Figure 3: Data structure in Alzheimer’s disease data example.
3.3
Alzheimer’s disease data
Prince et al. (2004) examine the relationship between the ApoE gene, levels of Aβ 42 in cerebrospinal fluid (CSF), and Alzheimer’s disease (AD). Allele ε 4 of the ApoE gene is a well-documented risk factor for AD. Several studies have also found reduced levels of Aβ 42 in CSF in AD patients. The relationship between ApoE and Aβ 42 is however less documented. Prince et al. (2004) investigated the relationship in 563 AD patients and 118 healthy controls separately, and reported a statistically significant association between ApoE variants and Aβ 42 levels in both groups. Under an assumption of rare disease, regressing Aβ 42 levels on ApoE genotypes in controls provides approximately unbiased estimates of the effect of ApoE genotypes on Aβ 42 levels in the population. Since, however, there are considerably more cases than controls there will be precision gain from incorporating all subjects in the regression analysis. To do so requires appropriate handling of the ascertainment scheme. Levels of Aβ 42 in cerebrospinal fluid are thought to play a key role in mediating neurodegeneration in Alzheimer’s disease and hence the causal relationship between ApoE variants, Aβ 42 levels, AD and ascertainment is likely to be as depicted in Figure 3, where Y2 = 1 for AD patients and Y2 = 0 for healthy controls. We apply the SEM type algorithm to obtain ascertainment corrected estimates of the effect of ApoE genotypes on Aβ 42 levels in the population, using both controls and cases from the Prince et al. (2004) study. The number of ε 4 alleles is here assumed to have an additive effect on both outcomes, and Y1 has an additive effect on Y2 . Given X = x, Y1 has distribution N(β0Y1 + βXY1 × x, σY1 ) and Y2 , given X = x and Y1 = y1 , has distribution Bin(1, p) where p=
exp(β0Y2 + βXY2 × x + βY1Y2 × y1 ) . 1 + exp(β0Y2 + βXY2 × x + βY1Y2 × y1 )
Ascertainment probabilities are inferred from age specific prevalences of AD (Fratiglioni et al., 1991) to obtain AD expected prevalence in a population with an appropriate age distribution. Due to sparse information on prevalences for young
http://www.bepress.com/ijb/vol6/iss1/23 DOI: 10.2202/1557-4679.1222
14
Grünewald et al.: A Stochastic EM Type Algorithm for Parameter Estimation
subjects our analysis is restricted to subjects 75 years old or older, even though cases as young as 52 years old are available in the Prince et al. (2004) data set. We note that an inverse-probability- of-sampling weighted regression approach has recently been proposed for parameter estimation for the model described above, in the context of a genome-wide association scan for breast density, analysed as a secondary trait from breast cancer case-control samples (Monsees, Tamimi, and Kraft, 2009).
4
Results
All calculations were performed using the software R (The-R-Development-CoreTeam, 2001). In the analysis below N¨ = 50 is used in the data augmentation method and N˙ = 30000 is used in the importance sampler. Clayton (2003) points out that the information loss in the data augmentation method appear to be of the order ¨ N¨ + 1). Gr¨unewald (2004) investigates the choice of N¨ and N˙ in a simulation N/( example similar to Model i described below, and conclude that the statement by Clayton (2003) holds, while the importance sampler needs a larger simulated data size.
4.1
Results for Model i
4.1.1 Parameter estimates and variance estimates when θ ∗ = θ Estimates from the SEM type algorithm, the importance sampler and the data augmentation method using θ ∗ = θ are presented in Table 2, as well as na¨ıve estimates, calculated by optimizing the likelihood of the data without ascertainment correction. Estimates using the method by Zhou et al. (2007) and inverse probabilityweighted (IPW) estimates are also presented in Table 2. The Zhou et al. (2007) estimates and IPW estimates were calculated using code provided by Zhou et al. (2007), which was modified slightly to fit Model i. The Zhou et al. (2007) estimates did not need specification of θ ∗ . Standard errors of the means of the estimates are presented in parentheses. For the SEM type algorithm we calculated the variance estimate of Gilks et al. (1996) based on (10) for each of the 1000 simulations, using K = 5000. The means of these standard errors across the 1000 simulations are presented in Table 3. For comparison standard errors based on observed variability in simulations are also presented. The standard errors by Gilks et al. (1996) appear to estimate this variability well. The standard errors calculated using (10) were
Published by Berkeley Electronic Press, 2010
15
The International Journal of Biostatistics, Vol. 6 [2010], Iss. 1, Art. 23
βˆ0X
True values -1.4
βˆ0Y
24
βˆXY
4
σˆY
p
(2) ≈ 1.41
Naive estimates -0.107 ( 0.0028) 24.426 (0.0044) 4.141 (0.0031) 1.591 (0.0017)
Importance sampling -1.394 (0.0023) 24.006 (0.0039) 3.997 (0.0035) 1.411 (0.0018)
Data augmentation -1.394 (0.0023) 24.004 (0.0039) 3.998 (0.0034) 1.412 (0.0018)
SEM type algorithm -1.393 (0.0022) 24.006 (0.0039) 3.998 (0.0034) 1.410 (0.0017)
Weighted estimates -
Zhou ODS estimates -
24.000 (0.0044) 4.004 (0.0052) -
24.002 (0.0041) 3.998 ( 0.0034 ) -
Table 2: Model i. Comparison of estimates when θ ∗ = θ . Results based on 1000 simulations with nobs = 300, N˙ = 30000, N¨ = 50 and I = 2000. Standard errors are reported in parentheses. also used to construct 95% confidence intervals around the estimates obtained using the SEM type algorithm. The empirical coverage probabilities, based on 1000 simulations, were 0.96, 0.95, 0.95 and 0.95 for β0X , β0Y , βXY and σY respectively.
βˆ0X βˆ0Y βˆXY σˆY
Standard errors based on observed variability in simulations 0.0022 0.0039 0.0034 0.0017
Standard errors calculated using method in Gilks et al. (1996) 0.0023 0.0039 0.0035 0.0017
Table 3: Model i. Comparison of standard errors calculated using method in Gilks et al. (1996) and standard errors reflecting observed variation between simulations. θ ∗ = θ . Standard errors are calculated for mean estimates, based on 1000 simulations with nobs = 300, I = 2000 and K = 5000. The variability of the estimates appear to be similar for all methods except the IPW estimates, for which standard errors were larger. It is worth noting that the Gilks et al. (1996) method of calculating standard errors does not take into account the chain length of the SEM, so it is advisable to run a long chain to avoid variability that is unaccounted for. The chain length, I, in Model i was 2000. Except na¨ıve estimates, all methods compared provide estimates which are appropriately corrected for ascertainment. The bias in the na¨ıve estimates was not very large in this specific example.
http://www.bepress.com/ijb/vol6/iss1/23 DOI: 10.2202/1557-4679.1222
16
Grünewald et al.: A Stochastic EM Type Algorithm for Parameter Estimation
4.1.2 Parameter estimation when θ ∗ is poorly specified To investigate the behavior of the simulation based methods under poorly specified ∗ = 0 and 2, while remaining starting values were θ ∗ simulations were run for βXY specified as their true parameter value counterparts. We first used sample sizes of 300. The running time of the SEM type algorithm was longer when θ ∗ was misspecified, to allow for convergence. As for Markov Chain Monte Carlo simulations, an appropriate burn in period has to be identified. When the algorithm has converged to a distribution around the parameter estimates, the standard errors of the estimates after burn in are the same as for correctly specified starting values. In our simulations the SEM type algorithm always converged and gave the same parameter estimates for poorly specified θ ∗ as for correctly specified θ ∗ , presented in Table 2. When the data augmentation method was run with poorly specified θ ∗ parameter estimates were unbiased but had large standard errors, as can be seen in Table 4. As Clayton (2003) suggests, running a moderate amount of iterations of the data augmentation method improves the performance when θ ∗ is poorly specified. That is, the standard error estimates become smaller, approaching values that would be obtained if true/population parameter values were used as starting values. In Table 4 parameter estimates and standard errors of mean estimates for the importance sampler are presented. The importance sampler yields incorrect ∗ = 2 the mean estimate of βˆ parameter estimates. For example, when βXY 0X was −1.164, with a standard error of 0.0091; for a true value of −1.4. The highly de∗ = 0 were mainly driven by the results in four of the 1000 viant results when βXY simulations. The inflation of the standard errors appears to be more pronounced in the importance sampler than in the data augmentation method. Since the importance sampler estimator is claimed to be unbiased it may seem surprising that the parameter estimates in the example are biased. A condition for the importance sampler is that the sampling distribution f2 should be positive whenever g f1 > 0. This condition is fulfilled in the simulations above, but when θ ∗ is misspecified f2 may be so small in some regions where g f1 is large, that no observations are actually sampled. The performance of the method may be improved by a better choice of sampling distribution, for example by using a mixture distribution (Hesterberg, 1995), or by iterating the choice of θ ∗ .
Published by Berkeley Electronic Press, 2010
17
The International Journal of Biostatistics, Vol. 6 [2010], Iss. 1, Art. 23 True
βˆ0X
-1.4
βˆ0Y
24
βˆXY
4
σˆY
p
(2) ≈ 1.41
∗ =β βXY XY
= 4——
∗ =2 βXY
DA 1.394 (0.0023) 24.004 (0.0039) 3.998 (0.0034) 1.412 (0.0018)
IS -1.394 (0.0023 ) 24.006 (0.0039) 3.997 (0.0035) 1.411 (0.0018)
DA -1.386 (0.0028) 24.001 (0.0043) 4.008 (0.0046) 1.411 (0.0021)
∗ =0 βXY
IS -1.164 (0.0091) 23.838 (0.0072) 4.316 (0.0122) 1.41 (0.0051)
DA -1.320 (0.0102) 24.002 (0.0046) 4.079 (0.0132) 1.409 (0.0029)
IS 4.15 (0.1222 ) 36877.65 (29518.79 ) -52721.59 (36968.86 ) 41888.25 (25869.27)
Table 4: Model i. Data augmentation method (DA) and importance sampling (IS) ∗ misspecified, and the remaining parameters at ideal starting values. Rewith βXY sults based on 1000 simulations with nobs = 300, N¨ = 50 and N˙ = 30000. Standard errors for mean estimates are reported in parentheses. 4.1.3
Incorrect specification of ascertainment probabilities
A simulation study was performed to investigate the effect of incorrect specification of ascertainment probabilities in the SEM type algorithm. Parameter estimates were calculated for different incorrect values Passumed (A|y < 30). For these simulations we used a sample size of 3000. The algorithm was run for 500 steps after a burn in of 50 steps. Results are summarized in Figure 4. The dashed lines represent naive estimates, Passumed (A|y < 30) = 1, and the solid line is drawn at the correct parameter value. In this specific example estimates differed the most from true parameter values at Passumed (A|y < 30) = 1. 4.1.4
Incorrect specification of error term distribution
In Model i we assume the error terms of Y to be Gaussian. There are multiple ways in which the error terms may be misspecified. We performed a simulation study investigating one type of misspecification, where the true error terms is a mixture of two Gaussian distributions with different variances. X was generated as in Model i and Y |X was generated as follows: on X = x and s, Y has mean β0Y + p conditional 2 2 βXY × x and variance σ |s = ( (2) × s) where s is stochastic with distribution P(s = 1) = 0.5 and P(s = 6) = 0.5. We simulated data with βXY = (1, 2, 3, 4, 5, 6, 7). We used ascertainment probabilities P(A|y < 30) = 0.2 and P(A|y ≥ 30) = 1, and
http://www.bepress.com/ijb/vol6/iss1/23 DOI: 10.2202/1557-4679.1222
18
Grünewald et al.: A Stochastic EM Type Algorithm for Parameter Estimation
^ βOY
24.2 24.0 23.8
Estimate
−2.0 −1.5 −1.0 −0.5
Estimate
24.4
^ βOX
0.0
0.2 P
0.4
0.6
0.8
1.0
0.0
assumed
0.2
0.4
(A|y