ISSN: 2224-0616 Int. J. Agril. Res. Innov. & Tech. 5 (1): 1-9, June, 2015
Available online at http://www.ijarit.webs.com
A STUDY OF SPATIAL AND TEMPORAL DISTRIBUTION OF LAND UTILIZATION PATTERN IN MOPKA VILLAGE USING RS & GIS Soni Prasoon1* and Singh Pushpraj 2 Received 21 January 2015, Revised 17 April 2015, Accepted 26 June 2015, Published online 30 June 2015
Abstract Remote Sensing and GIS is a very good modality for retrospection and the strategy for better exploitation of sustainable land use system. The present study was conducted in the Bilaspur district for analyzing the spatial distribution of Land Use Change. During last decades the increasing population of Bilaspur city, affect the land use pattern of Mopka Village. The anthropogenic activities were affecting the agricultural land along with barren land. For the development of civic amenities the land of the above village was used. The main objective of the present study is to analyses the land use/land cover distribution in Mopka village, Bilaspur district in between last 12 years and to identify the main forces behind the changes. The objectives of present studies are, to create a land use land cover maps of Mopka village using satellite imagery. To analysis the temporal changes of village area in between the year 2000 and 2012, the primary, secondary and satellite data were used. The results of the present study show that the decadeial changes due to population growth and increasing demand of infrastructure were destroying the natural resources, natural habitat and soil structure of area. Keywords: RS-Remote Sensing, GIS–Geographical Information System, LULC-Land Use and Land Cover 1
Research Scholar, Department of Rural Technology and Social Development, Guru Ghasidas Vishwvidyalaya, Koni, Bilaspur Chhattisgarh, India 2 Associate Professor, Department of Rural Technology and Social Development, Guru Ghasidas Vishwvidyalaya, Koni, Bilaspur Chhattisgarh, India
*Corresponding author’s email:
[email protected] (S. Prasoon)
Introduction Land cover refers to the physical and biological cover over the earth surface, including water, vegetation, bare soil, wet land, snow/ice and artificial structures. Land cover patterns reflect the underlying natural and social processes, thus providing essential information for modeling and understanding many phenomena on the earth, including climate change, ecosystem, hydrologic, atmospheric models and the complex interactions between human activities and global change (Bounoua et al., 2002; Gong et al.,2013). Increasing demands and needs from a growing human population have resulted in the widespread use and rapid conversion of most natural land-cover types to agriculture. This conversion trend, slowed down in recent decades because of the intensification of agricultural practices resulting in increased crop yields from fertilizer and pesticide use (Tilman et al., 2002). Land cover classification using time series remote sensing data are usually focus on coarser spatial resolution data, whereas finer resolution land cover products are usually obtained from classification of single or fewer temporal, spatial resolution remote sensing data (Gong et al., 2013). To measure and detect such changes,
numerous approaches that use remote sensing tools are available (Coppin et al., 2004). The main issue comes how to extract temporal information from time series coarser resolution remote sensing data to improve land cover classification accuracy of finer resolution of single or fewer temporal remote sensing data. Using observation from multiple sensors with different characteristics is considered as a feasible way to solve the problem. Several fusion methods have been developed to generate high temporal resolution (Land sat image), like surface reflectance data (Gao et al., 2006). Land degradation can be investigated in different ways, such as direct field observation and remote sensing. In comparison to field methods, the remote sensing technique is more cost-effective and time-efficient in which a huge land area can be monitored using one image. A large number of studies have been carried out using different methods of RS and GIS to determine land degradation risk. Remotely sensed imagery is appropriate for revealing land that has been affected by degradation to various levels (Gao and Liu, 2008).
1
Prasoon and Pushpraj (2015) Spatial and temporal distribution of land in mopka village using RS & GIS
As per the historical records of the present study area, were as the Imperial Gazetteer of India, Vol. 8, 1908 note that the city (Bilaspur) is said to be named after a fisherwoman named Bilasa in the 17th century; and for a long period Bilaspur consisted of only a few fishermen’s huts. In 1901, Bilaspur’s population was 18,937 and it was the eighth largest city in the Central Provinces of British India. In 1908, the weaving of tasar silk and cotton clothes was recorded as the major industries of Bilaspur. Historically, Bilaspur was a part of the Kalchuri Dynasty of Ratanpur. However, it came into prominence around 1741, the year of the Maratha Empire invasion, when a Maratha official took up abode there and began to build a fort. The city was taken over by the British East India Company of Great Britain in the year 1854 when the then ruler of the region of the Maratha kingdom died heirless. The Railways arrived at Bilaspur in the decade of 1880-90, with the arrival of the Bengal- Nagpur Railway. Bilaspur city is located in central part of INDIA and south-eastern part of Chhattisgarh and covers an area of about 6377 sqkm. Bilaspur falls within latitude 21037˝ to 23007˝ and longitude 81012˝ to83040˝ and it is situated at confluence
of the Arpa River. The total population of Bilaspur district as per 2011 census is 2662077 with population density 322/sqkm, person comprising 1349928 male and 1312149 female and total literacy rate 71.59% comprising 82.77%male and 60.12% female. Earlier Mopka village is located very near to Bilaspur city. Total population of Mopka village as pre 2011 census 10037, person comprising 5005 male and 5032 female. During last decades the increasing population of Bilaspur city, affect the land use pattern of Mopka village. The anthropogenic activities were affecting the agricultural land along with barren land. For the development of civic amenities, the land of the above village was used. The main objective of the present study is to analyses the land use/land cover distribution in Mopka village, Bilaspur district during last 10 years and to identify the main forces behind the changes. The objectives of present studies is to create a land use land cover map of Mopka village through the satellite imagery of different time series data through the use of primary, secondary and satellite data, analysis the temporal changes in village area in between the year 2001 and 2012
Materials and Methods
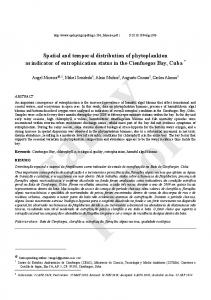
Fig. 1. Location map of study area of Mopka
Int. J. Agril. Res. Innov. & Tech. 5 (1): 1-9, June, 2015
2
Prasoon and Pushpraj (2015) Spatial and temporal distribution of land in mopka village using RS & GIS
Flow Chart of the methodology used for the present study
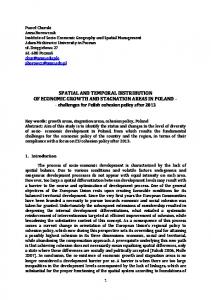
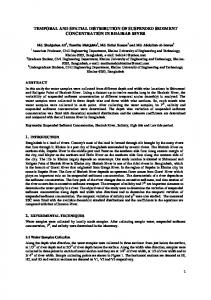
Data used In the present study the IRS -Satellite RESOURCESAT 2, data of year 2012 purchased from National Remote Sensing Sensor, Hyderabad, India is used for land use analysis. The satellite images consist of three spectral bands with a spatial resolution of 5.8 meter. Land sat satellite data of period 2000 is also use for temporal analysis. The path and row of the used Land sat satellite image was 142 and 44. Used image projection type were UTM, zone 44
and Datum name is WGS 84. Both of the show of the same area and what spatial changes are occur in between year 2000 and year 2012 was measured with the help of ERDAS and ESRI Software. Various software techniques like NDVI, VCI and reflectance curve were used for change detection analysis. The village boundary data was collected through the data provided by Survey of India, Dehradun.
Int. J. Agril. Res. Innov. & Tech. 5 (1): 1-9, June, 2015
3
Prasoon and Pushpraj (2015) Spatial and temporal distribution of land in mopka village using RS & GIS
Fig. 2a. LAND SAT ETM+ image of year 2000 of Mopka village
Int. J. Agril. Res. Innov. & Tech. 5 (1): 1-9, June, 2015
4
Prasoon and Pushpraj (2015) Spatial and temporal distribution of land in mopka village using RS & GIS
Fig. 2b. Resource Sat image of year 2012 of Mopka village
Int. J. Agril. Res. Innov. & Tech. 5 (1): 1-9, June, 2015
5
Prasoon and Pushpraj (2015) Spatial and temporal distribution of land in mopka village using RS & GIS
Table 1. Population data of Mopka village Year 2001 2011
Total population 7286 10037
Male population 3739 5005
Female population 3547 5032
Number of house hold 1344 2160
Results and Discussion First we studies about the geographical area and population density in Mopka village. It has been found in the study that the total area covered under Mopka village is 12.26 sq. km. It has been found that in the year 2001 the total population were 7286 which has been increased up to in 2011, 10037. The population increase 1.37 time which is the major cause for population conjunction and improper management of land in the Mopka village. It has been found that there are 7 categories of land viz. crop land, industrial land; canals, forest land, grass land, pond, and residential land were change in between twelve year. Similar trends was found by Tiwari and Singh (2014) and Niyaj and Singh (2014).
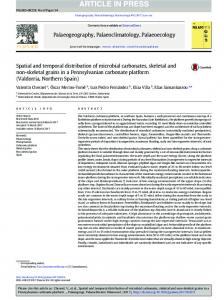
The data in table 2 is clearly indicating the land use and land cover distribution shows the change in last decade. The increasing trends were found in the categories of residential land 2.85 sq. km. and industrial land 1.82 sq. km. The data reveals that grass land is decreased about 1.09 sq. km., crop land is decreased 2.4 and 1.17 sq. km. area decreased of forest land. The increasing pattern of industrialization demand more land for establishment of factories and other infrastructure. In addition, population growth, increase the land demand for residential purpose and it grass land, crop lands. The forest area was reducing because of land demand for industrial sector and new housing area development.
Table 2. Land use and land cover distribution of Mopka village Land use and land cover categories Crop land Industrial land Canals Forest cover Grass land Pond Residential land Total area
Land area in year 2012 (in sq. km.) 1.25 2.3 1.3 1.09 1.09 1.15 4.08 12.26
Land area in year 2000 (in sq. km.) 3.65 0.48 1.33 2.26 2.18 1.13 1.23 12.26
Int. J. Agril. Res. Innov. & Tech. 5 (1): 1-9, June, 2015
Changes in between the year (2000-2012) -2.4 +1.82 -0.03 -1.17 -1.09 +0.02 +2.85
6
Prasoon and Pushpraj (2015) Spatial and temporal distribution of land in mopka village using RS & GIS
Fig. 3a. Land use map of Mopka village in year 2001
Int. J. Agril. Res. Innov. & Tech. 5 (1): 1-9, June, 2015
7
Prasoon and Pushpraj (2015) Spatial and temporal distribution of land in mopka village using RS & GIS
Fig. 3b. Land use map of Mopka village in year 2012
Int. J. Agril. Res. Innov. & Tech. 5 (1): 1-9, June, 2015
8
Prasoon and Pushpraj (2015) Spatial and temporal distribution of land in mopka village using RS & GIS
Conclusion In LULC, changes of Mopka village were measured through the satellite imageries of year 2000 and 2012 of the particular area. The major changes in residential area and it increases 2.85 sq. km. within 2000 to 2012. The major down fall in Grass land 1.09 sq. km. and crop land 2.4 sq. km. The data shows that the Grass land and Crop land area of Mopka village is converted in residential and industrial land. The under taken study area village Mopka has been flourished and identified with upcoming small scale industries in last12 year. During last ten year major changes were found in two categories, grass land and crop land which is converted to industrial and residential area. But due to this human foot print invasion the area has been modify in its natural structure, destroying the natural habitat and soil structure. The land use land cover (LULC) of the village show the decreasing trend in soil productivity and water availability.
References Bounoua, L., DeFries, R., Collatz, G.J., Sellers, P. and Khan, H. 2002. Effects of land cover conversion on surface climate. Climatic Change 52: 29–64. Coppin, P., Jonckheere, I., Nackaerts, K., Muys, B. and Lambin, E. 2004. Review article digital change detection methods in ecosystem monitoring: a review. Int. J. Remote Sens. 25: 1565- 1596.
Gao, F., Masek, J., Schwaller, M. and Hall, F. 2006. On the blending of the Land sat and MODIS surface reflectance: predicting daily Land sat surface reflectance. IEEE Trans. Geosci. Remote Sens. 44: 2207–2218. Gao, J. and Liu, Y., 2008. Mapping of land degradation from space: a comparative study of Land sat ETM+ and ASTER data. Int. J. Remote Sens. 29 (14): 4029–4043. Gong, P., Wang, J., Yu, L., Zhao, Y.C., Zhao, Y.Y., Liang, L., Niu, Z.G., Huang, X.M., Fu, H.H., Liu, S., Li, C.C., Li, X.Y., Fu, W., Liu, C.X., Xu, Y., Wang, X.Y., Cheng, Q., Hu, L.Y., Yao, W.B., Zhang, H., Zhu, P., Zhao, Z.Y., Zhang, H.Y., Zheng, Y.M., Ji, L.Y., Zhang, Y.W., Chen, H., Yan, A., Guo, J.H., Wang, L., Liu, X.J., Shi, T.T., Zhu, M.H.,Chen, Y.L., Yang, G.W., Tang, P., Xu, B., Giri, C., Clinton, N., Zhu, Z.L., Chen, J. and Chen, J. 2013. Finer resolution observation and monitoring of global land cover: first mapping results with Land sat TM and ETM+ data. Int. J. Remote Sens. 34: 2607–2654. Niyaj, A. and Singh, P. 2014. Change detection analysis of forest area of Kenda village of Kota Block, Bilaspur, Chhattisgarh. Int. J. Res. in Advent Tech. 2(2): 348-353. Tilman, D., Cassman, K.G., Matson, P.A., Naylor, R. and Polasky, S. 2002. Agricultural sustainability and intensive production practices. Nature 418: 671-677. Tiwari, N. and Singh, P.R. 2014. Measurement of forest and satellite changes in tribal village of Bilaspur district through RS and GIS. Int. J. Engg. Res. & Sport Sci. 1(10): 16-19.
Int. J. Agril. Res. Innov. & Tech. 5 (1): 1-9, June, 2015
9