Association for Information Systems
AIS Electronic Library (AISeL) ECIS 2011 Proceedings
European Conference on Information Systems (ECIS)
10-6-2011
A SYSTEMIZING RESEARCH FRAMEWORK FOR WEB 2.0 Dennis M. Steininger
[email protected]
Jan Huntgeburth Daniel Veit
Follow this and additional works at: http://aisel.aisnet.org/ecis2011 Recommended Citation Steininger, Dennis M.; Huntgeburth, Jan; and Veit, Daniel, "A SYSTEMIZING RESEARCH FRAMEWORK FOR WEB 2.0" (2011). ECIS 2011 Proceedings. Paper 255. http://aisel.aisnet.org/ecis2011/255
This material is brought to you by the European Conference on Information Systems (ECIS) at AIS Electronic Library (AISeL). It has been accepted for inclusion in ECIS 2011 Proceedings by an authorized administrator of AIS Electronic Library (AISeL). For more information, please contact
[email protected].
A SYSTEMIZING RESEARCH FRAMEWORK FOR WEB 2.0
Steininger, Dennis M., University of Mannheim, Schloss, 68131 Mannheim, Germany,
[email protected] Huntgeburth, Jan C., University of Mannheim, Schloss, 68131 Mannheim, Germany,
[email protected] Veit, Daniel J., University of Mannheim, Schloss, 68131 Mannheim, Germany,
[email protected]
Abstract Web 2.0 has recently been one of the most discussed topics in Information Systems science and practice. However, little consensus is found on what its components and characteristics actually are and what a comprehensive conceptualization might look like. This paper tries to shed light on these questions by systemizing the phenomenon’s characteristics in a hierarchical framework. In a first step, we apply content and cluster analysis on contributions of the field and inductively identify 103 raw categories which are then clustered into ten subcategories and two main categories. Namely these identified main categories of Web 2.0 are: ‘Technological Characteristics’ and ‘Socioeconomic Characteristics’. In a second step, we pretest and optimize the constructs for applicability and ambiguities and finally apply them to evaluate on the importance and weighting of the discovered subcategories. The resulting framework is found to comply with common quality measures for content analysis and classification schemes. It can be used to analyze and explore economic or social phenomena associated with Web 2.0 in a systematic manner. Keywords: Web 2.0, Social, Framework, Model, Categories, Characteristics, Conceptualization.
1
Introduction
The term „Web 2.0‟ was popularized after the publisher O‟Reilly organized a conference with the corresponding name for the first time in 2004 which built groundwork and had a tremendous impact on the topic by giving examples of applications and their basic attributes. After this event O‟Reilly (2007) published today‟s most cited article on the subject using its presentations and definitions from the conference. It bases on comparative examples and applications of Web 1.0 and Web 2.0 to explain and define the phenomenon of the latter. These encompass a rather unstructured and blurry mix of concrete examples like „DoubleClick‟ being Web 1.0 compared to „Google AdSense‟ which is seen to be Web 2.0 but also generic examples such as „personal websites‟ versus the newer „blogging‟. This list is completed by contrasting applications like „content management systems‟ with „wikis‟ and common principles such as „publishing‟ with „participation‟. Along these examples O‟Reilly develops and explains his rather technical principles that range from characterizing Web 2.0 as “services, not packaged software” (O‟Reilly, 2007, p. 35) to illuminating its “lightweight user interfaces” (ibidem) and interoperable Web Services. Nevertheless, at a recent interdisciplinary meeting we had a discussion with scholars of management and political science. They bewailed missing comprehensive systemizations of these blurry Web 2.0 principles troubling them to study impacts within their disciplines. This statement is also complemented by Hendler and Goldbeck (2008) arguing that there still is no common definition of what exactly Web 2.0 characteristics are although it has been one of the most discussed topics in current publications regarding the Internet. Many different uses and definitions are leaving a blurry picture of the entire subject making academic research on the topic rather difficult. Concluding on these issues and despite its incredible success in practice, Ganesh and Padmanabhuni (2007) emphasize that a framework to entirely conceptualize and understand the phenomenon is desperately needed. The statements above build groundwork for the research objectives of this paper by raising questions on what Web 2.0 and its important components actually are and how they can be conceptualized for further research. We collect 254 contributing articles on the topic and conduct a content and cluster analysis to tackle these objectives striving to build a systemizing framework which can be applied to explore economic or social phenomena associated with the topic. We organize the remainder of this paper as follows: the next chapter briefly outlines the Web 2.0 phenomenon. This groundwork is succeeded by sections on the research methodology with its operationalizations and measures of reliability, the presentation of the resulting framework and the discussion of these results in the light of quality measures for classification schemes and associated limitations.
2
Web 2.0
Within O‟Reilly‟s (2007) paper introduced above there are almost no hints found on interaction through social networks even though this is one of the topics mentioned most regularly in association with Web 2.0 today encompassing many of his principles. Hence, large parts of scholarly research work have recently gathered around social network sites evaluating on their influences and benefits (e.g. Hiltz et al., 2007). Social network sites are defined as “web-based services that allow individuals to (1) construct a public or semi-public profile within a bounded system, (2) articulate a list of other users with whom they share a connection, and (3) view and traverse their list of connections and those made by others within the system” (boyd and Ellison, 2008, p. 211). As suggested by their name, they show „network effects‟ meaning that they gain value with increasing numbers of users. These networks enable social interactions, rapid spreading of user experiences (e.g. on products) and worldviews, sharing of content (e.g. videos) or knowledge, collaborative work over a distance (e.g. within open source development communities) and the disclosure of personal information such as age,
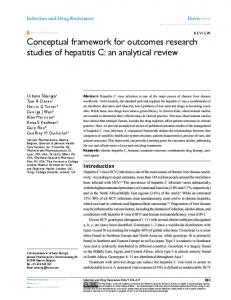
education, pictures or interests (Wasko and Faraj, 2005). The latter is rapidly attracting practice and research since it is a perfect resource for personalized marketing campaigns but also massively raises questions concerning misuse of disclosed information and privacy protection. Web 2.0 providers are responding to growing privacy concerns by handing over power of data control to users which might lead to reduction in users‟ interconnections or comfort, decreased ease of content sharing and collaboration. It also might preclude possibilities for firms to gain profits or inform potential customers in a targeted way particularly endangering new Web 2.0 startups which often heavily rely on advertising revenues or don‟t even have business models (e.g. Twitter) but only users yet. These challenges are approached in research by developing comprehensive tools for privacy engineering (Spiekermann and Cranor, 2009). Starting to systemize the aforementioned groundwork and extending it by economic perspectives, Baechle (2008) identifies two superordinate dimensions of Web 2.0 which he explains along the business cycle of a product from generating the idea to after sales services (cf. Figure 1). The first dimension depicted at the figure‟s bottom is of technology-oriented nature and congruently to O‟Reilly‟s work only encompasses a set of examples such as RSS, Ajax or Web Services without further systemization. The second user-oriented dimension depicted within the upper half of the image adds some systemization by abstracting from concrete examples onto concepts. Hence, the concept of „open innovation‟ is introduced as a Web 2.0 principle usable for the new product development process until market launch. It is defined as opening up the innovation process of a firm to different sources of ideas and innovation inside and outside the boundaries of a firm (Chesbrough, 2006).
Figure 1.
The Two Different Dimensions of Web 2.0 (adapted from: Baechle (2008))
Leaving a product‟s or service‟s new development phase further following the business cycle, Baechle (2008) suggests „social commerce‟ as a Web 2.0 principle for the succeeding steps after the market launch of a product or service. This concept is rooted to the „Cluetrain Manifesto‟, which defines markets as social interactions and communications shifting the power away from firms resulting in consumers taking over parts of marketing, product customization or even parts of production using Web 2.0 applications (Locke et al., 2000). Singh et al. (2010) emphasize these possibilities of integrating and servicing customers more closely through using Web 2.0 technologies. Firms making extensive use of open innovation and social commerce as Web 2.0 principles are called „enterprises 2.0‟ by Baechle. Nevertheless, significant numbers of these enterprises often solely relying on the principles mentioned above are struggling to find sources of revenue particularly beyond advertising (e.g. Twitter). This might be caused by rapidly user numbers incurring high server costs combined with missing business models but also due to the high interoperability with other services that quickly create even more attractive mash-ups (Clemons, 2009).
3
Research Methodology
3.1
The Content Analysis Process as an Outline
Content analysis is a scientific research technique to gain “replicable and valid inferences from text” (Krippendorff, 2004a, p. 18) materials and thereby find values, trends, characteristics, patterns or concepts. Types of text material can include written (e.g. manuals, newspapers, journals) or spoken texts (speeches, interviews) as transcripts (Morris, 1994). Reportedly content analysis found its first broad application during World War II when scientists of the allies successfully calculated sizes of troops by analyzing German local newspaper reports about killed soldiers (Krippendorff, 2004a). Since then, the technique has found widespread use within the social sciences. Demands for more qualitative research to gain richer data (e.g. Duriau et al., 2007; Lacity and Janson, 1994) also fostered its use in traditionally positivistic and quantitatively oriented disciplines like IS or management science (Insch et al., 1997). This spreading might have also been supported due to content analysis‟ position at the intersection of quantitative and qualitative approaches (Gephart, 1993) often resulting in outcomes that can be analyzed using quantitative measures such as t-tests or Pearson correlations (Kassarjian, 1977). Objectivity, reproducibility, validity and reliability of these outcomes are obtained through rigorous rules and systematic procedures, which have been refined and adapted to the various needs of different disciplines over time (e.g. Abbasi and Chen, 2008; Angelmar and Stern, 1978) and distinguish content analysis from regular critical reading. The aforementioned potential of this methodology in uncovering characteristics and patterns is of high value regarding the research objectives of this study and therefore used to elaborate on Web 2.0 and systemize the outcomes.
3.2
Implementation of Inductive Content Analysis Procedures
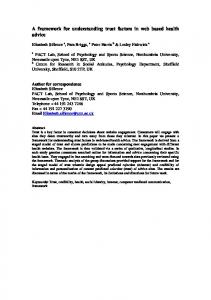
The overall approach of this study was inspired by the work of Nag et al. (2007) defining strategic management via an inductive approach and clustering. Operationalizations are derived by following main contributions of the methodological fields. Hence, we adapt commonly suggested procedures and steps of inductive content analysis for this study and depict them in Figure 2. Methodologists tend to see the identification of the research question as the first step of content analysis, arguing that „fishing‟ in textual materials without a well-defined focus will not lead to results of scientific value (Mintzberg, 1979). It was introduced in the first chapter of this paper. Most articles on content analysis do not provide much guidance on the procedure of research material collection and selection which is particularly surprising since it is a source of bias with high potential in such a research process (Insch et al., 1997). Consequently, Hassan and Mathiassen (2009) propose a broad, transparent and combined approach of citation (scientometrics) and content analysis particularly for theory building IS research which we adapt for this paper. The research material was selected and queried in August 2010.1 Resulting lists with a total of 254 articles are limited to the publication date between the 1st of January 2005 and the 31st of July 2010 to ensure stable results and due to the term of “Web 2.0” rooting to the year 2005. Following Eisenhardt‟s (1989) suggestions on sampling a selection factor (SF) that adjusts the accuracy of finding broad high impact articles (i.e. articles that build theory and define Web 2.0) is computed and added by using and documenting disambiguous rules. The lists are sorted in descending order by the selection factor. After research material collection we specify the unit of analysis in a third step. It is “the basic unit of text [e.g. word or paragraph] to be classified” (Insch et al., 1997, p. 10) into the categories derived in subsequent steps. The configuration of this unit has a considerable impact on
1
The queries are carried out on the databases of EBSCO, ProQuest and Science Direct. Only title, abstract and keywords of articles are queried. The search term “web 2.0” is used for the queries.
quality and reliability of the research results. Choosing a smaller unit (e.g. word) usually leads to higher reliability but might corrode research results which focus on larger meanings than transported by single words (Saris-Gallhofer et al., 1978). Following Kassarjian (1977), the „theme‟ is used in this study ensuring the capturing of word or sentence-spanning ideas especially within the inductive phase of category building. To stabilize the results and reliabilities, entire sentences are used as the operationalized coding unit, which leads to only coding a category once within one sentence.
Figure 2.
Steps of the Inductive Content Analysis Process Constructed from: (Insch et al., 1997; Mayring, 2000; Morris, 1994)
A content analytical core component is the categorization of the aforementioned units. This process is typically referred to as „coding‟ (Scott, 1955). Coding requires a system of categories, which might be derived either through theory and the use of existing systems or inductively out of research materials which leads to results already useful for answering research questions. We adopt the latter within this paper to tie the categories as closely as possible to the research material and thereby systemize the characteristics and patterns of Web 2.0. Within this inductive approach raw category building rules are formulated in the fourth step of Figure 2. In a fifth step the raw categories are derived from the research material (starting with the highest ranked article) based on the raw category building rules. Raw categories are found and collected through reading and marking parts within entire papers that give insights on characteristics of Web 2.0. This process is repeated until no new raw categories can be derived (i.e. saturation) from the research material (cf. Mayring, 2000). The 103 raw categories are systemized and reduced to the category scheme using a proximity matrix and cluster analysis in subsequent steps. This scheme is finalized with category numbers, definitions, rules for coding and „anchor examples‟ (i.e. text examples which would have to be assigned to the respective category during a coding process).
3.3
Categorization Pretests and Measures of Reliability
The inductively constructed category scheme of Web 2.0 (also referred to as coding scheme) is used for an extensive training of coders in the sixth step iterated with adjustments to the scheme shown by the cycled lines (from 6 to 5) in Figure 2. Another independent coder is employed besides the author to ensure stable results and calculate intercoder reliabilities. Following Veit and Parasie (2010), this coder is trained in a one day workshop by the author using non-selected articles from the remaining material lists. The coding scheme and rules are adjusted through discussion of the non-matching codings. This procedure is repeated with a different article until the agreement (reliability) of both coders is calculated above 0.8 (cf. Moore, 2000). These reliabilities are calculated using Holstis‟
(1969) CR percent agreement. After the training the categorization is pretested using another two articles for quality and unambiguousness as suggested by Pavlou and Dimoka (2006). Formative reliability measures are calculated after the pretesting of each article. Coding scheme and rules are adjusted accordingly if reasonable. This ensures an extensive, clear and stable coding scheme and therefore intersubjectively comprehensible results. The coding is continued for remaining research articles. As suggested by Krippendorff (2004b), this process is concluded by the calculation of summative intercoder reliabilities (also referred to as reproducibility) for the entire codings. There is no common absolute number of these coder agreements which is found to be satisfactory in the academic discussion on reliabilities. This is due to large differences especially in the units of analysis but also in category systems, complexity of the evaluated contents and coder experience. Nevertheless, Mayring (2000) proposes a reliability of at least 0.7 for acceptable results in qualitative content analysis. Frueh (2007) gives a range of 0.75 to 0.85 as reachable with well defined coding rules and categories for the „theme‟ as the unit of analysis. The overall reliability calculated for this work results in 0.83 of coder agreements. Frueh (2007) proposes to further split reliabilities by categories, which is shown in Table 1. The results are based on 3 698 codings. Slightly lower numbers of the technological main category might be rooted in coders differing knowledge due to the second coder having a nontechnical sociological business education background. These educational differences might also be considered when evaluating on the reasons for the socioeconomic subcategory with low agreements (C23 „Network Externalities‟)2. Further specifications within the scheme might increase reliabilities. Desc./Category
C10
C11 C12 C13 C14 C20
Codings of Coder 1
557
90
192
152
123
1 286 459
384
25
122
157
139
1 843
Codings of Coder 2
563
95
211
150
107
1 292 460
397
30
143
135
127
1 855
Matching Codings
451
70
168
118
95
1 089 395
332
20
109
123
110
1 540
Reliabilities
0.81
0.76 0.83 0.78 0.83 0.84
Table 1.
C21 C22 C23 C24 C25 C26 Total
0.86 0.85 0.73 0.82 0.84 0.83 0.83
Overview on Reliabilities by Category
4
Research Results
4.1
A Systemizing Category Scheme of Web 2.0
A total of 103 raw category examples for Web 2.0 is generated until saturation from an extensive set of research material with 153 pages and 69 585 words during the category development phase. Using SPSS, the raw categories are then clustered and reduced to the category scheme of Web 2.0 presented in Table 2. There are two main categories found encompassing four and six subcategories. Each subcategory is amended with the most representative examples from its constituting texts. The first main category C10 shows rather technologic elements and is built on four subcategories. First of which is found to be characterized by „Scalable On-Demand Service and Production‟. This describes a relocation of software, applications and services from local computers onto scalable resources of the web combined with continuous delivery and improvement. Secondly, the Subcategory of „Interoperability‟ contains examples about open standards, which allow the connection of services and firms making it easy to build own services or products based on foreign resources and services. The third subcategory of „Data and Data Control‟ focuses on examples showing the importance of data as an enabler for individualization but also on data sharing and control by users. While the last and 2
This subcategory also shows the least distance to the technological main category cluster during cluster analysis with SPSS.
fourth subcategory „Ease of Use‟ is based on examples of technological advances allowing rich user experiences accompanied by more intuitive and responsive user interaction giving the Web a „desktoplike‟ feeling. TECHNOLOGICAL CHARACTERISTICS (C10) Name of Subcategory
Representative Examples
Scalable On-Demand Service and Production (C11)
“on-demand service and production” (wb1.30) “perpetual, never ending beta” (wb3.1)
Interoperability (C12)
“combination or use of existing services to offer new ones which are called mash ups” (wb1.21) “data integration“ (wb5.6)
Data and Data Control (C13)
“sharing of personal information” (wb8.1) “control over unique and hard-to-recreate data sources” (wb8.12)
Ease of Use (C14)
“desktop-like quality” (wb1.15) “high user interaction with technology” (wb2.1)
SOCIOECONOMIC CHARACTERISTICS (C20) Name of Subcategory
Representative Examples
User and Customer Integration (C21)
“user-generated content, creativity, innovation and revenue” (wb6.7) “customers as key »input« to production” (wb6.9)
Social Interaction (C22)
“social networks or communities” (wb4.5) “social computing, social software” (wb5.5)
Network Externalities (C23)
“the more participate the more value a product or service gains” (wb6.8) “has network effects and externalities” (wb1.13)
Individualization (C24)
“leveraging the long tail” (wb1.19) “highly individualized products and services” (wb9.1)
Trust in the Wisdom of the Crowd (C25) Collaborative Knowledge Access (C26)
Table 2.
“virtual word of mouth” (wb6.4) “recommendation Systems” (wb10.6)
“collaborative categorization” (wb10.6) “folksonomies,tag clouds” (wb2.15)
Inductively Developed Categorization of Web 2.0 Characteristics
Basing on six subcategories, the second main category (C20) is found to show elements of sociologic and economic nature. Its first subcategory „User and Customer Integration‟ comprises examples of users and customers being empowered by having a growing influence on products and services making them more valuable and usable. They are seen in the examples to partially take over work processes and value creation within companies via Internet and sometimes even as becoming entrepreneurs themselves. The second subcategory of „Social Interaction‟ is built from examples explaining highly networked social interactions and communications between users within communities or networks over a distance. Found examples on services or products gaining value for users with a growing number of users make up the third category of „Network Externalities‟ while the fourth one focuses on „Individualization‟. It is described by the building examples showing that rich data and user integration enables the automated tailoring of services and products to the individual user‟s needs. This allows firms to earn revenues by offering individually fitted niche products. „Trust in the Wisdom of the Crowd‟ as the fifth subcategory consists of examples describing users as more and more trusting in and relying on the rapidly spreading information, meaning and experience of others on the Web. The finalizing sixth subcategory of „Collaborative Knowledge Access‟ contains examples presenting users as cooperatively developing ways to access knowledge and make it findable via networked tags and categorization.
4.2
Weighting and Densities of the Categories
To further investigate on the applicability and weighting of the constructed category scheme, a comprehensive content analysis is carried out based on the research materials encompassing 69 585 words and 3 163 averaged sentences. The number of averaged sentences is used for comparability reasons and calculated by automatically counting the words and dividing the results by 22 (cf. Charniak, 1996). For readability reasons the averaged sentences are interchangeably referred to as „sentences‟ below. During the investigation, 1 651 subcategory occurrences are coded within the research material and used as the basis for analysis in the results.
468 (28%)
C10 Technological Characteristics C20 Socioeconomic Characteristics
1183 (72%)
Figure 3.
Proportions of Main Category Occurrences within All Web 2.0 Articles
In a first step of analysis the absolute numbers of coded main category occurrences are calculated and depicted in Figure 3. A total of 1 183 coded occurrences of the „Socioeconomic Characteristics‟ main category is found which accounts for almost three thirds of the entire codings conducted within Web 2.0 articles. These proportions are given in brackets within the figure. The „Technological Characteristics‟ are found to have 28% of the coded occurrences. Both main categories are further analyzed again by itemizing the proportionate occurrences of their subcategories. This itemization for the technological main category is given in Figure 4 with relatively balanced proportions. The most-coded subcategory of „Interoperability‟ is accounting for 36% (absolute numbers given in brackets) followed by „Ease of Use‟, which accounts for 25% of all codings. „Data and Data Control‟ has 21%, and the category of „Scalable On-Demand Service and Production‟ encompasses the remaining 18%. Investigating on these proportions for the second main category, all six socioeconomic subcategories are itemized and shown in Figure 5.
C11 Scalable On-demand Service & Prod. 18% (85) 25% (118)
C12 Interoperability C13 Data & Data Control as Key Factors
21% (96)
36% (169)
C14 Ease of Use
Figure 4.
Proportions of C10 Subcategories within All Web 2.0 Articles
12% (139)
C21 User & Customer Integration C22 Social Interaction 36% (426)
13% (156)
C23 Network Externalities C24 Individualization
9% (108)
C25 Trust in the Wisdom of the Crowd 2% (22)
Figure 5.
28% (332)
C26 Collaborative Knowledge Access
Proportions of C20 Subcategories within All Web 2.0 Articles
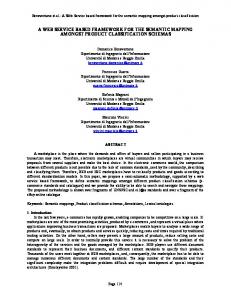
The occurrences are dominated by the subcategories „User and Customer Integration‟ and „Social Interaction‟, which in sum account for well over half of the codings. They are followed by „Trust in the Wisdom of the Crowd‟ occurring within 13% of the sentences and „Collaborative Knowledge Access‟ with 12%. Fewer occurrences are found regarding the subcategories of „Individualization‟ with 9% and „Network Externalities‟ showing only 2% of sentences as containing occurrences. The presentation of densities in this chapter is concluded by a last step of analysis. Therefore, all Web 2.0 articles are sorted in ascending order by publication year and presented in Figure 6 with their percentage of coded sentences. The data is itemized for both main categories to individually uncover differences over time. Articles published within the same year are clustered regardless of their publication month. Calculating the linear trend for both main categories shows a significant increase of occurrences for the main category „Socioeconomic Characteristics‟ and a significant decrease for the category of „Technological Characteristics‟. Percentage of Coded Sentences
70,0%
C10 Technological Characteristics
60,0% 50,0%
C20 Socioeconomic Characteristics
40,0% 30,0%
Linear (C10 Technological Characteristics)
20,0% 10,0% 0,0% 2006
Figure 6.
Year of Publication
2007
2008
2009
2010
Linear (C20 Socioeconomic Characteristics)
Proportions of Main Categories within the Research Material by Year
5
Discussion and Limitations
The results gained through qualitative content and cluster analysis show two unambiguous and reliable main categories characterizing the phenomenon under investigation. These results support Baechle‟s (2008) two dimensions of Web 2.0 and further amend them by ten subcategories. Comparing these subcategories with O‟Reilly‟s seven principles shows three new additional subcategories (Social Interaction, Network Externalities and Individualization) and a clarification and systemization of the others since they were overlapping and had different levels of abstraction. Coding the scheme revealed occurrences of all categories with very large and historically growing relative numbers of the socioeconomic main category but also of its subcategories „User and Customer Integration‟ and „Social Interaction‟. The subcategory of „Interoperability‟ was found to dominate the technological main category. Following Krippendorff (2004a), these frequencies might be interpreted as the importance of the different categories in the view of their authors. Referring to Bailey‟s (1994) criteria for quality measures within classification systems, the developed subcategories seem rather sound results. Due to their inductive development until saturation, they obey to the most important criterion being the provision of exhaustive categories combined with parsimony. They also successfully fulfil the criterion of reduced complexity by making the very vague phenomenon manageable and measurable. Further following Bailey‟s suggestions, they also meet criteria demanding for objects (i.e. characteristics of Web 2.0) to be easily and reliably classifiable. This is evaluated through application and the tests of intercoder reliability which average within a very sound range. Expectations regarding the ability to make a very vague phenomenon manageable, measurable or comparable and hypothesize based on the categories are met since the rigorous procedures of content analysis ensure this feature, which is also shown by the resulting numbers during the coding process. There are possible limitations that need to be considered when interpreting the findings. The reproducibility of the queries used for selecting the research material might change since new articles are published and included into databases. This was partly taken into account by limiting the newest query dates to one month before the querying. Still some journals are published with a one year delay in electronic databases and might therefore add when repeating the same queries. The queries themselves are also subject to some limitations since only article titles of journal articles and no books are searched with a limited set of search strings. The resulting framework was inductively developed through research materials which might be considered a challenge to generalizability arguing that the framework only applies to the processed articles. Countermeasures were taken by inductively processing research materials until saturation. This means that not a number of articles was selected ex ante but processing was repeated until neither new categories nor new “anchor examples” were possibly be retrieved. Inductively built categories might additionally be biased by the author‟s worldview or insights on the topic. The potential bias was tackled by using a second coder for this open coding. Interpreting coded frequencies as an indicator of category importance might be seen as biased due to research materials focusing on specific topics, which is countered through the construction of a broad material selection factor excluding articles with a strong focus. The method of using averaged sentences for comparability reasons might lead to excessive numbers of coded sentences since figures and tables are handled as text. This might additionally be fostered by the assumption during calculations that all sentences only contain one code, which must not hold true since the rules allow coding a sentence twice with two different categories. Trends are calculated using relatively small numbers of articles which is suspect to bias on incident. Review cycles and months of publication are also not taken into account possibly enhancing this bias regarding trend analysis. For reasons of manageability, reliability numbers are calculated following Holsti‟s (1969) simple coder agreement, which is used by most research papers conducting content analysis. It does neither take into account numbers of categories influencing reliabilities or agreements occurring on incident nor small numbers of codings as the basis for calculation. These challenges might be addressed by more advanced measures of reliability such as Krippendorf‟s alpha (Hayes and Krippendorff, 2007).
6
Conclusion
Within this paper we developed a comprehensible systemization of Web 2.0 and its characteristics by applying qualitative content and cluster analysis to a set of 254 research articles on the topic. Our resulting scheme depicts Web 2.0 as a phenomenon encompassing two main dimensions of characteristics: the first being of technological nature with four subcategories such as „Interoperability‟ or „Data and Data Control‟, and the second being of socioeconomic nature with six subcategories such as „Social Interaction‟ or „User Integration‟. Category importance was investigated by measuring their frequencies within the research material. An emphasis on the socioeconomic main category was found with high frequencies of its subcategories „User and Customer Integration‟ and „Social Interaction‟ while „Interoperability‟ was ranked highest within the technological main category. The resulting category scheme moves borders of Web 2.0 research toward overcoming its state of blurriness by presenting clear, sound and reliable categories of components. This quality was shown by the compliance with criteria of reliability and good classification schemes going well beyond existing classificatory approaches on the topic. To conclude, the constructed categories might be adjusted in some details but can be seen as one reliable and approved step towards a framework for generalizable research on Web 2.0 topics. Keeping the limitations in mind, it might be interesting to quantitatively evaluate the framework on a large population of modern Internet applications but also businesses exploring their usage of the different main and subcategories. The presented framework opens up research possibilities on the economic impacts of the different categories on electronic business models and their success. Going beyond economic applications of the framework, it might also be used to investigate on political or sociological phenomena associated with Web 2.0 such as voting campaigns.
References Abbasi, A., Chen, H. (2008). CyberGate: A Design Framework and System for Text Analysis of Computer-mediated Communication. MIS Quarterly, 32 (4), 811-837. Angelmar, R., Stern, L. W. (1978). Development of a Content Analytic System for Analysis of Bargaining Communication in Marketing. Journal of Marketing Research, 15 (1), 93-102. Baechle, M. (2008). Ökonomische Perspektiven des Web 2.0 – Open Innovation, Social Commerce und Enterprise 2.0 (in German). Wirtschaftsinformatik, 50 (2), 129-132. Bailey, K. D. (1994). Typologies and Taxonomies: An Introduction to Classification Techniques. Sage Publications, Thousand Oaks. boyd, d. m., Ellison, N. (2008). Social Network Sites: Definition, History, and Scholarship. Journal of Computer-Mediated Communication, 13 (1), 210-230. Charniak, E. (1996). Tree-Bank Grammars. In Proceedings of the National Conference on Artificial Intelligence, 1031-1036, Chesbrough, H. (2006). Open Innovation: The New Imperative for Creating and Profiting from Technology. Harvard Business School Publishing, Boston. Clemons, E. K. (2009). Business Models for Monetizing Internet Applications and Web Sites: Experience, Theory, and Predictions. Journal of Management Information Systems, 26 (2), 15-41. Duriau, V. J., Reger, R. K., Pfarrer, M. D. (2007). A Content Analysis of the Content Analysis Literature in Organization Studies: Research Themes, Data Sources, and Methodological Refinements. Organizational Research Methods, 10 (1), 5-34. Eisenhardt, K. M. (1989). Building Theories from Case Study Research. Academy of Management Review, 14 (4), 532-550. Frueh, W. (2007). Inhaltsanalyse: Theorie und Praxis (in German). 6th Edition. UVK Verlagsgesellschaft, Konstanz. Ganesh, J., Padmanabhuni, S. (2007). Web 2.0: Conceptual Framework and Research Directions. In AMCIS 2007 Proceedings, 1-9,
Gephart, R. P. (1993). The Textual Approach: Risk and Blame in Disaster Sensemaking. Academy of Management Journal, 36 (6), 1465-1514. Hassan, N., Mathiassen, L. (2009). Combining Scientometric and Content Analysis Methods for Identifying Core Concepts and Action Principles of Information Systems Development. In AMCIS 2009 Proceedings, 1-9, Hayes, A. F., Krippendorff, K. (2007). Answering the Call for a Standard Reliability Measure for Coding Data. Communication Methods and Measures, 1 (1), 77-89. Hendler, J., Golbeck, J. (2008). Metcalfe‟s law, Web 2.0, and the Semantic Web. Web Semantics: Science, Services and Agents on the World Wide Web, 6 (1), 14-20. Hiltz, S. R., Passerini, K., Dwyer, C. (2007). Trust and Privacy: A Comparison of Facebook and MySpace. AMCIS 2007 Proceedings, 1-12. Holsti, O. R. (1969). Content Analysis for the Social Sciences and Humanities. Addison-Wesley, Reading. Insch, G. S., Moore, J. E., Murphy, L. D. (1997). Content Analysis in Leadership Research: Examples, Procedures, and Suggestions for Future Use. Leadership Quarterly, 8 (1), 1-25. Kassarjian, H. (1977). Content Analysis in Consumer Research. Journal of Consumer Research, 4 (1), 8-18. Krippendorff, K. (2004a). Content Analysis: An Introduction to its Methodology. 2nd Edition. Sage Publications, Thousand Oaks. Krippendorff, K. (2004b). Reliability in Content Analysis: Some Common Misconceptions and Recommendations. Human Communication Research, 30 (3), 411-433. Lacity, M. C., Janson, M. A. (1994). Understanding Qualitative Data: A Framework of Text Analysis Methods. Journal of Management Information Systems, 11 (2), 137-155. Locke, C., Levine, R., Searls, D., Weinberger, D. (2000). The Cluetrain Manifesto: The End of Business as Usual. 1st Edition. Perseus Publishing, Cambridge. Mayring, P. (2000). Qualitative Content Analysis. Forum: Qualitative Social Research, 1 (2), 1-10. Mintzberg, H. (1979). An Emerging Strategy of “Direct” Research. Administrative Science Quarterly, 24 (4), 582-589. Moore, J. E. (2000). One Road to Turnover: An Examination of Work Exhaustion in Technology Professionals. MIS Quarterly, 24 (1), 141-168. Morris, R. (1994). Computerized Content Analysis in Management Research: A Demonstration of Advantages and Limitations. Journal of Management, 20 (4), 903-931. Nag, R., Hambrick, D. C., Chen, M.-J. (2007). What is Strategic Management, Really? Inductive Derivation of a Consensus Definition of the Field. Strategic Management Journal, 28 (9), 935-955. O‟Reilly, T. (2007). What is Web 2.0: Design Patterns and Business Models for the Next Generation of Software. Communications and Strategies, 65 (1), 17-37. Pavlou, P. A., Dimoka, A. (2006). The Nature and Role of Feedback Text Comments in Online Marketplaces: Implications for Trust Building, Price Premiums, and Seller Differentiation. Information Systems Research, 17 (4), 392-414. Saris-Gallhofer, I. N., Saris, W. E., Morton, E. L. (1978). A Validation Study of Holsti‟s Content Analysis Procedure. Quality and Quantity, 12 (2), 131-145. Scott, W. (1955). Reliability of Content Analysis: The Case of Nominal Scale Coding. Public Opinion Quarterly, 19 (3), 321-325. Singh, M., Davison, C., Wickramasinghe, N. (2010). Organisational Use of Web 2.0 Technologies: An Australian Perspective. AMCIS 2010 Proceedings. Spiekermann, S., Cranor, L. F. (2009). Engineering privacy. IEEE Transactions on Software Engineering, 35 (1), 67-82. Veit, D., Parasie, N. (2010). Common Data Exchange Standards: Determinants for Adoption at the Municipal Level. AMCIS 2010 Proceedings, 1-10. Wasko, M. M., Faraj, S. (2005). Why Should I Share? Examining Social Capital and Knowledge Contribution in Electronic Networks of Practice. MIS Quarterly, 29 (1), 35-57.
Appendix ID
Title
Author(s)
Publication Title
wb1
'New-wave' Global Firms: Web 2.0 and SME Internationalisation
Bell and Loane (2010)
Journal of Marketing Management
wb2
Global Diffusion of the Internet XV: Web 2.0 Technologies, Principles, and Applications: A Conceptual Framework from Technology Push and Demand Pull Perspective
Kim et al.(2009)
Communications of AIS
wb3
Tutorial: Introduction to Web 2.0
Sutter (2009)
Communications of AIS
wb4
Theorizing Web 2.0
Song (2010)
Information, Communication & Society
wb5
Characterizing Web Users' Degree of Web 2.0-ness
Chiang et al. (2009)
Journal of the American Society for Information Science and Technology
wb6
Strategic Development of Business Models: Implications of the Web 2.0 for Creating Value on the Internet
Wirtz et al. (2010)
Long Range Planning
wb7
An Analysis of Business Models of Web 2.0 Application
Shang et al. (2009)
Proceedings of the 2009 Sixth International Conference on IT
wb8
Web 2.0 Adoption by Danish Newspapers: Urgent Need for New Business Models?
Bjørn-Andersen et al. (2009)
Journal of Universal Computer Science
wb9
Impacts of Web 2.0 on Business Models in Mass Customization Bazijanec et al. (2007)
wb10
What is Web 2.0: Design Patterns and Business Models for the Next Generation of Software
Table 3.
O‟Reilly (2007)
AMCIS 2007 Proceedings Communications & Strategies
Excerpt from the Set of Research Material Articles
Percentage of Sentences Coded as C20
80,0% wb3
70,0% 60,0% 50,0% 40,0% 30,0% 20,0%
wb2
wb6 wb7 wb4
wb1 wb8
wb9
wb10
wb5
10,0% 0,0% 0,0%
Figure 7.
3
Percentage of Sentences Coded as C10
5,0%
10,0%
15,0% 20,0% 25,0% Web 2.0 Articles
30,0%
35,0%
40,0%
Proportions of Coded Main Categories within Each Article of the Research Material3
We would like to express our gratitude to the three anonymous reviewers and highly appreciate their comments and suggestions. They significantly contributed to this paper‟s final version and encouraged us to attach the details within this appendix.