autoshaped leverpressing and polydipsia in the rat. JENNIFER J. RIGA and FRANCES K. MCSWEENEY. Washington StateUniversity, Pullman, Washington.
Animal Learning & Behavior 1985, 13 (3), 239-245
A test of the conservation model for autoshaped leverpressing and polydipsia in the rat JENNIFER J. RIGA and FRANCES K. MCSWEENEY Washington State University, Pullman, Washington This study examined a conservation model (Allison & Mack, 1982) that predicts a linear relation between the weighted sum of two responses, autoshaped leverpressing and polydipsia, and the amount of food delivered on a variable-time schedule. Fifteen rats were assigned randomly to one of three groups. The rats in Group 1 were maintained at 80% of their free-feeding body weights. Those in Group 2 began at 100% but were allowed to lose weight during the experiment. The rats in Group 3 also began at 100%of their free-feeding weights and were maintained at this level. Each group was exposed to five conditions that delivered less food than that consumed during baseline and to one condition that delivered more food, The results did not support the conservation model. Contrary to the model, the decreasing linear relation between the individual responses, or the weighted sum of the responses, and the amount of food delivered was not found for all rats, and some rats responded more when an excessive amount of food was presented than during baseline,
Conservation theory predicts how an animal will respond during schedules of reinforcement, by assuming that the responses involved can be scaled on some common dimension such as energy expenditure. It also assumes that this dimension is conserved across two sessions of the sameduration: an experimental session, in which the opportunity to performa particular response is on a schedule,anda baseline session, in which theresponses involved are freely available. For example, the total dimension apportioned to leverpressing and eating will be the same during baseline sessions, in which access to food and a lever are freely available, and experimental sessions, in which food is delivered on a specified schedule of reinforcement. This conserved dimension can be interpreted as a variable common to these responses; it is represented as a scaling parameter in the conservation models. Conservation models have successfully predicted responding during a numberof different schedules that use reciprocal contingencies. For example, there is considerable evidence supporting the model for the simple fixedratio schedule of this type (Allison, 1976; Allison, Miller, & Wozny, 1979). Such a schedule specifies that the subject must perform a fixed number of responses of one type (e.g., leverpressing) forthe opportunity to perform another type (e.g., drinking), and mustthenperform a fixed number of responses of the second type (drinking) for another chance to engage in the first, and so on. Recently, the conservation model has beenextended to account for autoshaping and schedule-induced polydipThe authors which to thank John M. Hinson for his invaluable assistancein preparing this manuscript. Reprints may be obtained from JenniferJ. Higa, Departmentof Psychology, WashingtonState University, Pullman, WA 99164-4830.
sia (Allison & Mack, 1982). Autoshaping wasdiscovered by Brown and Jenkins (1968). In one condition, Brown andJenkins presented, to food-deprived pigeons, a lighted key followed by access to grain on a variable-time (VT) 6O-sec schedule. After severallight-food trials, the birds beganto peck the lighted key, eventhoughgrain presentation wasnotcontingent uponperformance of a response. Schedule-induced polydipsia was discovered by Falk (1961), who placed food-deprived rats on a variableinterval (VI) 6O-sec schedule during which a barpress produced a 45-mg pelletof food. He found that rats drank three to four times more during the schedule than when food and water were freely available. Allison and Mack's model for autoshaping and polydipsia appears in Equation 1. k(NE)
+ Ud + jUp
= kOe
+ Od + jOp.
(1)
The right side of the equation represents baseline sessions in whichfood, water, and a lever are freely available. The animal consumes Oe grams of food, licks Od times, and leverpresses Op times. The left side of the equation represents experimental sessions in which E gramsof food are givenper delivery and N deliveries are made on a VT schedule of reinforcement. The VT schedule delivers a reinforcer independently of responding at various intervals of time. In this case, a lever is also presented a few seconds beforeeachfooddelivery to produce autoshaped leverpressing (e.g., Atnip, 1977; Locurto, Terrace, & Gibbon, 1976; Stiers & Silberberg, 1974). Udand Up are the number of licks and leverpresses made during this session. The parameters k and j are dimension scalars.
239
Copyright 1985 Psychonomic Society, Inc.
240
HIGA AND McSWEENEY
Implications of this model appear when the equation is rearranged as: k(NE-Oe) + (Ud-Od) + j(Up-Op) = O.
(2)
Experimentally suppressing eating (NE < De) by delivering less food than the amount eaten during baseline should produce one of three results: both Ud and Up may increase, or Ud alone or Up alone may increase. This manipulation should produce one of these effects because the initial term in Equation 2 will be negative, and to satisfy the equation, either Ud or Up (or both) must increase. More specifically, Equation 2 predicts a linear increase in Ud, Up, or both, as NE decreases. This becomes evident when Equation 1 is solved for Ud + jUp: Ud+jUp
=
(kOe+Od+jOp) - k(NE).
(3)
Any increase in Ud would represent polydipsia, and any increase in Up would represent autoshaped responses. Allison and Mack (1982) tested these predictions by varying the total grams of food (NE) delivered during the experimental session. They found that there was a linear increase in Ud and Up as NE decreased. Thus, the same experimental manipulation produced both polydipsia and autoshaped responding, as predicted by the conservation model. The present experiment further investigated this model. A model that could account for both autoshaping and polydipsia would be an important theoretical advance, and this model appeared promising because of its past success in accounting for responding during a variety of contingent and noncontingent schedules (e.g., Allison, 1980; Shapiro & Allison, 1978). The study attempted to replicate Allison and Mack's findings by comparing responding during baseline sessions in which a lever, a water spout, and food were freely available and an experimental session during which food was presented on a VT 90-sec schedule. To produce autoshaped responding, the lever was also presented 10 sec before each delivery of food. The study also tested the generality of Allison and Mack's model by looking at a number of conditions that delivered different amounts of food. An important condition was one that delivered more food than that consumed during baseline. Specifically, the model predicts that there should be less responding during a rich schedule than during baseline. Because Allison and Mack's subjects began the study at certain weights that were not maintained throughout the study, their subjects may have been losing weight during the study, confounding changes in behavior produced by the experimental manipulations with those produced by changes in body weight. Therefore, responding at different body weights was also examined in the present study. If the conservation model was correct, then either licking or leverpressing or both should increase linearly as the amount of food delivered per session decreased.
METHOD Subjects Fifteen experimentally naive male Sprague-Dawley rats, 120-150 days old at the start of the study, were used. Apparatus The rats were tested in one of two similar operant chambers. Box I was 23.5 cm long, 20.5 cm wide, and 20.5 cm high. It contained a food trough mounted 7 em above a grid floor and 4.5 cm from the adjacent left wall, a retractable lever located 11 ern above the floor and 9 em from the left wall, and a drinkometer with a 2.5-mm aperture located 7 cm above the floor, 4 em from the right wall. Box 2 had similar dimensions. It was 23 ern long, 20.5 ern wide, and 20 em high, with a food trough located 6 em above a grid floor and 4.5 cm from the left wall, a retractable lever mounted 11.5 cm above the floor and 10.5 ern from the left wall, and a drinkometer with a 2.5-mm aperture, 7 em above the floor, 2.5 ern from the left wall. Both boxes were enclosed in sound-attenuating chambers and were equipped with food and water catchment trays. A houselight illuminated the chamber, and a fan masked extraneous noise. Electromechanical equipment scheduled the experimental events.
Procedure The rats were assigned randomly to one of three groups. The first began the experiment at approximately 80 % of their individual free-feeding body weights (Group 1); the second group began at 100% (Group 2). The third group also began at 100%, but they were given supplemental food to maintain their free-feeding weights throughout the study (Group 3). This was done daily by intubating laboratory rat chow in a liquid form into the stomach. Because the experimental conditions called for suppressing eating, this procedure insured that the rats would be maintained at their original weights without having actually to eat. Eating outside the experimental setting would have confounded the conditions of suppression of eating relative to baseline. Rats in the other groups were also intubated on a daily basis, but no liquid food was given. Once the rats reached the desired weights, they were placed on a baseline phase, an experimental phase, and another baseline phase. As in Allison and Mack's study, each rat was exposed to the next baseline or experimental condition when, based on.a block of 4 days, there was no monotonic change in the number of responses made, and when the standard deviations of the scores on all dependent variables were within 15% of the block mean. The average number of sessions needed to meet the criteria was approximately 20 for the first baseline phase, 11 for each experimental condition, and 10 for the second baseline phase. Each rat was exposed to the various conditions during an assigned 2-h period of the day, which was held constant throughout the experiment. Access to food and water was restricted to this time, and the amount of food and water consumed and number of licks and leverpresses were monitored. Recordings of food and water were corrected by including the spillage in the catchment trays. During the baseline phase, ground laboratory rat chow, a drinking tube, and a lever were freely available. The experimental phase, consisting of six different conditions, was similar to the baseline phase except that food was delivered on a VT 9O-sec schedule of reinforcement, scheduled according to a 20-interval series constructed by using the procedure in Catania and Reynolds (1968). The lever was available for only 10 sec before each food presentation (45-mg Noyes pellets). We should point out that Allison and Mack also used different types of food in the baseline and experimental phases. Each experimental condition presented food 72 times per session. The conditions differed only in terms of the number of pellets per delivery. The schedules delivered 1,2, 3,4, 5, 6, or 7 pellets each, giving a total of3.24, 6.45, 9.72, 12.96, 16.20, 19.44, or 22.68 g of food per session, respectively. Each rat was exposed to five such
AUTOSHAPING AND POLYDIPSIA conditions, selected so that the total amount of food delivered by the schedulewas less than the amounteaten during baseline. They were also exposedto one conditionin whichthe scheduledelivered more than-that eaten during baseline. Thus, during the experimental phase, each rat was exposed to six different conditions, with the order of presentation randomized.
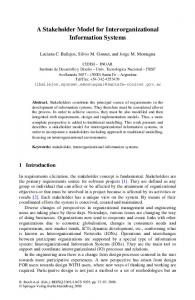
RESULTS Figure 1 shows the number of licks and leverpresses for each rat in Group I. The filled circles represent responding as a function of the amount of food delivered
la 14,000
140
10,000
100
r=-0.712 r :-0.122
6000
• • •
200
• •
60
•
20'
~~ • •
lb 14,000
35 r=0.203
10,000
en
6000
0
2000
~
•
• • • •
•
a:: a:: W > W
La.
0
a:: W en
:E :::J Z W
14,000
lc r=-0.645
~ • •
10,000
• •
6000 2000
W
~
..J
La.
0
a:: W en
:E
ld 14,000 10,000
• •
•
•
25
•
15
~.
5
100 60 20
CJ «a::
• •
6000
W
~
r=-0.658
•
140
:::J Z W
~
a::
en W en en w a.
..J
r=-0.601
~
7 5 r =0.754
3
r =-0.095
20
•
le 14,000
21
10,000
15
200
•
9
~ 3.0
9.0
15.0
3 21.0
r=0.234
•
r:::0.800
6000
241
~ • •
3.0
9.0
15.0
21.0
AMOUNT OF FOOD DELIVERED Figure 1. The filled circlesrepresent the number of licks and leverpresses performed by the rats in Group 1, as a functionof the amount of fooddeUvered (in grams)during an experimentalcondition. The open circles represent the average number of responses made during the baseline conditions. The line fitting the data for each rat and the correlation coeftkient appear on eacb graph.
242
HIGA AND McSWEENEY
per session. Each point is the average of 4 days that satisfied the stability criteria. The open circles represent responding during baseline in which food was freely available. These points were determined by averaging the number of licks or leverpresses performed during the two baseline phases. A linear regression analysis was done for each response, and the line fitting the six points is also included in each graph along with the correlation coefficient.
Similar analyses were also done for Groups 2 and 3, and these are shown in Figures 2 and 3, respectively. Figures 1, 2, and 3 show that there are no systematic changes in leverpresses or licks for any group as the amount of food delivered increases. Some rats show a negative correlation between responding and amount of food. Others exhibit a positive correlation. Although a negative correlation is evident for most rats, the correlations are low, ranging from -0. I()() to -0.712. Likewise,
2a
14,000
14
10,000
10
• • ~
6000
• 2
200
2b 14,000
..
6000
o
2000
~
•
• • • •
::J
6000
W
• •
10 6
2
LL
•
•
(75.5)
14
6
:!:
2
a:l
•
10
a:: w
•
• • • r =0.662
::)
a::
~
...J
o
•
2000
~
w
= 0.287
r
a:l
Z
ffia::
> W
2c
14,000 10,000
:!:
•
a:: w
LL
a:: w
en w en e,
...J
o
•
•
14
r = -0.321
10,000
en
r = 0.116
2d 14,000
z w o
14
a::
10
.05; Group 2, F(5,20) = 1.45, P > .24; Group 3 F(5,20) = 1.09, p > .39]. A final analysis examining body weight and the number of licks performed during each experimental condition showed that there was no significant difference in licking among the three groups [F(2,12) = 0.87, P > .44].
Leverpresses Each rat pressed more during most of the five experimental conditions that suppressed eating than during baseline. However, t tests comparing the baseline amount of leverpressing with the average number of Ieverpresses across the five experimental conditions reveal that this effect was not statistically significant for any group [Group 1, t(4) = 1.939, P > .05; Group 2, t(4) = 0.566, P > .10; Group 3, t(4) =0.708, P > .10). Similart tests between the number of leverpresses made during baseline and the condition that delivered more food than baseline revealed no significant difference for any group [Group I, t(4) = 1.371, P > .10; Group 2, t(4) = 1.041, P > .10; Group 3, t(4) = 0.708, P > .10]. An analysis of variance on the number of leverpresses performed during each of the experimental conditions showed that leverpressing did not change significantly with changes in the amount of food delivered for any group [Group 1, F(5,20) = 1.33, P > .29; Group 2, F(5,20) = 1.01, P > .44; Group 3, F(5,20) = 1.01, P > .44]. Finally, the number of leverpresses was not significantly different across groups [F(2,12) = 0.51, P > .61]. DISCUSSION
Licks Matched t tests were calculated to determine whether the rats in a particular group drank significantly more during the conditions that suppressed eating than during baseline. This was done by comparing the average number of licks each rat made during baseline with the average number of licks for all five conditions. The analysis revealed that the rats in Group I [t(4) = 2.132, p < .05], Group 2 [t(4) = 5.265, p < .05], and Group 3 [t(4) = 3.26, p < .025] all licked more during the lean conditions than during baseline. Similar t tests were done, comparing the number of licks during baseline with the number during the condition that delivered more food than was consumed during baseline for each group. The difference was not significant for Group 1 [t(4) = 1.841, P > .05], but the rats in Group 2 and Group 3 licked more during the rich condition than during baseline [t(4) = 3.468, P < .05, and t(4) = 3.598, P < .05, respectively]. Next, a repeated-measures analysis of variance was done for each group, testing whether there was a signifi-
The present study failed to replicate Allison and Mack's (1982) experiment. This finding implies that the conservation model does not accurately describe responding during variable-time schedules, where the observed responses are autoshaped leverpressing and polydipsia. The present study failed to replicate Allison and Mack's results in several ways. First, the model predicts an increase in licking or leverpressing, or both, with the suppression of eating, but this was not found. Although the experimental suppression of eating (NE < Oe) produced an overall increase in licking for Groups I, 2, and 3 as predicted by the model, the predicted decreasing linear relation between the amount of food delivered and licks was not obtained for all rats. Some displayed an increase in licking as the amount of food delivered increased, as seen in Figures I and 2. Experimentally suppressing eating did not produce the expected increase in leverpresses relative to baseline, or the decreasing linear relation between leverpressing and
AUTOSHAPING AND POLYDIPSIA grams of food delivered. Although some rats did show the appropriate relation, the correlation was low and the proportion of variance accounted for was small. The sum Ud (licks) + jUp (leverpresses) also did not increase linearly with decreases in the amount of food deliveredas predictedby the model. To test this prediction, the j parameter was systematically varied from -1,500 to + 1,500 but the sum did not conform to the predictions of the model. No choice of j produced a decreasing linear function for all rats. When a negative correlation between the sumof responding andthe amount of food delivered was found, it was often small, about -0.40. The onlyexception was Rat lB. Whenj was 200, the correlationbetweenUd+jUp and the amount of food delivered was -0.972. Second, the modelpredicts that there should be a suppression of licking or leverpressing, or both,if the amount of food delivered is more thanthatconsumed during baseline. However, the results showed the opposite in some cases: somerats lickedmoreduringthe richschedule than during baseline. It mightbe argued that the rats violated the modelbecause they did not eat all of the food delivered during the rich schedule. However, only Rat 3E failed to consume the entire amount of food. Although the model predicts that there shouldalso be a decrease in the number of leverpresses during a rich schedule, somerats leverpressed more, as seenin Figures 1,2, and 3. Again, the violation of the model cannotbe attributed to rats' failure to eat all of the food delivered during the rich schedule. All of the subjects except 3E consumed the entire amount of food delivered. Although there were several procedural differences between this study and that of Allison and Mack (1982) whichmighthelp to explainthe differences in results between the two studies, in all cases, the procedure used in this study provides a better test of the conservation model than does that used by Allison and Mack. First, Allison and Mackconducted onlythree different conditions; the present study conducted six. Six points should provide a more accurate test of the model. Second, the range of conditions examined was wider in the present study than in Allison and Mack's study. In addition to testing three schedules that delivered amounts of food similar to those used by Allison and Mack, the present study also examined three additional schedules, two of whichprovidedless foodthan baseline and one of whichdeliveredmore. Examining a schedule that providedmore foodthan baseline was important becauseit testeda prediction of the conservation model that was not tested by Allison and Mack: Delivery of more food should produce less leverpressing and licking than occurred during baselines. Finally, unlike Allison and Mack, we systematically examinedthe effectof body weighton responding. Allison and Mack did not hold body weightconstant. Their sub-
245
jects may havebeen losingweightduringthe study, contributing to the increase in licking and leverpressing across the experiment which they attributed to changes in NE. Although the present results did not replicate Allison and Mack's they are not completely differentfrom them either. In fact, Table 1 shows that the decreasing linear relationship between the numberof licks and amount of food reported by Allison and Mack also appeared in the presentstudywhenit examined only four points. Therefore, the present results suggest that the conservation model is not a general modelof behavior, but rather appliesonlyunderlimitedconditions, suchas those studied by Allison and Mack. In conclusion, the presentstudydoes not offer support for Allisonand Mack's model of autoshaped leverpressingandpolydipsia. Although therewereprocedural differences, the present study provided a better test of the model. Conservation models have been successful, however, in situations that have used reciprocal contingency schedules. It may be that the conservation theory does not applyto noncontingent schedules that do not involve imposed requirements. Instead, it perhaps should be restricted to reciprocal contingency schedules that require the subject to perform a certain number of one response for the opportunity to engage in another. REFERENCES ALUSON, I. (1976).Contrast, induction, facilitation, suppression, and conservation. Journal of the Experimental Analysis of Behavior, 25, 185-198. ALLISON, I. (1980).Conservation, matching, and the variable-interval schedule. Animal Learning de Behavior, 8, 185-192. ALLISON, I., &; MACK, R. (1982). Polydipsia and autoshaping: Drinking and leverpressing as substitutes for eating. Animal Learning de Behavior, 10, 465-475. ALLISON, I., MILLER, M., &; WOZNY, M. (1979).Conservation in behavior. Journal of Experimental Psychology: General, 108, 4-34. ATNIP, G. W. (1977). Stimulus and response-reinforcer contingencies in autoshaping, operant, classical, and omission trainingprocedures in rats. Journal of the Experimental Analysis ofBehavior, 28,59-69. BROWN, P. L., &; JENKINS, H. M. (1968). Auto-shaping of the pigeon's key-peck. Journal of the Experimental Analysis of Behavior, 11, 1-8. CATANIA, A. C., &; REYNOWS, G. S. (1968). A quantitative analysis of the responding maintained by intervalschedules of reinforcement. Journal of the Experimental Analysisof Behavior, 11, 327-383. FALK, I. L. (1961). Production of polydipsia in normal rats by an intermittent food schedule. Science, 133, 195-196. locURTO, C., TERRACE, H. S., &; GIBBON, I. (1976). Autoshaping, randomcontrol, and omission training in the rat. Journal oftheExperimental Analysis of Behavior, 26, 451462. SHAPIRO, N., &; ALLISON, I. (1978). Conservation, choice, and the concurrent fixed-ratio schedule. Journal of the Experimental Analysis of Behavior, 29, 211-223. STIERS, M., &; SILBERBERG, A. (1974). Lever-eontact responses in rats: Automaintenance withand without a negative response-reinforcer dependency. Journal of the Experimental Analysis of Behavior, 22, 497-506. (Manuscript received February 26, 1985; revision accepted for publication July 22, 1985.)