IEEE TRANSACTIONS ON INFORMATION TECHNOLOGY IN BIOMEDICINE, VOL. 16, NO. 5, SEPTEMBER 2012
991
A Wearable Sensor Module With a Neural-NetworkBased Activity Classification Algorithm for Daily Energy Expenditure Estimation Che-Wei Lin, Ya-Ting C. Yang, Jeen-Shing Wang, Member, IEEE, and Yi-Ching Yang
Abstract—This paper presents a wearable module and neuralnetwork-based activity classification algorithm for energy expenditure estimation. The purpose of our design is first to categorize physical activities with similar intensity levels, and then to construct energy expenditure regression (EER) models using neural networks in order to optimize the estimation performance. The classification of physical activities for EER model construction is based on the acceleration and ECG signal data collected by wearable sensor modules developed by our research lab. The proposed algorithm consists of procedures for data collection, data preprocessing, activity classification, feature selection, and construction of EER models using neural networks. In order to reduce the computational load and achieve satisfactory estimation performance, we employed sequential forward and backward search strategies for feature selection. Two representative neural networks, a radial basis function network (RBFN) and a generalized regression neural network (GRNN), were employed as EER models for performance comparisons. Our experimental results have successfully validated the effectiveness of our wearable sensor module and its neural-network-based activity classification algorithm for energy expenditure estimation. In addition, our results demonstrate the superior performance of GRNN as compared to RBFN. Index Terms—Accelerometer, energy expenditure, electrocardiogram (ECG), feature selection, generalized regression neural network (GRNN), radial basis function network (RBFN).
I. INTRODUCTION N inactive lifestyle is a key factor in the development of chronic conditions such as diabetes, obesity, and cardiovascular disease [1]. In order to promote an active lifestyle, it is beneficial to provide information such as the energy expenditure of daily activities. In the past decade, due to the rapid development of microelectromechanical systems and IC technologies, wearable sensors equipped with accelerometers for
A
Manuscript received August 21, 2011; revised January 12, 2012; accepted June 2, 2012. Date of publication August 3, 2012; date of current version September 20, 2012. This paper was supported by Chunghwa Telecom Company under Grant MAC000298–1, and in part by National Cheng Kung University Project for Promoting Academic Excellence & Developing World Class Research Centers, Taiwan. C.-W. Lin and J.-S. Wang are with the Department of Electrical Engineering, National Cheng Kung University, Tainan 701, Taiwan (e-mail:
[email protected];
[email protected]). Y.-T. C. Yang is with the Institute of Education and Centre for Teacher Education, National Cheng Kung University, Tainan 701, Taiwan (e-mail:
[email protected]). Y.-C. Yang is with the Department of Family Medicine, National Cheng Kung University, Tainan 701, Taiwan (e-mail:
[email protected]). Digital Object Identifier 10.1109/TITB.2012.2206602
motion detection and electrocardiograms (ECGs) for cardiovascular monitoring have become cost-effective auxiliary tools. Several studies have utilized activity acceleration or heart rate (HR) series for developing energy expenditure regression (EER) models [2]–[11]. Some EER models were built based on a basic assumption of a linear relationship between energy expenditure and a single parameter count: a feature derived from activity acceleration signals [2]–[4]. Using a single parameter to construct a linear EER model is advantageous in minimizing computational load; however, the generalization property and estimation accuracy of the model is typically poor, since a single parameter is insufficient to describe the phenomenon of energy expenditure for diverse daily activities. To increase the accuracy of EER models, many researchers have investigated different approaches such as increasing the number of sensors [5] or combining multiparameter physiological signals with acceleration signals in EER modeling problems [6]–[8]. Recently, some researchers [9], [10] have found that constructing multiple EER models for physical activities of different intensity levels increases the accuracy of energy expenditure estimations. For example, Heil and Klippel [9] used feature extraction to classify daily activities into a set of different intensity levels before constructing EER models. Weber et al. [10] used a similar approach to categorize activities with similar features into different groups, developing corresponding EER models for each group of activities. In the field of activity classification, Karantonis et al. developed an activity classification system for different types of human movement including periods of activity and rest, recognizing the postural orientation of the wearer, detecting events such as walking and falls, and providing an estimation of metabolic energy expenditure [12]. Khan et al. incorporated an augmented feature vector and an artificial neural network (ANN) to classify 15 physical activities [13]. Curone et al. presented an algorithm for classifying human posture and activity level and achieved a recognition rate of 96.2% for discriminating static and dynamic activities [14]. In recent research, Lee et al. developed a single triaxial accelerometerbased system for recognizing six different types of daily activities [15], wherein daily activities were classified by hierarchical ANNs. Lee et al. conducted recognition tests on 20 subjects and achieved an average recognition accuracy of 94.43% (subject independent) and 96.61% (subject dependent). In addition to utilizing accelerometers in activity classification, Curone et al. employed ECG in addition to accelerometers in the discrimination of physical activity types, intensity, and posture [16]. In addition to the activity classification of healthy participants,
1089-7771/$31.00 © 2012 IEEE
992
IEEE TRANSACTIONS ON INFORMATION TECHNOLOGY IN BIOMEDICINE, VOL. 16, NO. 5, SEPTEMBER 2012
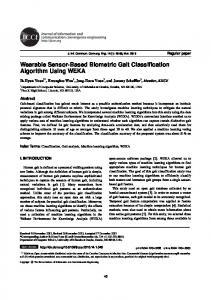
Palmerini et al. employed feature selection techniques to characterize the distinctive behavior of individuals with Parkinson’s disease and control participants using acceleration signals [17]. In addition to increasing the number of sensors or types of signals, some studies have focused on the utilization of complex regression models, such as nonlinear regression models [11]. Recently, neural networks (NNs) have been widely adopted for EER model construction [18], [19]. Some sophisticated machine-learning approaches have been actively utilized in dealing with energy expenditure estimation problems. For example, combinations of feature selection techniques and machinelearning-based regression models can be found in recent publications [18], [19]. The aforementioned approaches not only increase the performance of EER models, but also allow for consideration of the clinical definitions of selected features for constructing a best-fitting model. Investigating possible combinations of feature selection techniques and effective regression models for accurate estimation of energy expenditure is one of the goals of this study. In this paper, we have developed a wearable sensor module and a neural-network-based activity classification algorithm for daily energy expenditure estimation. The wearable sensor module can be used to simultaneously collect acceleration signals and corresponding ECG data for daily activities. The proposed physical activity classification algorithm consists of procedures for data collection, data preprocessing, activity classification, feature selection, and EER model construction using NNs. In order to construct regression models with the least number of features and satisfactory predictive accuracy, sequential forward search (SFS) and sequential backward search (SBS) [20] techniques were employed for feature selection. Furthermore, a radial basis function network (RBFN) [21] and a generalized regression neural network (GRNN) [22] were used in the regression models for energy expenditure in order to compare their estimation performance. The rest of this paper is organized as follows: In Section II, we introduce the hardware components of the wearable sensor module. The proposed NN-based activity classification algorithm is introduced in Section III. Section IV provides the experimental results of the proposed approach. Finally, conclusions are presented in Section V. II. WEARABLE SENSOR MODULE We have developed a wearable sensor module, which comprises motion sensors and an ECG sensor. The motion sensors are mounted on the users’ wrist, waist, and ankle, and the ECG sensor is attached to the chest near the heart area. The motion sensors are responsible for collecting acceleration signals during the users’ daily activities, while the ECG sensor monitors the heart’s electrical activity. The hardware components of the motion sensors and the ECG sensor are shown in Fig. 1. The hardware components of each sensor include a signal-sensing module, a microcontroller unit (MCU), a wireless communication module, and a storage module. The major component in the motion sensor is a triaxial digital accelerometer for sensing motion/activity signals, and the sensing com-
Fig. 1.
Hardware components of the wearable sensor module.
Fig. 2. Block diagram of hardware components of the ECG amplifying/ filtering circuit. TABLE I COMMON-MODE REJECTION RATIO OF THE INSTRUMENT AMPLIFIER AT VARIOUS FREQUENCIES
ponent in the ECG sensor is an amplifying/filtering circuit. The accelerometer IC employed in the wearable sensor module is a Freescale MMA7455L triaxial digital accelerometer. The Freescale MMA7455L accelerometer has user selectable full scales of ±2, ±4, and ±8 g, and is able to measure acceleration signals over a bandwidth of 125 Hz for all axes. The sensitivity of the accelerometers was set from –8 to 8 g in this study. The ECG amplifying/filtering circuit comprises an instrument amplifier, a high-pass filter, a low-pass filter, and a notch filter as shown in Fig. 2. The instrument amplifier is responsible for amplifying differential input signals from the heart of a user and rejecting common-mode noise such as electromyography interference. The common-mode rejection ratio (CMRR) is used to evaluate the effectiveness of the instrument amplifier and measures the tendency of the instrument amplifier to reject input signals common to both input leads. The CMRR of the instrument amplifier in our ECG sensor is higher than 90 dB for all of the frequencies in our study (see Table I), which outperforms the commercially available MSI E3–80 ECG sensor (which has a CMRR higher than 60 dB) [23]. The high-pass, low-pass, and notch filters in our design are responsible for rejecting noises that are outside of the ECG’s signal bandwidth. In our design, ECG filters are set to attenuate frequencies that are under 0.05 Hz (by the high-pass filter) or above 100 Hz (by the low-pass filter), as well as reducing powerline interference at 60 Hz (by the notch filter).
LIN et al.: WEARABLE SENSOR MODULE WITH A NEURAL-NETWORK-BASED ACTIVITY CLASSIFICATION ALGORITHM
Fig. 3.
993
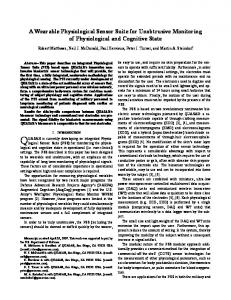
Flowchart of the neural-network-based activity classification algorithm for energy expenditure estimation.
The Microchip PIC24FJ64GA002 was selected for the MCU module. The MCU module is responsible for the following tasks: 1) timing flow control (regularly retrieving data from the sensor module via the I2 C bus from the accelerometers or from the 12-bit A/D converter embedded in the MCU from the ECG sensor), 2) wireless communication control, and 3) peripheral component control. The wireless communication module includes a Nordic nRF24L01+ wireless RF transceiver and a BTM-162 Bluetooth module. The Nordic nRF24L01+ wireless RF transceiver is employed to execute timing synchronization and data transmission from the motion sensors and ECG sensor. The BTM-162 Bluetooth module serves as the standard communication channel between the wearable sensor module and standard devices such as PCs or smart phones. The storage module employed in the wearable sensor module is an MXIC MX25L128 flash memory with a 16-MB storage capacity. In order to achieve high performance and low power consumption, we selected the Microchip PIC24FJ64GA002 as the main controller. The sampling rates fs of the motion sensors and ECG sensor are 30 Hz with 8-bit data resolution and 200 Hz with 12-bit data resolution. The power consumption of the motion sensors and ECG sensor is 12.2 and 20 mA, respectively. The sizes of the motion sensors and the ECG sensor are 32 mm × 30 mm × 5 mm and 35 mm × 19 mm × 6 mm, respectively. III. NEURAL-NETWORK-BASED ACTIVITY CLASSIFICATION ALGORITHM The proposed NN-based activity classification algorithm for energy expenditure estimation includes procedures for data collection, data preprocessing, activity classification, feature selection, and the construction of EER models using NNs (see Fig. 3). Initially, the data collection process collects users’ acceleration and ECG signals through the wearable sensor modules. The collected signals are stored in the memory of each sensor module and are transmitted to a PC via the Bluetooth communication protocol. Please note that the processes of data preprocessing, activity classification, feature selection, and EER model construction using NNs are all executed on a PC. Data preprocessing includes a calibration process and a noise removal process for acceleration signals, a HR retrieval process for ECG signals, a windowing process, and a feature generation process. The calibration process eliminates drift error and offset. The purpose of noise removal is to reduce the effect of
baseline drift and high-frequency noise of the collected acceleration signals. The HR retrieval process obtains the HR series from ECG signals in order to extract important features for subsequent activity classification and EER model construction. The windowing process is used to segment the acceleration signals and HR series into consecutive windows for feature generation. After the windowing process, the feature generation process generates statistical features from the acceleration signals and HR series for activity classification and EER model construction. The purpose of activity classification is to construct EER models for activities of different levels of intensity in order to achieve more accurate energy expenditure estimation. After the data preprocessing process, SFS and SBS are used for feature selection in order to select significant features for more efficiently constructing EER models using NNs. Finally, an RBFN and a GRNN are utilized for developing the EER models. RBFN and GRNN regression models are responsible for predicting the metabolic equivalent task (MET) of participants. A. Data Preprocessing The procedure of data preprocessing includes a calibration and a noise removal process for acceleration signals, HR retrieval process, windowing process, and a feature generation process. The details of each process are provided in the following sections. 1) Calibration Process: A scale factor and a bias are commonly used in the calibration of accelerometers. The scale factor represents the ratio of change in the motion sensor output to change in the motion sensor input, and the bias represents the average motion sensor output over a specific time. When the motion sensor is stationary, each axis should contain only the gravitational acceleration. Based on this fact, the scale factor and bias factor of each individual motion sensor can be obtained. In this study, the acceleration signals collected from the motion sensors were calibrated based on the scale factor and bias. A detailed procedure can be found in our previous study [24]. 2) Noise Removal and HR Retrieval Process: In order to reduce the effect of baseline drift and high-frequency noise, the collected acceleration signals were sent to an elliptic highpass filter (fc = 0.05 Hz) and a Hanning low-pass filter (fc = 10 Hz). Unlike the acceleration signals, the ECG signal cannot be directly utilized in the feature generation process. A real-time QRS detection algorithm [25] was utilized to detect the R wave
994
IEEE TRANSACTIONS ON INFORMATION TECHNOLOGY IN BIOMEDICINE, VOL. 16, NO. 5, SEPTEMBER 2012
(the positive upward deflection in the QRS complex of an ECG that follows the Q wave) in the ECG signal to form the HR series. The processed acceleration signals and HR series were sent to the windowing process for further analysis. 3) Windowing Process: The energy expenditure estimation problem is typically estimated on a minute-by-minute basis. We segmented the acceleration signals and HR series into a sequence of consecutive 1-m windows. Subsequently, the windowed acceleration signals and HR series were sent to the feature generation process. 4) Feature Generation Process: In this study, all participants were instructed to wear three motion sensors located on their wrist, waist, and ankle. A total of 12 features were acquired from the motion sensors [four features were generated for each sensor (wrist, waist, and ankle): 1) count; 2) mean signal magnitude area (SMA); 3) standard deviation of SMA; and 4) median SMA)]. The definitions of these features are explained as follows. More features can be found in [26]. Count is frequently used in energy expenditure estimation problems due to its simple computation and effectiveness in discriminating different activity intensity levels. The value of count can be obtained by taking the summation of the SMA in each window, where SMA is the square root of the summation of the filtered acceleration signal. The mean SMA is obtained by averaging the SMA values. The mean SMA indicates the average intensity of each activity. The standard deviation of SMA is used to measure the variance in SMA values. The median of SMA is the value that is in the middle of a set of data. That is, the median value separates the upper half of the data from the lower half. In addition to the features derived from the acceleration signal, nine features were derived from the HR series: 1) mean HR, 2) standard deviation of HR, 3) variance of HR, 4) interquartile range of HR, 5) skew of HR, 6) kurtosis of HR, 7) mean of HR difference series, 8) standard deviation of HR difference series, and 9) variance of HR difference series. The HR difference series indicates the difference of successive HR values. The definition of HR difference series is defined as follows: if the original HR series is HR = {HR1 , HR2 , HR3 , . . . , HRn −1 , HRn }, the HR difference series is stated as HRD = {(HR2 − HR1 ), (HR3 − HR2 ), . . . , (HRn − HRn −1 )}.
B. Activity Categorization and Classification Using Decision Trees In order to increase the accuracy of the EER model, we categorized activities into groups of similar intensity. In this study, 14 activities were analyzed and categorized into three types according to the intensity of HR and the MET, as shown in Table II. From this table, the average HR for Type 1 activities is lower than 95 beats per minute (bpm), and the average MET is lower than 1.5; thus, Type 1 represents sedentary activities. The average HR of Type 3 is higher than 130 bpm and the average MET is higher than 6; therefore, Type 3 activities are regarded as vigorous activities. Type 2 represents activities involving moderate exertion.
TABLE II TYPES OF ACTIVITIES AND THEIR CORRESPONDING AVERAGE HR AND MET
A set of features was selected in order to construct an EER model for each type of activities. A binary decision tree based on Gini’s diversity index was employed to classify activities into several types. A decision was obtained by repeated splits of subsets of input data into two descendant subsets. Gini’s diversity index, a measure of node impurity, was selected as the criterion for choosing a split. Impure nodes with less than ten data points were considered as terminal nodes [27]. The activity classification results for the decision tree can be found in Section IV. C. Feature Selection SFS and SBS were employed in the feature selection of this study. SFS and SBS are feature selection techniques that attempt to find a subset of n features out of m features (m > n) so that the selection of features can maximize the performance of a criterion function. SFS starts with an empty set and adds features consecutively, which are sent to the criterion function to examine its effectiveness. At each step, one feature is selected from the remaining feature subset under the condition that its inclusion results in the best combined performance with the already selected feature subset in terms of the criterion function. The selected features are used to construct an EER model and the mean squared error (MSE) is employed to evaluate the performance of the criterion function. The search direction of SBS is opposite to that of SFS. SBS starts with the entire set of features, and then iteratively deletes features based on the combined performance of the criterion function. D. Neural Networks for the Construction of EER Models In this study, an RBFN and a GRNN were employed in the regression models for estimation of MET. The advantages of using RBFN include structure simplicity and training efficiency. The simplicity of RBFN is also a benefit for integrating the RBFN structure into an embedded system such as a field programmable gate array. In addition, some studies have shown that GRNN is adept at universal approximation, which is an attractive characteristic for regression models. In order to compare their performance and recommend one of the models for
LIN et al.: WEARABLE SENSOR MODULE WITH A NEURAL-NETWORK-BASED ACTIVITY CLASSIFICATION ALGORITHM
embedded system implementation, the estimation performance of RBFN and GRNN were compared in Section IV. 1) Energy Expenditure Obtained by MET: The MET is a measure, which represents the energy cost of physical activities. MET is defined as the ratio of a physical activity to reference metabolic rate [10]. One MET is defined as kcal/kg/hour. One MET is defined as the resting metabolic rate obtained during quiet sitting. MET is used as a means of expressing the intensity and energy expenditure of activities among persons of different weights. The energy expenditure of a person can be obtained by multiplying his/her weight, the duration of activity, and the corresponding MET. 2) Radial Basis Function Network: The architecture of an RBFN and the proof of its universal approximation can be found in [21]. RBFNs consist of three layers: an input layer, a hidden layer, and an output layer. The nodes in the input layer are responsible for transmitting the input vector to the nodes in the hidden layer. In the hidden layer, each node in this layer represents a radial basis function. The nodes in the output layer of an RBFN perform a summation of weighted outputs from the hidden layer. 3) Generalized Regression Neural Network: For regression problems, GRNNs have been successfully developed to estimate the joint probability density function of input x and output y [12]. GRNNs not only have overall situation approximation, but also have optimum approximation capability. A GRNN consists of three layers: an input layer, a RBFN layer with normal distribution functions centered at training samples, and a linear output layer, and is adopted for regression of the MET model in this paper. IV. EXPERIMENTAL DESIGN AND RESULTS The effectiveness of the wearable sensor module and the accuracy of the proposed NN-based activity classification algorithm for energy expenditure estimation were examined by the following experimental design. Twenty six college students were recruited and asked to perform the 14 activities listed in Table II. During the experiment, each participant wore a gas analyzer (K4b2 ) and the wearable sensor module. The gas analyzer was used to calculate the participants’ energy expenditure, while the wearable sensor module was used to collect accelerometer signals during the activities. A detailed experimental design and an evaluation of the proposed NN-based activity classification algorithm for energy expenditure estimation are presented in the following sections. A. Experimental Design Twenty six healthy college students (20 males and 6 females) with a mean age of 22.18 ± 2.94 were recruited to join our experiment. Participants were all nonsmokers and free from diseases that may affect their metabolic rate. Participant demographics are shown in Table III. In our experimental procedure, personal information was first collected (including height, weight, gender, and age). Then the participants were instructed to wear the data collection instruments, including a Cosmed K4b2 portable gas analyzer and a wearable sensor module system. The Cosmed
995
TABLE III DEMOGRAPHICS OF PARTICIPANTS
TABLE IV ACTIVITY RECOGNITION RESULTS OF TENFOLD CROSS VALIDATION
K4b2 portable gas analyzer was used to measure participants’ energy expenditure on a breath-by-breath basis. Energy expenditure was measured by the gas analyzer as the difference between oxygen consumption and oxygen production. In addition to energy expenditure, the Cosmed K4b2 portable gas analyzer also provides HR series data, measured by a Polar HR electrode, allowing data synchronization between HR and energy expenditure. The participants performed each activity for 6 min, taking a rest of at least 5 min between activities to ensure their HRs were lower than 100 bpm. B. Recognition Results for Activity Classification A decision tree was employed for activity classification in this study. Data from fourteen activities were collected and categorized into three groups of similar intensity, as summarized in Table II. A decision tree was used to classify three groups of activities according to their features. Twenty-one features (12 features derived from the acceleration signals and 9 features derived from the HR series) were employed as the input of the activity classifier. In our classification, threefold, fivefold, eightfold, and tenfold cross validations were conducted. The recognition accuracies using decision trees in the cross validations were 95.52%, 95.66%, 96.15%, and 97.70%, respectively. The confusion matrix of the tenfold cross validation is shown in Table IV. C. Energy Expenditure Estimation by RBFN A total of 23 features were used as feature candidates for the EER model, 12 features derived from the acceleration signals, nine features derived from the HR series, and two personal information features (including weight and height). SFS and SBS were employed as search strategies and the reciprocal of the MSE of the constructed EER model was selected as the criterion function. The number of selected features in the SFS and SBS processes was set from 1 to 7. This setting was used to examine the relationship between the number of features and the performance of different EER models. The selected features obtained by SFS and SBS for estimating the performance of an RBFN as the criterion function are shown in Tables V and VI. After the feature selection process, the performance of the EER model using the RBFN with the selected features was eval-
996
IEEE TRANSACTIONS ON INFORMATION TECHNOLOGY IN BIOMEDICINE, VOL. 16, NO. 5, SEPTEMBER 2012
TABLE V THE SELECTED FEATURES OF THE RBFN BASED ON SFS
TABLE VII COMPARISON BETWEEN ACTUAL AND ESTIMATED ENERGY EXPENDITURE
TABLE VI THE SELECTED FEATURES OF THE RBFN BASED ON SBS
TABLE VIII THE SELECTED FEATURES OF THE GRNN BASED ON SFS AND SBS
Fig. 4. The SEE of the RBFN for EER models based on SFS and SBS strategies with different numbers of selected features.
Fig. 6. The SEE of the GRNN for EER models based on SFS/SBS with different numbers of selected features.
D. Energy Expenditure Estimation by GRNN
Fig. 5. The R 2 of the RBFN for EER models based on SFS and SBS strategies with different numbers of selected features.
uated. The performance evaluation was based on the standard error of the estimate (SEE) and the coefficient of determination R2 between actual energy expenditure and estimated energy expenditure. The SEE and R2 of the RBFN with the top seven features are shown in Figs. 4 and 5. From these two figures, we can observe that the accuracy of the SBS strategy is better than that of SFS in terms of both SEE and R2 . In order to examine the difference between the measured and estimated energy expenditure of each activity, Table VII presents the average energy expenditure of each activity for all participants in this study.
The selected features based on SFS and SBS with the performance of a GRNN are shown in Table VIII. The features selected by the SFS and SBS methods were identical in this experiment. From Table VIII, it is observed that most of the features selected for all types included frequently used features: counts from the wrist, waist, and ankle. HR, difference of HR, and variance of HR were also selected in the EER model for all types. The SEE and R2 of the GRNN using the top seven features are shown in Figs. 6 and 7. Fig. 6 shows that the SEE is under 0.1 for all types of activities when the number of features selected is greater than 3. Likewise, Fig. 7 shows that the R2 is greater than 0.9 when the number of features selected is greater than 3. For individual tests, the average SEE is 0 and average R2 is 1. Table IX indicates the superior regression performance of the GRNN compared to that of the RBFN. Comparing with the linear regression models of energy expenditure proposed in [3],
LIN et al.: WEARABLE SENSOR MODULE WITH A NEURAL-NETWORK-BASED ACTIVITY CLASSIFICATION ALGORITHM
Fig. 7. The R 2 of the GRNN for EER models based on SFS/SBS with different numbers of selected features. TABLE IX SEE AND R 2 FOR ENERGY EXPENDITURE PREDICTION BY TWO NETWORKS BASED ON SEVEN FEATURES
we can see that using RBFNs and GRNNs with a few selected features can achieve better performance. V. CONCLUSION A wearable sensor system consisting of an activity sensor module, an ECG module, and an NN-based activity classification algorithm for energy expenditure estimation have been presented in this paper. The proposed NN-based activity classification algorithm for energy expenditure estimation consists of procedures for data collection, data preprocessing, activity classification, feature selection, and the construction of EER models using NNs. Activity classification was conducted by means of decision trees in order to categorize fourteen activities into three groups of similar intensity. To construct an efficient regression model with the least number of features and sufficient predictive accuracy, SFS, and SBS strategies were employed as feature selection techniques. Two representative NNs, RBFN, and GRNN, were employed in the regression model for energy expenditure estimation. In our experiments, GRNN outperformed RBFN. The SEE and R2 of the RBFN regression model using the top seven features yielded SEE values of 0.24, 0.45, and 0.64 and R2 values of 0.39, 0.82, and 0.87 for Types 1, 2, and 3 activities, respectively. The SEE and R2 for the GRNN regression model using the top three features resulted in SEE values of 0.08, 0.00, and 0.00, and R2 values of 0.93, 1.00, and 1.00 for Types 1, 2, 3 activities, respectively. Based on these results, we have successfully validated the effectiveness of the proposed sensor system and algorithm. REFERENCES [1] [Online] Available: http://www.health.state.ny.us/diseases/chronic/cvd. htm [2] M. P. Rothney, E. V. Schaefer, M. M. Neumann, L. Choi, and K. Y. Chen, “Validity of physical activity intensity predictions by actigraph, actical, and rt3 accelerometers,” Obesity, vol. 16, pp. 1946–1952, 2008. [3] S. Crouter, J. Churilla, and D. Bassett, “Estimating energy expenditure using accelerometers,” Eur. J. Appl. Physiol., vol. 98, pp. 601–612, 2006.
997
[4] D. R. Bassett, Jr., B. E. Ainsworth, A. M. Swartz, S. J. Strath, W. L. O’Brien, and G. A. King, “Validity of four motion sensors in measuring moderate intensity physical activity,” Med. Sci. Sports Exercise, vol. 32, pp. S471–S480, 2000. [5] K. Y. Chen and M. Sun, “Improving energy expenditure estimation by using a triaxial accelerometer,” J. Appl. Physiol., vol. 83, pp. 2112–2122, 1997. [6] S. Brage, N. Brage, P. W. Franks, U. Ekelund, and N. J. Wareham, “Reliability and validity of the combined heart rate and movement sensor actiheart,” Eur. J. Clin. Nutrition, vol. 59, pp. 561–570, 2005. [7] J. M. Jakicic, M. Marcus, K. I. Gallagher, C. Randall, E. Thomas, F. L. Goss, and R. J. Robertson, “Evaluation of the sensewear pro armband to assess energy expenditure during exercise,” Med. Sci. Sports Exercise, vol. 36, pp. 897–904, 2004. [8] A. M. Swartz, S. J. Strath, D. R. Bassett, Jr., W. L. O’Brien, G. A. King, and B. E. Ainsworth, “Estimation of energy expenditure using csa accelerometers at hip and wrist sites,” Med. Sci. Sports Exercise, vol. 32, pp. S450–S456, 2000. [9] D. P. Heil and N. J. Klippel, “Validation of energy expenditure prediction algorithms in adolescents and teens using the actical activity monitor,” Med. Sci. Sports Exercise, vol. 35, pp. S285, 2003. [10] B. Weber, I. Hermanns, R. Ellegast, and J. Kleinert, “A person-centered measurement system for quantification of physical activity and energy expenditure at workplaces,” Ergonomics Health Aspects Work Comput., vol. 5624, pp. 121–130, 2009. [11] K. H. Schmitz, M. Treuth, P. Hannan, R. McMurray, K. B. Ring, D. Catellier, and R. Pate, “Predicting energy expenditure from accelerometry counts in adolescent girls,” Med. Sci. Sports Exercise, vol. 37, pp. 155– 161, Jan. 2005. [12] D. M. Karantonis, M. R. Narayanan, M. Mathie, N. H. Lovell, and B. G. Celler, “Implementation of a real-time human movement classifier using a triaxial accelerometer for ambulatory monitoring,” IEEE Trans. Inf. Technol. Biomed., vol. 10, no. 1, pp. 156–167, Jan. 2006. [13] A. M. Khan, Y.-K. Lee, S. Y. Lee, and T.-S. Kim, “A triaxial accelerometerbased physical-activity recognition via augmented-signal features and a hierarchical recognizer,” IEEE Trans. Inf. Technol. Biomed., vol. 14, no. 5, pp. 1166–1172, Sep. 2010. [14] D. Curone, G. M. Bertolotti, A. Cristiani, E. L. Secco, and G. Magenes, “A real-time and self-calibrating algorithm based on triaxial accelerometer signals for the detection of human posture and activity,” IEEE Trans. Inf. Technol. Biomed., vol. 14, no. 4, pp. 1098–1105, Jul. 2010. [15] M.-W. Lee, A. M. Khan, and T.-S. Kim, “A single tri-axial accelerometerbased real-time personal life log system capable of human activity recognition and exercise information generation,” Personal Ubiquitous Comput., vol. 15, pp. 887–898, 2011. [16] D. Curone, A. Tognetti, E. L. Secco, G. Anania, N. Carbonaro, D. De Rossi, and G. Magenes, “Heart rate and accelerometer data fusion for activity assessment of rescuers during emergency interventions,” IEEE Trans. Inf. Technol. Biomed., vol. 14, no. 3, pp. 702–710, May 2010. [17] L. Palmerini, L. Rocchi, S. Mellone, F. Valzania, and L. Chiari, “Feature selection for accelerometer-based posture analysis in parkinson’s disease,” IEEE Trans. Inf. Technol. Biomed., vol. 15, no. 3, pp. 481–490, May 2011. [18] M. P. Rothney, M. Neumann, A. B´eziat, and K. Y. Chen, “An artificial neural network model of energy expenditure using nonintegrated acceleration signals,” J. Appl. Physiol., vol. 103, pp. 1419–1427, 2007. [19] J. Staudenmayer, D. Pober, S. Crouter, D. Bassett, and P. Freedson, “An artificial neural network to estimate physical activity energy expenditure and identify physical activity type from an accelerometer,” J. Appl. Physiol., vol. 107, pp. 1300–1307, 2009. [20] P. Pudil, J. Novoviˇcov´a, and J. Kittler, “Floating search methods in feature selection,” Pattern Recogn. Lett., vol. 15, pp. 1119–1125, 1994. [21] J. Park and I. W. Sandberg, “Universal approximation using radial-basisfunction networks,” Neural Comput., vol. 3, pp. 246–257, 1991. [22] D. F. Specht, “A general regression neural network,” IEEE Trans. Neural Netw., vol. 2, no. 6, pp. 568–576, Nov. 1991. [23] [Online] Available: http://www.dynadx.com/Holter/brochure.pdf [24] J.-S. Wang, Y.-L. Hsu, and J.-N. Liu, “Inertial-measurement-unit-based pen with a trajectory reconstruction algorithm and its applications,” IEEE Trans. Ind. Electron., vol. 57, no. 10, pp. 3508–3521, Oct. 2010. [25] J. Pan and W. J. Tompkins, “A real-time QRS detection algorithm,” IEEE Trans. Biomed. Eng., vol. 32, pp. 230–236, 1985. [26] T. E. Munguia, “Using Machine Learning for Real-time Activity Recognition and Estimation of Energy Expenditure,” Ph.D. dissertation, Massachusetts Institute of Technology, Cambridge, MA, 2008. [27] L. Breiman, J. Friedman, R. Olshen, and C. Stone, Classification and Regression Trees. Boca Raton, FL: CRC Press, 1984.
998
IEEE TRANSACTIONS ON INFORMATION TECHNOLOGY IN BIOMEDICINE, VOL. 16, NO. 5, SEPTEMBER 2012
Che-Wei Lin received the Ph.D. degree in electrical engineering from the National Cheng Kung University, Tainan, Taiwan, in 2011. He is currently a Postdoctoral Fellow in electrical engineering in the Department of Electrical Engineering, National Cheng Kung University. His research interests include intelligent control and biomedical signal analysis.
Jeen-Shing Wang (S’94–M’02) received the B.S. and M.S. degrees in electrical engineering from the University of Missouri, Columbia, in 1996 and 1997, respectively, and the Ph.D. degree from Purdue University, West Lafayette, IN, in 2001. He is currently a Professor in the Department of Electrical Engineering, National Cheng Kung University, Tainan, Taiwan. His research interests include computational intelligence, intelligent control, clustering analysis, and optimization.
Ya-Ting C. Yang received the Ph.D. degree in education from Purdue University in 2002. She is currently an Associate Professor at the Institute of Education and Centre for Teacher Education, National Cheng Kung University, Taiwan. Her research interests are in the areas of educational research, development of higher order thinking skills, information and communications technology (ICT) for improving teaching and learning processes, and bio-signal technologies for innovative education.
Yi-Ching Yang received the M.D. degree from the College of Medicine, National Taiwan University, Taipei, Taiwan, in 1987, and the M.P.H. degree from the School of Public Health, Harvard University, Boston, MA, in 2001. He is currently an Associate Professor in the Department of Family Medicine, National Cheng Kung University, Tainan, Taiwan.