Peer Reviewed Title: Abundance Trends, Distribution, and Habitat Associations of the Invasive Mississippi Silverside (Menidia audens) in the Sacramento–San Joaquin Delta, California, USA Journal Issue: San Francisco Estuary and Watershed Science, 14(1) Author: Mahardja, Brian Conrad, J. Louise, Division of Environmental Sciences California Department of Water Resources Lusher, Lester, Department of Economics University of California, Davis Schreier, Brian, Division of Environmental Services California Department of Water Resources Publication Date: 2016 Permalink: http://escholarship.org/uc/item/55f0s462 Acknowledgements: This study was completed under the auspices of the Interagency Ecological Program. We thank J. Speegle, along with the past and present staff of the U.S. Fish and Wildlife Service DJFMP, for their work, which made this study possible. We also thank A. Hennessy for providing us with the zooplankton abundance data, as well as S. Waller and S. Lesmeister for the long-term discrete water quality data (along with California Department of Fish and Wildlife and CDWR crew who participated in the two monitoring programs). Additionally, we would like to acknowledge the staff of the California Department of Water Resources' Division of Environmental Services for providing various support to the study, including (but not limited to): J. Agundes, S. Batmanghilich, H. Carlson, M. Dempsey, J. Frantzich, K. Gehrts, P. Goertler, K. Hoffman, N. Ikemiyagi, K. Jones, A. Munguia, D. Messer, M. Ogaz, O. Patton, S. Spaar, L. Takata, and A. Tung. We are also grateful for the comments of M. Nobriga, L. Brown, T. Sommer, and two anonymous referees whose reviews substantially improved the manuscript. Keywords: Mississippi Silverside, Menidia audens, invasive species biology, littoral fish, life history Local Identifier: jmie_sfews_30407 Abstract: doi: http://dx.doi.org/10.15447/sfews.2016v14iss1art2
eScholarship provides open access, scholarly publishing services to the University of California and delivers a dynamic research platform to scholars worldwide.
Although many alien fish species have colonized the Sacramento–San Joaquin Delta (Delta), few are as pervasive and abundant as Mississippi Silversides (Menidia audens). Moreover, Mississippi Silversides are hypothesized to be an intra-guild predator of the endangered Delta Smelt (Hypomesus transpacificus). Because of their prevalence in the Delta and poten-tial predation on Delta Smelt, Mississippi Silversides may have far-reaching effects on both the aquatic ecosystem and conservation management policies of the region. Yet little is known about how Mississippi Silverside abundance and distribution have changed within the Delta, or how they respond to various habitat attributes such as temperature, turbidity, and flow. We examined 19 years of beach seine survey data to evaluate how the abundance and distribution of Mississippi Silversides has changed over the years, characterize their habitat associations, and determine the environmental factors that predict their annual cohort strength. Concurrent with the decline of sev-eral pelagic fish species in the San Francisco Estuary in the early 2000s, we observed a significant increase in Mississippi Silverside catch that was accompanied by a moderate distributional shift in which densi-ties increased in the western Delta region. We also found that the occurrence of this highly prolific alien species was associated with higher water tempera-ture, higher turbidity, relatively low conductivity, and moderate to high levels of dissolved oxygen. Lastly, we demonstrated that freshwater input to the Sacramento–San Joaquin Delta during the summer and water exports during the spring months were both negatively correlated with the annual cohort size of Mississippi Silversides in the region. Our study identified the environmental variables deserv-ing additional attention in future studies involving Mississippi Silverside and suggests that the species favors habitat conditions that are likely to be detri-mental for pelagic species such as Delta Smelt. Supporting material: Additional Information on Data Configuration, Similarity Profile Clustering Analysis, and Model Selection Process Copyright Information:
Copyright 2016 by the article author(s). This work is made available under the terms of the Creative Commons Attribution4.0 license, http://creativecommons.org/licenses/by/4.0/
eScholarship provides open access, scholarly publishing services to the University of California and delivers a dynamic research platform to scholars worldwide.
MARCH 2016
RESEARCH
Abundance Trends, Distribution, and Habitat Associations of the Invasive Mississippi Silverside (Menidia audens) in the Sacramento–San Joaquin Delta, California, USA Brian Mahardja1, J. Louise Conrad1, Lester Lusher2, and Brian M. Schreier1
Volume 14, Issue 1 | Article 2 doi: http://dx.doi.org/10.15447/sfews.2016v14iss1art2
* Corresponding author:
[email protected] 1 Division of Environmental Services California Department of Water Resources West Sacramento, CA 95691 USA 2 Department of Economics University of California , Davis Davis, CA 95616 USA
ABSTRACT Although many alien fish species have colonized the Sacramento–San Joaquin Delta (Delta), few are as pervasive and abundant as Mississippi Silversides (Menidia audens). Moreover, Mississippi Silversides are hypothesized to be an intra-guild predator of the endangered Delta Smelt (Hypomesus transpacificus). Because of their prevalence in the Delta and potential predation on Delta Smelt, Mississippi Silversides may have far-reaching effects on both the aquatic ecosystem and conservation management policies of the region. Yet little is known about how Mississippi Silverside abundance and distribution have changed within the Delta, or how they respond to various habitat attributes such as temperature, turbidity, and flow. We examined 19 years of beach seine survey data to evaluate how the abundance and distribution of Mississippi Silversides has changed over the years, characterize their habitat associations, and determine
the environmental factors that predict their annual cohort strength. Concurrent with the decline of several pelagic fish species in the San Francisco Estuary in the early 2000s, we observed a significant increase in Mississippi Silverside catch that was accompanied by a moderate distributional shift in which densities increased in the western Delta region. We also found that the occurrence of this highly prolific alien species was associated with higher water temperature, higher turbidity, relatively low conductivity, and moderate to high levels of dissolved oxygen. Lastly, we demonstrated that freshwater input to the Sacramento–San Joaquin Delta during the summer and water exports during the spring months were both negatively correlated with the annual cohort size of Mississippi Silversides in the region. Our study identified the environmental variables deserving additional attention in future studies involving Mississippi Silverside and suggests that the species favors habitat conditions that are likely to be detrimental for pelagic species such as Delta Smelt.
KEY WORDS Mississippi Silverside, invasive species biology, Menidia audens, littoral fish, life history
SAN FRANCISCO ESTUARY & WATERSHED SCIENCE
VOLUME 14, ISSUE 1, ARTICLE 2
INTRODUCTION
stage Delta Smelt in the wild (Baerwald et al. 2012). To gain a better understanding of the extent of this ecological interaction between Delta Smelt and Mississippi Silversides, knowledge of the life history of both species is crucial. However, though multiple studies have described the biology and population dynamics of Delta Smelt (Moyle et al. 1992; Bennett 2005; Feyrer et al. 2007; Merz et al. 2011; Sommer et al. 2011; Sommer and Mejia 2013; Rose et al. 2013), little is known about the life history and habitat associations of Mississippi Silversides within the Delta. Characterizing the abundance and distribution of this invasive species with environmental factors may provide insight into what has allowed Mississippi Silverside to become so widespread and abundant in this system.
The introduction of non-native species has commonly been identified as one of the major causes of global biodiversity loss (Vitousek et al. 1996; Sala et al. 2000). This is especially apparent in the highly invaded San Francisco Estuary (estuary), where large numbers of alien species have successfully colonized (Cohen and Carlton 1998; Winder et al. 2011) while populations of native species have either declined or become extirpated (Bennett and Moyle 1996; Moyle 2002). Among the many alien fish species found within the estuary, Mississippi Silversides (Menidia audens) are one of the most widely distributed and abundant (Moyle 2002; Nobriga et al. 2005). Mississippi Silversides were first introduced in California to the Blue Lakes and Clear Lake in 1967, and following subsequent introductions, they became well-established throughout the estuary by 1975 (Cook and Moore 1970; Moyle 2002).
In this study, we describe the abundance and distribution patterns—as well as the short-term and longterm habitat associations—of Mississippi Silversides in the estuary using data available from a long-term Interagency Ecological Program (IEP) monitoring program. Our analyses focused on the Delta region, where the species is highly abundant and commonly captured in shallow-water habitat (Brown and May 2006; Brown and Michniuk 2007). Specifically, we aim to address the following questions: (1) How have the abundance and distribution of Mississippi Silversides changed over time? (2) How does the occurrence of Mississippi Silversides vary in relation to habitat parameters? (3) Which seasonal environmental variable(s) correlate well with the annual cohort strength of Mississippi Silversides?
Since 1975, Mississippi Silverside numbers appeared to increase dramatically within the Sacramento–San Joaquin Delta (Delta) portion of the estuary (Brown and May 2006; Brown and Michniuk 2007). The Delta is a complex network of interconnected channels, which forms the inland portion of the estuary (Whipple et al. 2012). This apparent increase of Mississippi Silverside abundance was concurrent with the severe declines of several pelagic fish species (Sommer et al. 2007) in the estuary. Within this group of declining pelagic fish species, Delta Smelt (Hypomesus transpacificus), a euryhaline pelagic fish species, are of particular interest. Low abundance indices in the past few decades led to the listing of Delta Smelt under both the California and United States Endangered Species Acts (USFWS 1993). Multiple interacting stressors are implicated in this species' precipitous decline (Baxter et al. 2010; MacNally et al. 2010), and predation by non-native species has been identified as a potential contributing factor (Sommer et al. 2007).
METHODS Study Area The Sacramento–San Joaquin Delta is a complex, highly altered tidal channel network that forms the upstream-most portion of the San Francisco Estuary. Though it was once a dynamic system of tidal floodplains and marshes shaped by the flows of the Sacramento and San Joaquin rivers, the Delta’s wetlands have been diked and filled extensively over the past two hundred years, turning it into a highly modified tidal freshwater ecosystem with over 1,000 miles of levees (Lund et al. 2008; Whipple et al. 2012). However, the 3,000 km2 network of tidal channels within the Delta still contains a diversity of habitats,
Mississippi Silversides have been hypothesized as intra-guild predators of Delta Smelt larvae because they share similar life histories (Moyle 2002) and their diets overlap considerably (Bennett and Moyle 1996). A recent investigation of the presence of Delta Smelt DNA in the stomach contents of Mississippi Silversides confirmed that they prey on early life2
MARCH 2016
Data Analysis
from wide and deep shipping channels maintained by dredging to narrow dead-end sloughs. Several large expanses of open water also exist in the Delta from flooding of subsided agricultural islands. In addition to the freshwater input from rivers upstream, habitat within the Delta is also heavily influenced by thousands of small agricultural water diversions, and by two major water export facilities in the south which pump water from the Delta to agricultural and urban areas in the San Joaquin Valley and southern California.
Q1: How have the abundance and distribution of Mississippi Silverside changed over the years? To first confirm that Mississippi Silversides are largely an annual species in the Delta (Moyle 2002), we plotted fork length (FL) density histograms of each month using the full data set from calendar years 1995 to 2014. The resulting FL frequency histograms confirmed that Mississippi Silversides are an annual species with a new cohort appearing in June of every year (Appendix A, Figure A-2). We therefore designated the period between June of one year and May of the following year as a “cohort year” (with each cohort named after the year it was born).
Data Source Because Mississippi Silversides are common and abundant in shallow, nearshore habitat (Matern et al. 2002; Nobriga et al. 2005; Cohen and Bollens 2008), we used the long-term beach seine survey data from the U.S. Fish and Wildlife Service’s (USFWS) Delta Juvenile Fish Monitoring Program (DJFMP) to assess their abundance and distribution in the Delta (http:// www.fws.gov/lodi/juvenile_fish_monitoring_program/ jfmp_index.htm). In the late 1970s the USFWS initiated the DJFMP with the original goal of monitoring the abundance and distribution of juvenile Chinook Salmon (Oncorhynchus tshawytscha) in the Delta (Kjelson et al. 1982). Currently, the DJFMP covers a total of 62 sites that are sampled either weekly or biweekly year-round, ranging from the Sacramento and San Joaquin rivers to the San Francisco Bay (Appendix A, Figure A-1). Sampling consists of one seine haul using a 15.2‑m × 1.3-m net with 3-mm mesh and a 1.3-m × 1.3-m bag. Upon completion of each seine haul, all fish are identified to species, counted and measured (fork length, FL, in mm). Beginning in 1985, measurements of width, depth, and length (±1 m) of area sampled are recorded to estimate the water volume (m3) swept by the beach seine. Consistent measurements of electrical conductivity (μS cm-1) and water temperature (°C) began in 1999; while the measurements of turbidity (NTU) and dissolved oxygen (mg L-1) started in 2010 or 2011, depending on the location. For this study, we analyzed only data since 1995 because this marked the first year that Delta sites were surveyed year-round.
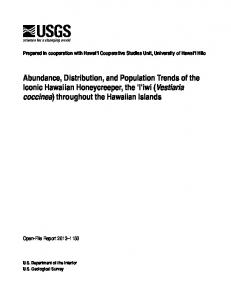
We evaluated the overall long-term abundance trend of Mississippi Silversides over the study period (1995 to 2014) by first selecting beach seine sites within the Delta that have been consistently sampled year-round since 1995, resulting in 22 sites (hereafter referred to as “index sites”) that cover a broad range of locations across the Delta (Figure 1). Though the efficiency of beach seine sampling may vary spatiotemporally to a certain extent, it should depict Mississippi Silverside’s general abundance trend in the Delta, because they are most commonly found in shallow-water, nearshore habitat (Matern et al. 2002; Nobriga et al. 2005; Cohen and Bollens 2008). To visually assess the trend of abundance over time, catch per unit effort (CPUE) data (in this case, in cubic meters) were collapsed to a monthly mean, averaged across all 22 index sites, and plotted against time (Wickham 2009). We then took the average CPUE for each cohort year and performed Kendall’s tau rank correlation test using R (R Core Team 2014) to evaluate whether the species’ abundance trend (if any) was statistically significant (see Appendix A, Table A-1 for a full summary on how the data was configured for each analysis). We also investigated spatiotemporal patterns in Mississippi Silverside CPUE across sites within the Delta over the study period (1995–2014) through non-metric multidimensional scaling ordination (NMDS) and similarity profile (SIMPROF) permutation test in the Primer 7 software (Clarke 1993; Clarke et al. 2008, 2014). We calculated the average cohort-year CPUE for each index site and subse-
3
http://dx.doi.org/10.15447/sfews.2016v14iss1art2
SAN FRANCISCO ESTUARY & WATERSHED SCIENCE
VOLUME 14, ISSUE 1, ARTICLE 2
Figure 1 Overview map of the Sacramento–San Joaquin Delta with the 22 Mississippi silverside index beach seine sites (other non-index sites not shown)
4
MARCH 2016
dictor variables, a smaller time-frame was covered (2011 to 2014) for this specific analysis (Appendix A, Table A-1). We performed analyses in R (R Core Team 2014) using the mgcv package (Wood 2011). Smoothing parameters were estimated by the unbiased risk estimator criterion, and gamma was set to 1.4 to limit over-fitting to the data (Wood 2006).
quently square-root transformed the data to reduce the influence of sites with exceedingly high numbers of Mississippi Silverside. We then constructed a Euclidean distance matrix for the various cohorts and grouped them by using the SIMPROF permutation test (Clarke et al. 2008). The SIMPROF test searches for evidence of hierarchical clustering within the data by way of permutations. We performed 1,000 permutations with the significance threshold set at 0.01. We then visualized the resulting SIMPROF groups and resemblance matrix via NMDS (Field et al. 1982; Clarke 1993). To find which particular sites were driving the differences between the SIMPROF groups, we used the similarity percentage routine (SIMPER) analysis with a cutoff percentage of 70% (Clarke 1993; Clarke and Warwick 1994). We also calculated Pearson correlations between the square-root transformed data and the two NMDS axes and plotted them on the NMDS to view the directionality of select sites. To avoid excessive overlapping of correlation vectors and points, we only overlaid onto the NMDS vectors for sites or variables that correlated at > 0.8. Each Mississippi Silverside cohort plotted on the NMDS was color-coded by its associated California Department of Water Resources' (CDWR) Sacramento Valley water year index (http://cdec.water.ca.gov/cgiprogs/iodir/WSIHIST) to visualize how each cohort’s distribution varied by water year type.
We converted Mississippi Silverside count data to occurrence (presence–absence) data to reduce the influence of outliers (i.e., extremely anomalous abundance values) and bias associated with year-to-year variation in abundance. Water quality data used were those measured concurrently with DJFMP fish sampling (water temperature, electrical conductivity, turbidity, and dissolved oxygen level). We removed outliers for certain variables (conductivity ≥ 45,00 μS cm-1, t urbidity ≥ 200 NTU, and dissolved o xygen ≥ 20 mg L-1) from this analysis. To reduce seasonal effects when elucidating the relationship between temperature and Mississippi Silverside occurrence, we used deviance from expected temperature in place of the measured temperature in our GAM analysis. We first constructed expected daily temperature model by fitting a quadratic regression model on water temperature by Julian day using the DJFMP data set. The resulting model has an adjusted R2 of 0.79 and is as follows (where y is predicted temperature and x is Julian day):
Q2: How does the occurrence of Mississippi Silversides vary in relation to habitat parameters?
y = −0.000433( x 2 ) + 0.168( x ) + 4.63
The broad spatio-temporal coverage of the DJFMP beach seine survey data set allowed for the quantification of Mississippi Silverside occurrence in nearshore habitat relative to a variety of habitat parameters. We used generalized additive models (GAMs; smoother = cubic spline) with a binomial error structure to explore the relationships between Mississippi Silverside occurrence and measured water quality variables. GAMs are extensions of generalized linear models (GLM), which use a sum of smooth functions of covariates to depict potentially non-linear relationships between response and explanatory variables (Wood 2006). To cover a wider range of variation for these habitat variables, all DJFMP sites were used in this portion of the study. However, because GAM does not allow for any null value in the pre-
We then calculated deviance from expected temperature by subtracting the measured temperature from the predicted/expected temperature (in °C) based on the model. We constructed he final GAM using the backward stepwise approach of removing non-significant terms (α = 0.01) from the full model.
Q3: Does Mississippi Silverside cohort strength correlate with any seasonal environmental variable(s)? Population level associations between Mississippi Silversides and biotic or abiotic habitat variables have yet to be described for the Sacramento–San Joaquin Delta. We used GLM in R (R Core Team 2014) with glmulti package (Calcagno 2013) to 5
http://dx.doi.org/10.15447/sfews.2016v14iss1art2
SAN FRANCISCO ESTUARY & WATERSHED SCIENCE
VOLUME 14, ISSUE 1, ARTICLE 2
determine if and which seasonal habitat metrics best predict Mississippi Silverside cohort strength in the Delta. We calculated the annual cohort strength of Mississippi Silverside by taking the mean CPUE across the previously described 22 index sites for each cohort year (beginning from June of one year and ending at May of the following year) within the study period (1995 to 2013; 19 cohorts in total). We then used these annual cohort strength indices as the response variable in our GLM model building process. We tested for the presence of temporal auto-correlation in our response variable by way of auto-correlation function plot, and found it to be non-significant (α = 0.05).
Delta water exports (cfs), water temperature (°C), Secchi depth (cm), cyclopoid copepod abundance (catch per m3), and calanoid copepod abundance (catch per m3) (Table 1). It has been previously shown that estuarine species respond strongly to interannual variability in freshwater flow (Jassby et al. 1995; Kimmerer 2002), though this has yet to be evaluated for Mississippi Silversides. Water diversion projects within the Delta can alter the hydrodynamics of the region and have been shown to entrain a sizeable number of Mississippi Silversides in certain years (Grimaldo et al. 2009). Water temperature and turbidity may be important for Mississippi Silversides on a longer time scale based on our GAM analysis results (Question 2 above) and previous studies (Moyle 2002). We selected the two classes of copepods as possible factors because of past studies that suggested
Covariates tested in this analysis include total Delta inflow (cubic feet per second; cfs), combined south
Table 1 Definition, data source, and range of values for the variables used in the GLM analysis Variable
Definition
Data Source
Range of values
Response variable Mississippi Silverside (Menidia audens) cohort strength
Mean catch per m3 across 22 index sites (as seen in Figure 1) for the cohort year (June of one year to May of following year)
USFWS Delta Juvenile Fish Monitoring Program
0.42 – 2.13 per m3
Covariates Spring inflow
Spring (Mar–May) total Delta inflow
14,485 – 132,467 cfs
Summer inflow
Summer (Jun–Sep) total Delta inflow
12,992 – 47,113 cfs
Spring export
Spring (Mar–May) total Delta exports and diversions/transfers
Summer export
Summer (Jun–Sep) total Delta exports and diversions/transfers
Spring water temperature
Spring (Mar–May) mean Delta water temperature
Summer water temperature
Summer (Jun–Sep) mean Delta water temperature
Spring Secchi depth
Spring (Mar–May) mean Delta Secchi depth
Summer Secchi depth
Spring (Mar–May) mean Delta Secchi depth
Spring calanoid
Spring (Mar–May) mean catch per m3 for all calanoid adults and copepods
Summer calanoid
Summer (Jun–Sep) mean catch per m3 for all calanoid adults and copepods
Spring cyclopoid
Spring (Mar–May) mean catch per m3 for all cyclopoid adults and copepods
Summer cyclopoid
Summer (Jun–Sep) mean catch per m3 for all cyclopoid adults and copepods
California DWR Dayflow Program
2,525 – 6,150 cfs 4,895 – 11,468 cfs 13.4 – 18.3 °C
IEP Discrete Water Quality Monitoring Program. Delta stations: D10, D12, D16, D22, D28A, D4, MD10A, P8
21.3 – 23.1 °C 42.6 – 100.4 cm 44.5 – 105.8 cm 92 – 1,916 per m3
6
IEP Bay–Delta Monitoring and Analysis Section Zooplankton Monitoring Program. Delta stations: NZ054, NZ060, NZ064, NZ074, NZ086, NZ092, NZD16, NZD28, NZM10.
1,823 – 4,001 per m3 110 – 1,528 per m3 1,157 – 2,850 per m3
MARCH 2016
Mississippi Silversides primarily feed on zooplanktons (Elston and Bachen 1976; Wurtsbaugh and Li 1985) and the high relative efficiencies for which these copepods are sampled.
RESULTS
Each covariate was partitioned into spring season (March to May) and summer season (June to September) to assess the relative importance of the two time periods for the various habitat variables. We acquired inflow and export data from the CDWR Dayflow data set (http://www.water.ca.gov/dayflow/). Water temperature and Secchi depth data were compiled from the IEP Discrete Water Quality Monitoring Program using nine stations covering the Delta region (Table 1; Appendix A, Figure A-1). Although electric conductivity data was available, we precluded it from the list of covariates as it was strongly correlated with Delta inflow (Jassby et al. 1995). We acquired calanoid and cyclopoid catch data from the IEP Zooplankton Monitoring Program from nine stations within the Delta (Table 1; Appendix A, Figure A-1).
Based on the minimal CPUE in the spring months (Figure 2), and the appearance of a new cohort in the June fork length density histogram, as well as the scarcity of adults in the following July fork length density histogram (Appendix A, Figure A-2), it appears that most Mississippi Silverside adults in the Delta do not survive to a second year (in other words, the species is largely annual). On average, Mississippi Silverside CPUE appears to be the lowest in May and highest in the fall and winter months (Figure 2). Mean fork length of each new Mississippi Silverside cohort increased fairly quickly, starting at roughly 30 mm FL in June, on average, and plateauing at around 60 mm FL from November through the following April (Appendix A, Figure A-2). Mississippi Silversides rarely exceed 110 mm FL in the estuary; only 21 fish larger than 110 mm FL have been captured by the DJFMP since 1995.
Q1: How have the abundance and distribution of Mississippi Silversides changed over the years?
We evaluated collinearity between covariates by using variance inflation factor (VIF). We sequentially dropped any covariate with the highest VIF starting from the full model as suggested by Montgomery and Peck (1992) and Zuur et al. (2010) until VIF values for covariates were below 10. We removed spring calanoid abundance, summer cyclopoid abundance, and summer water export as predictor variables because of the presence of collinearity (Appendix A, Table A-2). We constructed GLMs with all possible subsets of the nine remaining predictor variables using the identity link and Gaussian error distribution. To avoid overfitting given the relatively small sample size and to simplify the interpretation of the GLM results, we did not include interaction effects. All possible models were ranked with Akaike’s Information Criterion corrected for small sample size (AICc), subsampled for the best 100 models. Resulting AICc weights from the top 100 models were used to calculate model-averaged estimates and the relative importance of terms (Burnham and Anderson 2002; Johnson and Omland 2004).
Kendall’s tau rank correlation test for yearly average Mississippi Silverside CPUE was significant at p