Bull. Min. Res. Exp. (2018) 157:?-??
BULLETIN OF THE MİNERAL RESEARCH AND EXPLORATİON http://bulletin.mta.gov.tr
GEOCHEMICAL AND PETROLOGIC EVOLUTION OF OTLAKBAŞI BASALTIC VOLCANISM TO THE EAST OF LAKE VAN Vural OYAN, Yüzüncü Yıl University, Faculty of Engineering, Department of Mining Engineering, 65080, Van 0000-0002-1566-9749
Research Article Received Date: 07.12.2017 Accepted Date: 04.02.2018
TE D
ABSTRACT
AC
C
EP
Collision-related Otlakbaşı volcanism to the east of Lake Van formed due to eruptions from extensional fissures. In this study, new Ar-Ar age data and major, trace and rare earth element characteristics of the Otlakbaşı basaltic volcanism are investigated. The Ar-Ar age data indicate that this basaltic volcanism erupted in Early Pliocene time in contrast to its previously reported Quaternary age. The volcanic products are basaltic composition and close to the alkaline-subalkaline division line. Results of fractional crystallization accompanied by assimilation (AFC) modelling imply that fractional crystallisation is negligible compared to crustal contamination in the evolution process of the magma chamber and the ratio of the crustal contamination to fractional crystallisation (r values) varies from 0.1 to 0.35. Enrichment of large ion lithophile elements (LILE) and light rare earth elements (LREE) relative to high strength field elements (HFSE) and behaviour of mobile elements (Ba and Th) reveal that the mantle source region for the Otlakbaşı basaltic volcanism might have been enriched by melts that were derived from subducted sediments. Depletion in Rb and K elements of the fractionated-corrected samples indicate that amphibole and/or phlogopite could be present in the mantle source. Results of partial melting model studies show that this basaltic volcanism can be predominantly produced by the melting of the spinel peridotite source. Metasomatized spinel-bearing lithospheric mantle may be responsible for the eruption of the Otlakbaşı basaltic volcanism. Key Words: Eastern Anatolia, Otlakbaşı volcanism, crustal contamination, partial melting, spinel peridotite
Vural OYAN Yüzüncü Yıl University, Faculty of Engineering, Department of Mining Engineering, 65080, Van E-mail:
[email protected]
1. Introduction Turkey is located within geodynamic belts coeval with arc, post-collision and collision in the collision zone between the Gondwana and Eurasian plates. As a result, it appears to be a natural laboratory in terms of geological variety. The East Anatolian Collision Zone (EACZ) is a high plateau formed by north-south compression linked to continental collision in the stage from the Miocene on, following subduction of the Tethys ocean between the Arabian and Eurasian plates (Şengör and Kidd, 1979). As a result of this collision east-west oriented folds, reverse faults, and the strike-slip North Anatolian and East Anatolian fault systems (Figure 1a) developed in the region (Yılmaz et al., 1987). The EACZ is characterised by volcanic activity ranging from the Miocene to historical
1
periods (Keskin 2013: Oyan et al., 2016, 2017). This volcanic activity began in the south of the EACZ before 15 My (Lebedev et al., 2010). Recent studies indicate the last oceanic lithosphere in the East Anatolian region was completely subducted before 20 My (Okay et al., 2010). Additionally, Karaoğlan et al. (2016) emphasised that the collision between the Taurides and Anatolian plates occurred in the Oligocene. The tectonic regime in East Anatolia was characterised by compression-contraction until the end of the Late Miocene and Early Pliocene, then transformed to a compressional-extension in the Early-Late Pliocene (Koçyiğit et al., 2001). Many researchers have proposed different geodynamic models for the East Anatolian region and different sources for volcanism extending over large areas of the region (İnnocenti et al., 1982: Pearce et al., 1990: Keskin et al., 1998: Yılmaz et al., 1998: Keskin, 2003: Şengör et al., 2003, 2008: Allen and Armstrong, 2008: Schildgen et al., 2012). The most important models proposed for the geodynamic evolution of the region are (1) lithospheric delamination (Pearce
TE D
et al., 1990: Keskin et al., 1998); (2) oceanic crust becoming vertical and slab break-off (Şengör, 2003: Keskin, 2003: Şengör et al., 2008); and (3) oceanic slab rupture (Allen and Armstrong, 2008: Schildgen et al., 2012). Studies in recent years have revealed that the volcanic activity observed in large areas on a regional scale may have formed by mixing of melts derived from lithospheric and asthenospheric mantle with different degrees of
EP
melting (Özdemir and Güleç, 2014: Oyan et al., 2016). The volcanic activity in the region reached a peak in the Pliocene, and continued with reducing volumes until the Quaternary (Oyan et al., 2016). This magmatic activity observed in the interval from the Pliocene to the Pleistocene formed volcanic centres like Nemrut, Süphan, Ağrı,
C
Tendürek and Etrüsk (Figure 1b) and large regional-scale plateaus or basaltic lava flows locally along extensional
AC
fractures.
The Otlakbaşı lava located east of Lake Van (Figure 1) formed as lava erupting from extensional fractures. The Otlakbaşı lava cuts Cretaceous-aged limestone and Oligocene-aged clastic rocks and covers both these units and the Cretaceous ophiolite units observed over large areas in the region and Triassic-aged limestones. In this study the aims were (1) to present new geochronologic, geochemical and petrologic data belonging to the Otlakbaşı volcanism east of Lake Van, (2) to discuss data obtained from petrologic modelling studies with magma chamber evolution processes, the nature of the mantle source area and melt processes and (3) to assess findings associated with regional geodynamic processes.
2. Regional Geology
The basement of the Anatolian-Iranian platform within the EACZ comprises microterranes amalgamated from the Late Cretaceous-Early Tertiary (Şengör, 1990). These microterranes are separated by ophiolitic complexes and
2
adhesion complexes. There are 5 different tectonic blocks defined in East Anatolia. There are (1) Rhodope-Pontide unit to the northeast of the region (Topuz et al., 2004); (2) the northwest Iran section (Karapetian et al., 2001); (3) the East Anatolian Accretionary Complex located between the Aras River and Bitlis-Pötürge massif (EAAC) (Şengör et al., 2003, 2008); (4) the Bitlis-Pötürge massif located along the Tauride belt (Şengör et al., 2003); and (5) the Arabian continent or autochthonous units ahead of it (Şengör et al., 2003: Keskin 2007). Following block uplift within the EACZ volcanism began before 15 My (Lebedev et al., 2010) with lava flows and pyroclastic products outcropping widely in the region. This volcanic activity produced three different types of eruption dynamics (effusive, extrusive, explosive). These volcanic units covered the tectonic blocks within the EACZ masking them, with volcanic products covering nearly 2/3 of the region and locally reaching 1 km thickness (Keskin, 2007).
TE D
Geophysical studies to reveal the crustal structure and geodynamic processes in the EACZ indicate the area between the Aras River and the Bitlis-Pötürge Massif has no lithospheric mantle and the East Anatolian Accretionary Complex (EAAC; Şengör et al., 2003, 2008) sits direction on asthenospheric mantle (Al-Lazki et al., 2003: Sandvol et al., 2003). As a result of geodynamic evolution, the crustal thickness is 38 km in the south section
EP
of the East Anatolian region, while it reaches 50 km in the northern section (Zor et al., 2003). In light of this data, Keskin (2003) stated the Neotethyan oceanic lithosphere ruptured while sinking into the asthenosphere and that
AC
mechanism.
C
volcanism with character varying from calc-alkali to alkali in the region may have developed due to this
Recently some geophysical studies have indicated there may be 25-30 km of lithospheric mantle below the East Anatolia region and that the lithosphere may reach 70-75 km thickness (Angus et al., 2006: Özacar et al., 2008).
3
TE D
EP
Figure 1 – Location and geology maps for Otlakbaşı volcanism. a) Main neotectonic lineations in Turkey. b) Large volcanic centres in Lake Van basin and the study area (marked in red). c) Geology map of the study area (MTA, 2008, adapted from the
C
geological report for 1/100000 scale K-51 sheet).
AC
The EACZ transitioned to a compressional-extensional tectonic regime in the Early-Late Pliocene (Koçyiğit et al., 2001) and it is known that some zones of the crust displayed clear compression-thickening while other zones display extension-thinning characteristics as a result of delamination of the region below the lithospheric mantle (Göğüş and Pysklywec, 2008). Regionally, the Early Pliocene volcanism is known to have formed due to partial delamination of the lithospheric mantle (Pearce et al., 1990). Studies in recent years have revealed that volcanism began before 15 My (Lebedev et al., 2010; Oyan, 2011); additionally, a peak was reached nearly 5 My ago in terms of volume of erupted material and at this point basaltic lava forming widespread plateaus erupted in the region (Oyan, 2011). Within the scope of this study, the petrologic evolution, geochemistry and Ar-Ar age dates are presented for the rocks of the Otlakbaşı volcanism, a product of Pliocene basaltic volcanism, for the first time. 3. Analytic Techniques Rock samples taken during field studies were prepared for petrographic, geochemical and Ar-Ar geochronologic dating analyses. Samples were first cut using a Struers brand diamond cutting disk. Cut rock samples had 30-micron thickness thin sections made for mineralogic petrographic analyses and were investigated
4
under a polarising microscope. For geochemical analyses, samples first had the outer sections cleaned of dust, soil, moss and secondary formations. Later, a jaw crusher was used to break samples and they were powdered with the aid of an agate mortar and prepared for analysis. Geochemical main oxides, trace elements and rare earth element analyses were performed in Acme Analytic Laboratories (Acme Labs) in Canada. Main element analyses were measured using an inductively-coupled plasma emission spectrometer (ICP-OES) with the lithium metaborate/tetraborate fusion technique. The detection limits for main elements varied from 0.001 to 0.04%. Loss on ignition (LOI) was determined with the firing method for sample separation and later obtained by measuring weight loss. For trace and rare earth element (REE) analyses, 0.2 g samples were mixed with LiBO2/Li2B4O7 in graphite crucibles. The prepared crucibles were fired in an oven. Later, melted samples were dissolved in 5% HNO3 and trace element and rare earth element analyses were
TE D
completed with an inductively-coupled plasma mass spectrometer (ICP-MS). For reliability of data obtained from main, trace and rare earth element analyses, standards for the analysis laboratory (reference material SO-18) were analysed at the same time as the samples. For standard SO-18, trace and rare earth elements, deviation of 5% or better was obtained. The main oxide, trace element and rare earth element results for rock samples from the
EP
Otlakbaşı volcanics and laboratory standards are given in Table 1.
Ar-Ar dating analyses were performed in the isotope and geochronology laboratories of Nevada University
C
(Las Vegas, United States of America). Samples for analysis were wrapped in Al foil and stacked in 6 mm internal diameter sealed fused silica tubes. Individual packets with mean 3 mm thickness were inserted with neutron flux
AC
monitors (FC-2, Fish Canyon tuff sanidine) at 5-10 mm intervals. The FC-2 sanidine standards heated together with CaF2 and K-glass pieces were placed on a Cu sample tray in a high vacuum line and melted with a 20 W CO2 laser. During the laser fusion, samples were imaged with a video camera system. Samples were analysed with the step-by-step heating method in a dual vacuum resistant oven similar to the design of Staudacher et al. (1978).
Table 1. Main oxides, trace elements and rare earth element analysis results for Otlakbaşı basaltic rocks Sample No Rock Type Coordinates (UTM) SiO2 % TiO2 Al2O3 Fe2O3TOT MnO MgO CaO
2015-5 Basalt N:4331972 E:364899 47.63 1.28 17.02 9.47 0.16 8.77 10.85
2015-11 Basalt N:4331972 E:364899 48.35 1.35 16.95 9.62 0.16 8.26 10.35
2015-12 Basalt N:4331972 E:364899 48.24 1.33 17.16 9.64 0.15 8.39 10.38
2015-13 Basalt N:4331972 E:364899 48.28 1.32 17.05 9.52 0.15 8.34 10.59
2015-14 Basalt N:4331972 E:364899 48.23 1.36 16.92 9.74 0.16 8.35 10.25
5
2015-16 Basalt N:4331972 E:364899 47.70 1.32 16.97 9.42 0.16 7.59 11.08
2015-19 Basalt N:4331972 E:364899 48.43 1.28 16.99 9.13 0.15 7.55 11.13
2015-23 Basalt N:4331972 E:364899 49.02 1.26 17.14 9.17 0.16 7.13 11.27
2015-25 Basalt N:4331972 E:364899 49.04 1.27 17.03 9.19 0.15 7.76 10.89
3.10 0.59 0.21 0.6 99.71 0.732
3.14 0.53 0.22 0.7 99.73 0.717
3.16 0.61 0.24 0.4 99.72 0.721
3.11 0.60 0.22 0.5 99.72 0.722
3.20 0.51 0.21 0.8 99.73 0.717
3.13 0.61 0.23 1.5 99.74 0.704
3.17 0.80 0.25 0.8 99.73 0.712
3.04 0.83 0.25 0.4 99.71 0.699
3.22 0.86 0.26 0.0 99.71 0.718
V (ppm) Co Ni Sr Rb Ba Th Ta Nb Zr Y Hf U Pb La Ce Pr Nd Sm Eu Gd Tb Dy Ho Er Tm Yb Lu CIPW Quartz Orthoclase Albite Anorthite Nepheline Diopside Hiperstene Olivine Magnetite Ilmenite
189 40.7 94.5 404.6 12.1 214 2.0 0.4 5.6 126.6 23.8 3.3 0.4 2.2 15.0 31.6 4.15 17.3 3.85 1.33 4.53 0.73 4.45 0.93 2.74 0.40 2.36 0.38
193 42.2 93.3 346.2 7.7 261 1.8 0.3 5.1 129.6 25.3 3.1 0.4 2.2 11.8 24.4 3.61 15.3 3.90 1.30 4.47 0.75 4.42 0.96 2.70 0.39 2.54 0.39
196 40.5 94.7 389.1 11.5 223 2.1 0.4 6.1 118.9 23.5 2.7 0.5 1.2 13.8 28.6 3.70 16.1 3.69 1.26 4.42 0.70 4.60 0.96 2.65 0.37 2.66 0.41
186 39.3 93.8 374.8 11.8 297 2.1 0.4 6.9 119.8 24.4 2.9 0.6 1.7 14.6 31.2 3.98 16.6 3.94 1.35 4.56 0.75 4.25 0.87 2.93 0.41 2.62 0.41
187 39.2 92.0 347.3 8.1 165 1.7 0.3 4.7 128.2 22.7 3.2 0.4 0.7 11.4 24.0 3.42 14.7 3.86 1.27 4.22 0.73 4.49 0.98 2.68 0.38 2.58 0.40
193 38.1 75.2 361.7 11.3 223 2.0 0.3 5.5 114.7 22.7 2.7 0.4 0.8 13.4 27.6 3.76 15.5 3.70 1.24 4.13 0.68 4.21 0.92 2.46 0.37 2.25 0.38
196 32.5 51.9 442.9 16.1 242 2.6 0.3 6.5 123.3 22.2 2.8 0.5 2.6 18.8 37.8 4.82 21.0 4.51 1.45 4.62 0.71 4.19 0.87 2.56 0.37 2.54 0.37
205 36.4 58.2 493.3 15.5 353 3.1 0.4 7.2 131.9 24.9 3.0 0.6 3.1 20.6 42.0 5.44 22.3 4.88 1.59 5.09 0.77 4.38 0.94 2.66 0.41 2.70 0.42
199 35.7 58.8 488.0 18.7 279 3.3 0.5 7.4 131.8 24.7 3.5 0.6 2.6 21.2 43.0 5.51 23.2 4.93 1.60 5.05 0.82 4.64 0.99 2.68 0.43 2.55 0.42
0 3.54 24.624 31.27 1.095 17.58 0 14.36 4.568 2.469
0 3.185 27.035 31.123 0 15.711 3.745 11.388 4.684 2.61
0 3.067 27.551 30.829 0 15.598 2.651 12.432 4.748 2.628
0 3.694 26.086 31.206 0.573 18.878 0 11.842 4.603 2.57
0 4.81 26.063 30.286 0.669 19.38 0 11.193 4.536 2.473
0 4.97 26.07 31.09 0 19.158 2.345 8.812 4.542 2.425
0 5.13 27.126 29.755 0.203 18.429 0 11.719 4.594 2.435
SO-18 Standar d Analyse d
SO-18
SO-18
Standard
Standard
Analysed
Expected values
58.1 0.69 14.13 7.61
58.08 0.69 14.13 7.61
58.09 0.69 14.13 7.6
C
EP
TE D
Na2O K2O P2O5 LOI Total Mg#
AC
0 3.652 27.103 31.258 0 15.463 1.367 13.332 4.7 2.56
0 3.599 26.705 31.244 0 16.469 1.522 12.767 4.63 2.545
Table 1. Continued Sample No 2015-27
2015-29
2015-30
2015-32
2015-33
2015-34
Basalt
Basalt
Basalt
Basalt
Basalt
Rock Type Coordinat es (UTM)
Basalt
N:4331972 N:4331972 E:364899 E:364899
N:4331972 E:364899
N:4331972 E:364899
N:4331972 E:364899
N:4331972 E:364899
SiO2 % TiO2 Al2O3 Fe2O3TOT
48.49 1.27 16.90 8.99
48.17 1.33 17.05 9.65
47.98 1.29 17.01 9.43
48.84 1.29 17.04 9.49
48.44 1.31 17.04 9.56
48.84 1.28 17.03 9.17
6
0.15 7.29 11.45 3.11 0.85 0.27 0.9 99.70 0.708
0.15 7.46 11.18 3.05 0.84 0.26 0.4 99.72 0.708
0.15 8.26 10.34 3.27 0.57 0.22 0.7 99.72 0.718
0.15 8.53 10.31 3.25 0.55 0.20 1.0 99.71 0.728
0.15 8.50 10.32 3.19 0.63 0.22 0.0 99.72 0.727
0.15 8.04 10.28 3.28 0.54 0.21 0.8 99.71 0.714
0.39 3.33 6.36 3.68 2.15 0.82 1.9 99.72
0.39 3.33 6.37 3.68 2.15 0.83 1.9 99.72
0.39 3.33 6.37 3.69 2.16 0.83 1.9 99.72
V (ppm) Co Ni Sr Rb Ba Th Ta Nb Zr Y Hf U Pb La Ce Pr Nd Sm Eu Gd Tb Dy Ho Er Tm Yb Lu CIPW Quartz Orthoclase Albite Anorthite Nepheline Diopside Hiperstene Olivine Magnetite Ilmenite
200 33.8 56.2 481.3 16.5 317 3.3 0.4 7.4 130.3 24.6 3.3 0.6 3.3 20.6 41.2 5.42 22.3 4.83 1.45 5.18 0.81 4.62 0.93 2.66 0.42 2.55 0.39
199 36.2 49.2 492.9 16.7 334 3.2 0.5 8.0 134.6 24.1 3.1 0.9 2.5 20.6 41.6 5.58 21.7 5.06 1.59 5.07 0.82 4.89 0.98 2.81 0.41 2.76 0.41
189 43.6 99.1 362.4 9.8 193 2.2 0.5 5.7 125.8 25.3 2.8 0.4 0.5 14.4 28.5 3.88 16.6 3.89 1.43 4.61 0.77 4.66 0.93 2.73 0.42 2.63 0.39
177 42.4 99.1 354.2 10.5 338 1.6 0.4 4.6 126.3 22.8 3.1 0.5 1.7 12.5 25.6 3.54 15.5 3.66 1.24 4.50 0.75 4.52 0.97 2.74 0.40 2.48 0.37
189 40.3 73.1 378.5 12.7 208 2.2 0.4 6.2 116.8 24.4 2.9 0.4 2.0 14.7 29.6 4.01 17.4 4.33 1.27 4.46 0.72 4.44 0.95 2.71 0.40 2.74 0.40
183 42.3 104.1 375.2 10.0 372 1.9 0.3 5.2 132.1 25.0 3.2 0.4 1.9 12.1 25.8 3.61 15.8 3.75 1.34 4.39 0.72 4.43 0.90 2.72 0.41 2.60 0.38
198 26.2 40 399.1 28 496 9.7 7.2 21.2 281.5 31.5 9.6 16
198 26.1 46 400.1 28 497 9.8 7.2 20.8 279.9 31.3 9.7 16.1
199 26.2 44 403 28.2 498 9.7 7.1 21 280.8 31.3 9.4 16.1
11.9 26.5 3.4 13.9 2.86 0.87 2.85 0.5 2.9 0.61 1.79 0.28 1.74 0.27
11.8 26.9 3.39 13.8 2.81 0.86 2.85 0.5 2.86 0.6 1.77 0.28 1.75 0.26
12 27 3.39 13.8 2.89 0.86 2.83 0.5 2.92 0.6 1.79 0.28 1.76 0.26
0 3.758 27.255 30.611 0 15.674 2.816 12.24 4.657 2.473
0 3.25 28.262 30.724 0 15.834 2.15 12.043 4.707 2.534
EP
C
AC
0 5.118 25.518 30.191 0.698 20.691 0 10.218 4.471 2.458
0 5.029 26.164 30.71 0 19.024 1.241 10.218 4.538 2.465
TE D
MnO MgO CaO Na2O K2O P2O5 LOI Total Mg#
0 3.422 28.127 30.663 0 16.002 0.093 13.868 4.735 2.568
0 3.315 27.689 30.794 0.191 15.991 0 14.43 4.619 2.498
4. Results 4.1. Geology and geochronology of the area Otlakbaşı lava comprises a basaltic-composition lava series erupted from different extensional fractures east of Lake Van. With outcrops in different locations, the Otlakbaşı lava covers a 4 km area at most and cuts clastic rocks called the Van Formation (Acarlar et al., 1991) (Figure 1c). These clastic rocks comprise Oligocene-
7
Miocene-aged sandstone, claystone and siltstone successions (Acarlar et al., 1991). The Otlakbaşı basaltic lava cuts Cretaceous-aged neritic limestones in the north of the study area (Figure 1c). This unit, called the Topuztepe Formation, is formed of grey, white and dark grey colour limestone, dolomitic limestone and recrystallised limestone lithologies (Acarlar et al., 1991). Within the study area, the Otlakbaşı lava flows unconformably overlie older ophiolitic melange units. Ophiolitic rock units are serpentinite, dunite and spilites. Covering all these lithologies, the Otlakbaşı volcanics cover a total area of nearly 15 km2 (Figure 1c). Within rocks with black and grey colour, the largest observable feldspar and olivine microphenocrystals are nearly 0.5 cm in size. A sample chosen to best represent the Otlakbaşı lava flow (Sample no: 2015-33) was sent for Ar-Ar dating analysis. The Ar-Ar geochronologic dating analysis of rock mass is in accordance with Ca/K. The analysed sample
TE D
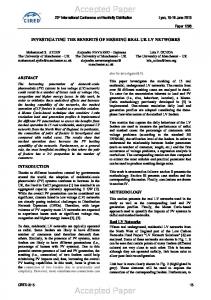
had total gas age of 4.14±0.004 My. Between steps 5-7, a plateau age of 4.17±0.05 My was defined (released 39Ar amount 67%) (Figure 2). Though an isochron age could not be determined for this sample, there were no alteration effects observed due to high radiogenic yield. The 4.17±0.05 My Ar-Ar age for Otlakbaşı lava indicates they erupted in the Early Pliocene (Zanclean), contrary to the known age of Quaternary. The age data belonging to the
AC
C
EP
steps are given in Table 2.
Figure 2- Ar-Ar plateau age for Otlakbaşı volcanic rocks. Best plateau formed between steps 4 and 7. Between these steps the 39Ar
amount released was 67%.
Table 2. Apparent age data for steps in the Ar-Ar geochronologic dating analyses. T - temperature, My – million years, SE – standard error margin Step
T (0C)
t (min.)
1 2 3 4 5 6 7 8
560 620 680 740 800 870 960 1050
12 12 12 12 12 12 12 12
36
Ar
0.791 0.074 0.071 0.071 0.082 0.092 0.092 0.109
37
Ar
0.305 0.221 0.647 1.242 1.598 1.615 1.005 0.928
38
Ar
0.281 0.094 0.281 0.685 1.049 1.196 0.695 0.292
39
40
Ar
7.503 5.691 20.928 51.701 78.776 87.834 48.507 13.554
Ar
228.015 26.270 47.161 90.239 127.168 140.192 89.309 46.317
8
%40Ar* 3.6 41.1 75.0 89.7 90.2 88.9 81.7 47.1
% 39Ar 2.3 1.8 6.5 16.1 24.5 27.3 15.1 4.2
40
Ar*/39Ar 1.075392 1.318518 1.411981 1.422654 1.366703 1.342125 1.335334 1.243824
Age (My)
1s.e.
3.33 4.08 4.37 4.40 4.23 4.16 4.13 3.85
0.40 0.14 0.06 0.06 0.05 0.04 0.05 0.05
9 10 11
1140 1230 1400
12 12 12
0.136 0.171 0.487
0.627 0.263 0.463
0.136 0.068 0.147
4.298 1.190 1.850
41.850 48.898 137.305
12.7 1.4 0.8
1.3 0.4 0.6
0.811043 0.417326 0.497728 Total gas age Plateau age
2.51 1.29 1.54
0.20 0.63 0.67
4.14 4.17
0.04 0.05
4.2. Mineralogy-Petrography Rocks forming the Otlakbaşı volcanics are formed of plagioclase, olivine, pyroxene and opaque minerals (Figure 3). While olivines are observed as microphenocrystals and are iddingsitised, plagioclase phenocrystals have rod-like form, with polysynthetic twins observed. Some plagioclase microphenocrystals with cell-like structure developed were determined to have been eroded by magma along the edges. Colourless pyroxene crystals with microlith sizes, have lilac colour tones in some forms close to the titanaugite composition. Gas cavities observed in rocks are filled with secondary calcite and zeolite crystals. The groundmass of the Otlakbaşı rocks comprises microliths and volcanic glass. Generally, they display interstitial and flow textural characteristics. Glomeroporphyric texture characteristics formed by clusters of plagioclase, olivine and pyroxene minerals or
AC
C
EP
TE D
plagioclase crystals were identified in the rocks (Figure 3).
Figure 3- Thin section appearance of Otlakbaşı rocks. Distribution of iddingsitised olivine (Ol) phenocrysts and Ol, Cpx (clinopyroxene) and Plg (plagioclase) crystals in interstitial matrix
4.3. Whole-rock Geochemistry The freshest samples collected during fieldwork in locations where the Otlakbaşı volcanics outcrop were sent to ACME analytic laboratories in Canada for main oxide, trace element and rare earth element (REE) analyses. The results of analyses using ICP-AES and ICP-MS methods found low element mobility in rocks, with LOI (loss on ignition) values varying between 0 and 1, indicating that these rocks were fresh and not affected by alteration. Geochemical classification of these rocks was completed using values calculated for main oxide values on dry
9
basis (distributing the water loss on ignition in proportion to the major element values). The lava erupted in the Otlakbaşı area fell in the basalt area on the total alkali (Na2O+K2O) – silica (TAS diagram; LeBas et al., 1986)
AC
C
EP
TE D
classification diagram (Figure 4a).
Figure 4- For Otlakbaşı volcanic rocks a) total alkali-silica (TAS: LeBas et al., 1986) classification diagram, b) SiO2 (%)-K2O (%) variation diagram (Peccerillo and Taylor, 1976).
With the aim of determining the character of the magma forming the rocks in the study area, the alkali-subalkali differentiation line of Irvine and Baragar (1971) was drawn on the TAS diagram and basalts fell close to the alkalisubalkali differentiation line and were located in the subalkali area. On the SiO2 – K2O diagram of Peccerillo and Taylor (1976), the rocks were located in the medium K series area (Figure 4b). While the SiO2 content of the Otlakbaşı basaltic samples varied in a narrow interval from 47.63-49.04%, the MgO contents varied from 7.13 to 8.77% with Mg# values varying from 0.699 to 0.732. As the SiO2 content of the Otlakbaşı basaltic rocks varies in a narrow interval, they do not provide very clear information on the Harker
10
variation diagrams. As a result, to produce more productive data for basaltic rocks on the Harker diagram the solidification index MgO values were used. The MgO binary Harker variation diagrams for some chosen main oxides are given in Figure 5a and b. Though there are no very clear trends observed on MgO against main oxide variation diagram, there is a negative trend between MgO and SiO2 and a positive trend with Fe2O3. The MgO binary Harker variation diagrams for some trace elements from the basaltic samples are given in Figure 5 c-f. Together with the fall in MgO in basaltic rocks, the Ni and Co elements have a negative trend, Sr and Y elements display close to horizontal or slightly positive trends. The traces of other trace elements and main oxide elements against MgO on Harker variation diagrams have irregular distribution or display completely horizontal trends. The location of Otlakbaşı basaltic rock samples on primitive mantle (PM)-normalised multi-element diagrams
TE D
is given in Figure 6a. On these diagrams, all samples appear to be severely depleted in high field strength elements (HFSE), compared to large ion lithophile elements (LILE) and light rare earth elements (LREE). Samples presenting typical trends for active continental margin volcanism display enrichment in Pb and Sr compared to neighbouring elements. Medium and heavy rare earth elements in the primitive mantle-normalised rock samples
EP
are parallel to the PM line. The same samples on Sun and McDonough’s (1989) chrondrite-normalised rare earth element (REE) spider diagrams (Figure 6b) display enrichment in all samples for LREE elements compared to
C
medium rare earth elements (MREE) and heavy rare earth elements (HREE). The MREE and HREE plot parallel
AC
or close to parallel with primitive mantle values.
11
TE D EP C AC
Figure 5- Selected main oxide and trace elements against MgO for Otlakbaşı basaltic rocks on Harker binary variation diagrams.
5. Discussion 5.1. Fractional Crystallisation As the MgO and SiO2 values for Otlakbaşı basaltic lava vary within a very narrow range on Harker variation diagrams against MgO values (Figure 5), the trends indicating fractional crystallisation could not be clearly observed. Only Fe2O3, Co and Ni had slightly positive trends against MgO, which indicates that the evolution of these rocks may have been partly affected by fractional crystallisation processes of ferromagnesian minerals like
12
olivine and pyroxene. Together with the fall in MgO values, the slight increasing trend in SiO2 indicates that
AC
C
EP
TE D
fractional crystallisation may have affected the evolution of the rocks, though only slightly.
Figure 6- For Otlakbaşı basaltic lava a) multi element spider diagrams normalised to primitive mantle (PM), b) rare earth element (REE) spider diagrams normalised to chrondrite. Normalised values taken from Sun and McDonough (1989) for both diagrams.
The positive trend of Y and Sr with MgO shows that amphibole and plagioclase were not affected by fractional crystallisation processes. To test whether fractional crystallisation was an effective evolutionary process for Otlakbaşı basaltic volcanism, Th-Co and Rb-Y binary variation diagrams were produced using the Rayleigh fractionation equation (Figure 7). On these diagrams, the fractional crystallisation trends for magmas with different mineralogic composition were drawn. On the Th against Co diagram for Otlakbaşı basaltic lava, the line falls on curves C5 and C6. This diagram shows that for magmatic systems comprising mineral assemblages of olivine (20%), plagioclase (60%) and clinopyroxene (20%), nearly 20% fractional crystallisation may create the Otlakbaşı lava. Additionally, for the fractional crystallisation model using Rb-Y elements, samples fall close to the C5 curve
13
with 80% F value. This modelling clearly indicates that olivine and pyroxene minerals were affected by fractionation of the magma system, while crystallisation of other minerals was unimportant for Otlakbaşı basaltic
TE D
volcanism.
EP
Figure 7- Co-Th normal – normal and Rb-Y log – log variation diagrams. Each curve modelled on the diagrams was calculated characterised by crystallisation of mineral assemblages given below according to Rayleigh crystallisation and traced on the diagram. % values given on the curves indicate post-crystallisation with remaining melt % indicated. C1C2-Amp0.1+Plg0.7+Cpx0.1+Bio0.05+Sn0.05,
C
Amp0.2+Plg0.5+Cpx0.1+Bio0.1+Sn0.1, Ol0.1+Amp0.15+Plg0.5+Opx0.15+Cpx0.1,
C5-Ol0.2+Plg0.6+Cpx0.2,
C3-Plg0.5+Cpx0.5,
C6-Plg0.7+Opx0.1+Cpx0.2,
C4C7-
AC
Amp0.1+Plg0.65+Bio0.05+Sn0.1+Cpx0.1, C8- Amp0.1+Plg0.6+Opx0.2+Cpx0.1, C9- Plg0.5+Opx0.5 (Amp; amphibole, Plg; plagioclase, Ol; olivine, Opx; orthopyroxene, Cpx; clinopyroxene, Bio; biotite, Sn; Sanidine) Discriminant coefficient values (Kd) used to obtain the curves taken from Geochemical Earth Reference website (http://www.earthref.org).
5.2. Continental Contamination Continental contamination processes occur as hot magma melts colder continental crust material and absorbs the material as it moves through the continental crust or while in a magma chamber and this event is reflected in the melt geochemistry (DePaolo, 1992). On multielement spider diagrams for Otlakbaşı basaltic lava (Figure 6a), there is clear enrichment of LILE and LREE compared to HFSE elements which may reflect the effects of continental contamination or continental contamination combined with fractional crystallisation (assimilation fractional crystallisation-AFC). Additionally, the Ta/Zr and Rb/Th element ratios are clearly enriched in continental crust compared to the mantle and are high in some Otlakbaşı basaltic lava samples. This data indicates that continental contamination may have been an effective process in the evolution of the Otlakbaşı volcanism.
14
With the aim of revealing whether AFC effects were an important evolutionary process for Otlakbaşı basaltic lava, modelling studies were completed using DePaolo’s (1981) AFC equations. DePaolo’s (1981) AFC modelling reveals the ratio of crustal contamination (Ma) to the ratio of fractional crystallisation (Mc) and this is shown as the assimilation fractional crystallisation ratio “r (Ma/Mc)”. Another parameter used in these equations is the ratio of remaining magma mass after fractional crystallisation (Mm) to original magma (Mm0) and is shown by “F (Mm / Mm0)”. With DePaolo’s (1981) equations, curves may be modelled for different r values for trace element and isotope ratios and interpretations may be made about the true r value of rock samples. Rb, Th, Ta and Zr elements were used in the AFC modelling systematic derived for the Otlakbaşı basaltic lavas and different r values were produced with Rb-Rb/Th and Ta-Ta/Zr AFC modelling curves (Figure 8). With the crystallisation of the trace elements given above as some accessory minerals in acidic-
TE D
character magmas, the Zr, Th and mica minerals, apart from Rb, are incompatible with minerals in most of the magma (D