precision of a new, portable, handheld blood gas analyzer, the. IRMA ® ... IRMA consists of a notebook-sized machine and disposable cartridges, each ...
ACCURACYANDPRECISIONOFA NEW,PORTABLE, HANDHELDBLOODGASANALYZER,THE IRMA® Joyce A. Wahr, MD, Wei Lau, MD, Kevin K. Tremper, MD, PhD, Lucy Hallo&, RN, MS, and Kaye Smith, R N
Wahr JA, Lau W, Tremper KK, Hallock L, Smith K. Accuracy and precision of a new, portable, handheld blood gas analyzer, the IRMA ® J Clin Monit i996; 12:317-324
ABSTRACT.Objective. The accuracy and precision of the new I R M A ® (Immediate Response Mobile Analysis System, Diametrics, Inc. ®, St. Paul, MN) handheld blood gas analyzer was compared with that of two benchtop blood gas analyzers. The I R M A consists of a notebook-sized machine and disposable cartridges, each containing a pH, a CO2 and an 02 electrode, and provides bedside (point-of-care) blood gas analysis. M e t h o d s . A total of 172 samples (arterial and mixed venous) were obtained from 25 informed, consenting patients undergoing cardiopulmonary bypass. The pH, PCO2 and PO2 of each sample was determined on four blood gas analyzers: N O V A Statlabs Profile 5 (NOVA Biomedical, Waltham, MA), the ABL-50 (Radiometer, West Lake, OH), and two I R M A machines. Linear regression and bias 4- precision were determined, comparing each of the analyzers with the NOVA. Results. All three machines showed a similar, high degree of correlation with the NOVA for pH, PCO2, and PO2. The bias and precision of the I R M A machines compared with the NOVA was similar to that of the ABL compared with the NOVA for pH (NOVA:ABL -0.005 4- 0.011; N O V A : I R M A 1 = 0.0026 4- 0.025; NOVA : I R M A 2 = 0.0021 ± 0.025), for PCO2 (NOVA:ABL = -1.4 4- 1.3 mmHg; N O V A : I R M A 1 = -1.3 4- 1.9 mmHg; NOVA : I R M A 2 = - 1 . 2 + 2.1 mmHg) and DO2 (NOVA:ABL = 3.6 ± 21.1 mmHg; NOVA : I R M A 1 = 3.4 ± 19.9 mmHg; NOVA : I R M A 2 = 6.3 :t: 20.9 mmHg). The bias found for pH, PCO2, and PO2 was not affected by extremes of temperature (range 25.5-40°C) or hematocrit (range 11-44%) for any machine. Conclusions. The new technology incorporated in the IR.MA blood gas analyzer provides results with an accuracy that is similar to that of benchtop analyzers, but with all of the advantages of point-ofcare analysis.
KEYWORDS,Blood gas analyses. Monitoring: oxygen, carbondioxide, pH. Equipment: point of care blood gas analyzer.
INTRODUCTION
From the Department of Anesthesiology, University of Michigan Medical School, Ann Arbor, Michigan. Received Oct 4, 1995, and in revised form Mar 6, 1996. Accepted for publication Mar 11, 1996. Address correspondence to Dr. Wahr, Department of Anesthesiology, University of Michigan Hospitals, 1G323-0048, 1500 E. Medical Center Drive, Ann Arbor, MI 48109-0048, U.S.A.
JournalofClinicalMonitoring12: 317-324,1996. © 1996 KluwerAcademicPublishers.Printedin theNetherlands.
In critically ill or anesthetized patients, the ability to quantitatively assess b l o o d gas status is invaluable. D e v e l o p m e n t o f the p o l a r o g r a p h i c o x y g e n electrode in 1956 b y Leland Clark, and o f the Severinghaus CO2 electrode shortly thereafter, m a d e clinical m o n i t o r i n g o f b l o o d gases a r o u t i n e part o f patient care. Despite i m p r o v e ments in the speed w i t h w h i c h current b e n c h t o p analyzers can p e r f o r m an analysis, t h e y are n o t portable, r e q u i r i n g transport o f b l o o d samples to the laboratory. Delays in t r a n s p o r t or m i s h a n d l i n g o f the samples (e.g., a l l o w i n g air bubbles to c o m e in contact w i t h the b l o o d , too m u c h or t o o little h e p a r i n in the sample, lost labels, w a r m i n g o f the sample) can significantly affect the accu-
318 Journalof CIinical Monitoring Vo112 No 4 July 1996
racy of the results or delay appropriate intervention in patient management [1-4]. The ability to bring the blood gas analyzer to the critically ill patient and to perform analysis at the bedside ("point-of-care") would alleviate many of these problems. Development of portable blood gas analyzers has been limited by the requirements for calibration of the CO2 electrode. Benchtop analyzers use known concentrations of gas, which is supplied in conventional gas tanks that severely limit their portability. The new I R M A ® (Diametrics, Inc. ®, St. Paul, MN) handheld blood gas analyzer consists of a battery-powered machine (approximately 12" by 15", the size of a notebook) and disposable cartridges, approximately 2" by 5" in size. The cartridges, containing a pH electrode, a CO2 electrode, and a polarographic 02 electrode, are supplied in a foil wrapper with a packet of bicarbonate in a gas permeable membrane. When the foil wrapper is sealed, the bicarbonate equilibrates with CO2 partial pressure. When the cartridge is removed, the gas surrounding the CO2 and pH electrodes is the known partial pressure of CO2, and the electrode is calibrated on insertion of the cartridge. The incorporation of the calibrating gas in the foil wrapper decreases the size of the machine to one that can be easily hand-carried. While this new technology has been tested and found to be accurate in laboratory settings, no large-scale clinical trials have been reported. We therefore studied the accuracy of this new blood gas analysis technology over a wide physiological range of temperatures, oxygen and CO2 tensions, and hematocrits in patients undergoing cardiac surgery.
MATERIALANDMETHODS With the approval of our institutional review board, 25 patients undergoing elective cardiac surgery who gave informed consent were enrolled in this prospective study. All patients underwent placement of arterial and pulmonary artery catheters. General anesthesia was induced and maintained with fentanyl and midazolam infusions. All patients underwent systemic heparinization with 3 - 4 mg of bovine heparin. Moderate hypothermic cardiopulmonary bypass was employed in all patients (systemic cooling to a core temperature of not lower than 28 °C). Arterial and mixed venous blood samples were drawn following skin incision, after systemic cooling during cardiopulmonary bypass, and following successful separation from cardiopulmonary bypass. Six 3-ml samples (three arterial and three mixed venous) were collected from each patient into pre-heparinized syringes (SmoothE @, Radiometer, West Lake, OH). Each sample was
analyzed in randomized order in the four blood gas analyzers: the NOVA Statlabs Profile 5 (NOVA Biomedical, Waltham, MA); the ABL-50 (Radiometer, West Lake, OH); and the two I R M A machines. The order of analysis for each separate syringe was determined by a random number generator, so that order of analysis did not influence the results. All samples were analyzed within 5 minutes at room temperature and without cooling. Quality control measurements were performed daily on all analyzers using standardized control solutions (acidosis, alkalosis, and normal) in accordance with the College of American Pathologists' standards for accreditation. Data were analyzed using the statistical program Starview 4.02 (Abacus Concepts, Berkeley, CA). Statistical analysis included linear regression and bias 4- precision as recommended by Bland and Altman [5]. Bias is the mean difference of the values and represents the systematic error between two methods, while precision is the standard deviation of the bias and represents the random error. In all cases, the NOVA-6 was considered the "gold standard," and the other machines were compared with it. The bias -t- precision between the NOVA and each of the I R M A analyzers was compared with the bias 4precision between the NOVA and the ABL for all variables (pH, PCO2, POe). Likewise, the correlation between the NOVA and each I R M A analyzer was compared with the correlation between the NOVA and the ABL analyzers using Fisher's z statistic. This statistic was modified to account for the inherent agreement resulting from the repetition of the NOVA value in each computation. The effect of temperature and hematocrit on the bias of any machine was determined. The bias of each variable for each analyzer compared with the NOVA was plotted against the hematocrit (or temperature) value of that sample. The correlation between the bias and the hematocrit (or temperature) was determined. The effect of hematocrit (or temperature) on the bias of the I R M A analyzer for each variable was compared with the effect on the bias demonstrated by the ABL using the Fisher's z statistic, again modified to account for the inherent agreement between samples due to the repetition of the NOVA value and the hematocrit (or temperature) in each correlation.
RESULTS The pH, PCO2, and PO2 of 172 samples were determined on each of four blood gas analyzers. Results were dropped from analysis when the blood gas analyzer failed to calibrate (twice with the I R M A machines) or
Wahr et aI: PortableBlood Gas Analyzer (IRMA ®) 319
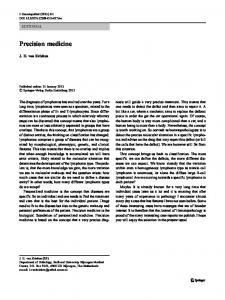
displayed an error message (four times with the N O V A and ABL). Therefore, the n u m b e r of samples analyzed on each machine are different, and are detailed in the figures. All three machines showed a high degree of correlation with the N O V A for p H (ABL r = 0.97, I R M A 1 r = 0.89, I R M A 2 r = 0.87), for PCO2 (ABL r = 0.92, I R M A 1 r = 0.95, I R M A 2 r = 0.91), and for PO2 (ABL r = 0.99, I R M A 1 r = 0.99, I R M A 2 r = 0.99). The bias 4- precision for each analyzer compared with the N O V A across the p H ranges from 7.00 to 7.60, as shown in Figure 1. While the bias of the I R M A analyzers is similar to that of the ABL, the standard deviation appears larger for the I R M A instruments (NOVA:ABL -0.005 + 0.011; N O V A : I R M A 1 = 0.0026 -4- 0.025; N O V A : I R M A 2 = 0.0021 4- 0.025). The limits of agreement for the I R M A analyzers range f r o m -0.04 to +0.044. This precision appears to be sufficient for appropriate clinical decision making. The PCO2 analysis is shown in Figure 2. The bias and precision of each analyzer compared with the N O V A were similar across the range of values from 30 to 58 m m H g (NOVA:ABL = -1.38 ± 1.33 m m H g ; N O V A : I R M A 1 = - 1 . 2 6 -4- 1.87 m m H g ; N O V A : I R M A 2 = -1.16 -4- 2.08 m m H g ) . The range covered by the limits of agreement for the I R M A machines compared with the N O V A is larger than the range comparing the ABL with the N O V A (5.6 m m H g for ABL, 7.2 m m H g for I R M A 1, and 8 m m H g for I R M A 2). However, this variability is unlikely to be clinically significant; 3.5% o f the samples tested were outside o f the limits o f agreement for PCO2 with the I R M A machines, compared with 2.4% o f the values obtained with the ABL. Neither temperature or hematocrit was found to affect the bias of either I R M A analyzer when compared with the effect of temperature or hematocrit on the bias of the ABL. The PO2 analysis, as shown in Figures 3 and 4, again demonstrates a small bias and excellent precision for each machine compared with the NOVA. Figure 3 shows the bias and precision for PO2 values less than 100 m m H g and Figure 4 shows the bias and precision for values greater than 100 m m H g . N o differences were seen in the measure o f agreement with the N O V A either for the complete range o f oxygen tensions (NOVA:ABL = 3.6 -t- 21.1 m m H g ; N O V A : I R M A 1 = 3.4 -t- 19.9 m m H g ; N O V A : I R M A 2 = 6.3 -4- 20.9 m m H g ) or for values greater than 100 m m H g (NOVA:ABL = 7.42 -4- 29.01 m m H g ; N O V A : I R M A 1 = 2.11 4- 27.71 m m H g ; N O V A : I R M A 2 = 7.63 4- 29.14 m m H g ) . The ABL was found to have a clinically insignificant bias for PO2 values less than 100 m m H g , while the two I R M A analyzers showed a bias of approximately 5 m m H g (NOVA:ABL = - 0 . 3 -t- 3.9 m m H g ; N O V A : I R M A 1 =
4.8 ± 3.4 m m H g : N O V A : I R M A 2 = 4.9 -4- 3.8 m m H g ) . The precision for each analyzer appeared to be similar for all PO2 values, and for PO2 values greater than and less than 100 m m H g . All machines demonstrated a greater variability for PO2 values greater than 100 versus less than 100 m m H g . For PO2 values less than 100 m m H g , the range covered by the limits of agreement were similar for all machines (7.8 m m H g for ABL, 6.8 m m H g for I R M A 1, and 7.6 m m H g for I R M A 2). The percentage of values outside of the limits o f agreement was less than 5% for all machines (2.4% for ABL, 4.7% for I R M A 1, 4.7% for I R M A 2). The bias found for pH, PCO2, and PO2 was not affected by extremes o f temperature (range 25.5 to 40 °C) or hematocrit (range 11 to 44%).
DISCUSSION These data demonstrate that the new technology incorporated into the I R M A blood gas analyzer provides blood gas results with an accuracy and precision similar to that of traditional blood gas analyzers. There is an irreducible degree o f variability in blood gas analysis. Analysis of the same blood sample repeated on the same machine repeatedly will produce results that are not identical. Therefore, this study was not concerned with the absolute agreement between a "new" instrument (IRMA) and a "gold standard" instrument (NOVA). Rather, it was concerned with whether the agreement between the "new" and the "gold standard" is different than the agreement between two "gold standard" instruments (NOVA and ABL). As both the ABL and the N O V A analyzers are accepted as accurate and reliable individually, the degree of agreement (or disagreement) between these two instruments must be considered acceptable in clinical decision making. This study did demonstrate some differences in bias between the N O V A - A B L and the N O V A - I R M A , most notably in PO2 values less than 100 m m H g . Because bias, or mean offset, is a systematic error, it can be corrected for in software algorithms, and the I R M A company has developed software that enables the I R M A to "emulate" any o f the standard benchtop analyzers. Precision is a measure of random error, and cannot be accounted for with algorithms. The precision o f each of the I R M A analyzers for PCO2 and PO2 compared with the N O V A analyzer, was similar to the precision of the ABL compared with the NOVA. The bias -4- precision of the I R M A analyzers for p H measurements also appears different from that of the ABL, when each is compared with the NOVA. The limits of agreement, however, defined as two standard deviations above and below the
320
Journal o/Clinical Monitoring Vo112 No 4 July 1996
0.2
1A.
[]
0.1
Data p o i n t s ( n = 1 6 6 )
---
Bias
.....
U p p e r limit of agreement
....... Lower limit of agreement
..= =~ 0.0
P
~
N
z
I:1
@
-0.1
-0.2 7.2
7.3
7.4
7.5
7.6
Mean pH (Nova, ABL)
0.2
lB.
[]
0.1
Data p o i n t s ( n = 1 6 9 )
---
Bias
.....
Upper limit of agreement
.....
Lower limit of agreement
¢ []
< .........
.=
_~ , " " ~
[]
....
0.0
-~ . . . .
........
~
il .......
[]
[] ", ~ _' " ' " ~ ' " a "
_
DB
...........
~ ................................
[]
~ ~"a~.r#'#j~'E,~.-o~'~.-----'-; B
......
u, . ' [ ] l ~ " d ~ [ ] -
...................................
IB"
'~...." ............. []? ,... .......... ~......"
@
[]
..." ..........................
[] ........
[]
z -0.1
-0,2
i 7.3
7.2
, 7.4
, 7.5
i 7.6
Mean pit (Nova, IRMA 1) 0.21C.
m
Data points (n=166)
- - - N E bias ..... .....
BEI 0.1
[] gl