Accurate and simultaneous measurement of thickness and refractive index of thermally evaporated thin organic films by surface plasmon resonance spectroscopy T. Del Rosso,1,* J. Edicson Hernández Sánchez,1 R. Dos Santos Carvalho,1 O. Pandoli,2 and M. Cremona1 1
2
Department of Physics, Pontifícia Universidade Católica do Rio de Janeiro, Rua Marques de São Vicente, 22451900, Rio de Janeiro, Brazil Department of Chemistry, Pontifícia Universidade Católica do Rio de Janeiro, Rua Marques de São Vicente, 22451900, Rio de Janeiro, Brazil *
[email protected]
Abstract: We demonstrate that Surface Plasmon Resonance spectroscopy can be used for the accurate and simultaneous determination of the thickness and refractive index of transparent thin thermally deposited organic films. The experimental approach is based on a two-metal deposition or a two-thickness method. These methods have been applied to an encapsulated sample containing a thin film of commercial tris(8hydroxyquinoline) (Alq3). The accuracy of the measurement depends on the control of the film deposition process and suggests the use of SPR spectroscopy as inexpensive and valuable metrology tool for small molecule organic thin films. ©2014 Optical Society of America OCIS codes: (310.6860) Thin films, optical properties; (240.6680) Surface plasmons; (160.4890) Organic materials; (120.4640) Optical instruments.
References and links 1. 2. 3. 4. 5. 6. 7. 8. 9. 10. 11. 12. 13.
H. Raether, Surface Plasmons on Smooth and Rough Surfaces and on Gratings, Springer Tracts in Modern Physics (Springer-Verlag, 1988) J. Homola, “Surface Plasmon Resonance Sensors for Detection of Chemical and Biological Species,” Chem. Rev. 108(2), 462–493 (2008). E. Giorgetti, M. Muniz-Miranda, A. Giusti, T. Del Rosso, G. Dellepiane, G. Margheri, S. Sottini, M. Alloisio, and C. Cuniberti, “Spectroscopic investigation on the in situ polymerization of self assembled monolayers of carbazolyldiacetylene CDS9 on silver-coated glass,” Thin Solid Films 495(1-2), 36–39 (2006). E. Hutter, J. H. Fendler, and D. Roy, “Surface Plasmon Resonance Studies of Gold and Silver Nanoparticles Linked to Gold and Silver Substrates by 2-Aminoethanethiol and 1,6-Hexanedithiol,” J. Phys. Chem. B 105(45), 11159–11168 (2001). H. E. de Bruijn, B. S. F. Altenburg, R. P. H. Kooyman, and J. Greve, “Determination of thickness and dielectric constant of thin transparent dielectric layers using Surface Plasmon Resonance,” Opt. Commun. 82(5-6), 425– 432 (1991). K. A. Peterlinz and R. Georgiadis, “Two-color approach for determination of thickness and dielectric constant of thin films using Surface Plasmon Resonance Spectroscopy,” Opt. Commun. 130(4-6), 260–266 (1996). R. Georgiadis, K. P. Peterlinz, and A. W. Peterson, “Quantitative measurements and modeling of kinetics in Nucleic Acid Monolayer Film using SPR spectroscopy,” J. Am. Chem. Soc. 122(13), 3166–3173 (2000). J. S. Yuk and K. S. Ha, “Proteomic applications of surface plasmon resonance biosensors: analysis of protein arrays,” Exp. Mol. Med. 37(1), 1–10 (2005). H. Liang, H. Miranto, N. Granqvist, J. W. Sadowski, T. Viitala, B. Wang, and M. Yliperttula, “Surface Plasmon Resonance instrument as a refractometer for liquids and ultrathin films,” Sens. Actuators B Chem. 149(1), 212– 220 (2010). H. Fujiwara, Spectroscopic Ellipsometry Principles and Applications (John Wiley & Sons Ltd, 2007) P. E. Burrows, V. Bulovic, S. R. Forrest, L. S. Sapochak, D. M. McCarty, and M. E. Thompson, “Reliability and degradation of organic light emitting devices,” Appl. Phys. Lett. 65(23), 2922–2924 (1994). S. P. Subbarao, M. E. Bahlke, and I. Kymissis, “Laboratory Thin-Film Encapsulation of Air-Sensitive Organic Semiconductor Devices,” IEEE Trans. Electron. Dev. 57(1), 153–156 (2010). D. A. Ramsey and K. C. Ludema, “The influences of roughness on film thickness measurements by Mueller matrix ellipsometry,” Rev. Sci. Instrum. 65(9), 2874–2881 (1994).
#210025 - $15.00 USD Received 11 Apr 2014; revised 11 Jul 2014; accepted 21 Jul 2014; published 29 Jul 2014 (C) 2014 OSA 11 August 2014 | Vol. 22, No. 16 | DOI:10.1364/OE.22.018914 | OPTICS EXPRESS 18914
14. A. M. Kostruba and O. G. Vlokh, “Accuracy of traditional ellipsometry and complex “ellipsometry – transmission photometry” techniques for systems “absorptive film – transparent substrate”,” Proc. SPIE 3094, 266–271 (1997). 15. B. Johs and C. M. Herzinger, “Quantifying the Accuracy of Ellipsometer Systems,” Phys. Status Solidi 5(5 C), 1031–1035 (2008). 16. P. E. Burrows and S. R. Forrest, “Electroluminescence from trap limited current transport in vacuum deposited organic light emitting devices,” Appl. Phys. Lett. 64(17), 2285–2287 (1994). 17. N. Hajdukova, M. Prochazka, J. Stepanek, and M. Spirkova, “Chemically reduced and laser-ablated gold nanoparticles immobilized to silanized glass plates: Preparation, characterization and SERS spectral testing,” Colloids Surf. A Physicochem. Eng. Asp. 301(1-3), 264–270 (2007). 18. S. Cowen and J. R. Sambles, “Resolving the apparent ambiguity in determining the relative permittivity and thickness of a metal film using optical excitation of surface-plasmon polariton,” Opt. Commun. 79(6), 427–430 (1990). 19. S. Kumar, V. K. Shukla, and A. Tripathi, “Ellipsometric investigations on the light induced effects on tris(8hydroxyquinoline) aluminum (Alq3),” Thin Solid Films 477(1-2), 240–243 (2005). 20. V. K. Shukla and S. Kumar, “Investigations of environmental induced effects on Alq3 thin films by AFM phase imaging,” Appl. Surf. Sci. 253(16), 6848–6853 (2007). 21. S. Sellner, A. Gerlach, S. Kowarik, F. Schreiber, H. Dosch, S. Meyer, J. Pflaum, and G. Ulbricht, “Comparative Study of the Growth of Sputtered Aluminum Oxide Films on Organic and Inorganic Substrates,” Thin Solid Films 516(18), 6377–6381 (2008). 22. M. Higo, X. Lu, U. Mazur, and K. W. Hipps, “Preparation of Atomically Smooth Aluminum Films: Characterization by Transmission Electron Microscopy and Atomic Force Microscopy,” Langmuir 13(23), 6176–6182 (1997). 23. J. Worm, “Winspall 2.20 software,” 2001, http://www.mpip-mainz.mpg.de/ johanns/winspall2.ZIP 24. H. E. Bruijn, R. P. Kooyman, and J. Greve, “Determination of dielectric permittivity and thickness of a metal layer from a surface plasmon resonance experiment,” Appl. Opt. 29(13), 1974–1978 (1990). 25. U. Schröder, “Der einfluss dünner metallischer decks chichten auf die dispersion von oberflächenplasmaschwingungen in gold-silber-schichtsystemen,” Surf. Sci. 102(1), 118–130 (1981). 26. B. G. Tilkens, Y. F. Lion, and Y. L. Renotte, “Uncertainties in the values obtained by surface plasmon resonance,” Opt. Eng. 39(2), 363–373 (2000). 27. I. Pockrand, “Surface Plasma oscillations at silver surfaces with thin transparent and absorbing coatings,” Surf. Sci. 72(3), 577–588 (1978). 28. J. M. Pitarke, V. M. Silkin, E. V. Chulkov, and P. M. Echenique, “Theory of surface plasmons and surfaceplasmon polaritons,” Rep. Prog. Phys. 70(1), 1–87 (2007). 29. C. Himcinschi, N. Meyer, S. Hartmann, M. Gersdorff, M. Friedrich, H. H. Johannes, W. Kowalsky, M. Schwambera, G. Strauch, M. Heuken, and D. R. T. Zahn, “Spectroscopic ellipsometric characterization of organic films obtained via organic vapor phase deposition,” Appl. Phys., A Mater. Sci. Process. 80(3), 551–555 (2005). 30. A. B. Djurisic, C. Y. Kwong, W. L. Guo, T. W. Lau, E. H. Li, Z. T. Liu, H. S. Kwok, L. S. M. Lam, and W. K. Chan, “Spectroscopic ellipsometry of the optical functions of tris (8-hydroxyquinoline) aluminum (Alq3),” Thin Solid Films 416(1-2), 233–241 (2002). 31. M. M. El-Nahass, A. M. Farid, and A. A. Atta, “Structural and optical properties of Tris(8-hydroxyquinoline) aluminum (III) (Alq3) thermal evaporated thin films,” J. Alloy. Comp. 507(1), 112–119 (2010). 32. F. F. Muhammad and K. Sulaiman, “Utilizing a simple and reliable method to investigate the optical functions of small molecular organic films – Alq3 and Gaq3 as examples,” Measurement 44(8), 1468–1474 (2011). 33. R. R. Willey, Practical Monitoring and Control of Optical Thin Films (Willey Optical Consultants, 2007) 34. A. J. Moulé and K. Meerholz, “Interference method for the determination of the complex refractive index of thin polymers layers,” Appl. Phys. Lett. 91(6), 0619011 (2007). 35. J. A. E. Wasey and W. L. Barnes, “Efficiency of spontaneous emission from planar microcavities,” J. Mod. Opt. 47(4), 725–741 (2000). 36. R. Meerheim, M. Furno, S. Hofmann, B. Lüssem, and K. Leo, “Quantification of energy loss mechanisms in organic light-emitting diodes,” Appl. Phys. Lett. 97(25), 253305 (2010). 37. Y. Sun and S. R. Forrest, “Enhanced light out-coupling of organic light-emitting devices using embedded lowindex grids,” Nat. Photonics 2(8), 483–487 (2008).
1. Introduction Surface plasmon resonance spectroscopy (SPR) [1] is a well established optical technique widely used to monitor the physical or chemical changes occurring at a metal-dielectric interface [1–4]. The simultaneous measurement of the thickness and the refractive index of organic thin films adsorbed on the metal surface supporting the plasma-wave requires two independent measurements, following a methodology commonly named in literature as twocolors or two-medium method [5,6]. In the first one, the two measurements are performed using different wavelengths of the electromagnetic radiation interacting with the sample. In the second one the refractive index of the external medium (gas, liquid) is changed between the two measurements. While the first method implies the knowledge of the dispersion #210025 - $15.00 USD Received 11 Apr 2014; revised 11 Jul 2014; accepted 21 Jul 2014; published 29 Jul 2014 (C) 2014 OSA 11 August 2014 | Vol. 22, No. 16 | DOI:10.1364/OE.22.018914 | OPTICS EXPRESS 18915
function of the organic layer, the second one gives accurate results only when the interaction with the external fluid doesn’t induce the degradation of the organic molecules [5]. The latter method has been extensively used for the study of bio-chemical interactions and characterization of organic ultrathin films deposited by self-assembling techniques [2,7–10], but cannot be applied to the characterization of sensitive materials like luminescent organic thin films, most of the time affected by the presence of water vapor, oxygen and by the contact with organic solvents [11,12]. The experimental technique commonly used to determine the physical properties of reactive thin films is the variable angle spectroscopic ellipsometry (VASE) in vacuum or inert environment [10]. When the samples under study are inhomogeneous or present a high degree of roughness, depolarization of the incoming light occurs, and the use of more complex techniques like Mueller ellipsometry is required [13]. Ellipsometric techniques, although permitting the measurement of the complex refractive index and thickness of the samples in a wide range of wavelength (~250 - 2000 nm) and with a mean accuracy of about 0.5%, presents quite elevated costs and require the use of complicated theoretical models for data analysis and retrieval of the optical constants of the samples [14,15]. We apply here for the first time, to the best of our knowledge, a two-metal deposition (TMD) and a two-film thickness (TFT) methods for the simultaneous determination of the thickness and refractive index of thin encapsulated films of tris(8-hydroxyquinoline) (Alq3), one of the most investigated and commonly used electron transport material in Organic Light Emitting Diodes (OLEDs) and organic solar cells (OPV) [16]. The relative accuracy of the measurements performed with the proposed method is about 1%, similar to the one achievable with advanced complex ellipsometry, suggesting the use of SPR spectroscopy as a valuable and inexpensive technique for the characterization of small molecule organic thin films. 2. Fabrication of the multilayer structures and experimental set-up The thin films were deposited on Bk-7 glass slides previously cleaned and functionalized with 3-mercaptopropyltrimethoxysilane (MPTMS, 97%, purchased from Sigma-Aldrich) following the procedure described in [17]. The metals and the Alq3 were purchased respectively from Kurt J. Lesker Company and from Luminescence Technology Corp., with purity better than 99%. The thin metal films were deposited using a Leybold Univex 450 e-beam gun system in high vacuum environment (2 x 10⁻⁶ mbar) at a deposition rate of 2.1 Å/s. The thermal depositions of the organic layers were performed at a pressure of 10−5 mbar and with a rate of 1.3 Å/s using a Leybold Univex 300 equipment, integrated in a customized MBraun glove box with gas purifier. The multilayer structure was kept in nitrogen environment and eventually encapsulated bonding a clean quartz slide on the upper side of the sample with a thin bead of epoxy based adhesive, in a similar way as reported in [11]. The thickness of each deposition was controlled in situ through a quartz crystal monitor and confirmed by measurements performed with a profilometer of Veeco, model Dektak 150 with a resolution of about 2 nm. In order to apply the TMD and TFT methods we fabricated and encapsulated the two kinds of multilayer structures depicted in Fig. 1. The TMD sample was characterized by a thin film of Alq3 with a nominal thickness of 23.0 nm deposited over 2 thin adjacent layers of gold and silver, while the TFT sample presented a unique thin layer of gold covered by 2 thin films of Alq3 with nominal thicknesses t1 = 32.0 nm and t2 = 16.5 nm.
#210025 - $15.00 USD Received 11 Apr 2014; revised 11 Jul 2014; accepted 21 Jul 2014; published 29 Jul 2014 (C) 2014 OSA 11 August 2014 | Vol. 22, No. 16 | DOI:10.1364/OE.22.018914 | OPTICS EXPRESS 18916
Fig. 1. Scheme of the encapsulated multilayer structures used to perform the TMD and TFT methods. All the samples presented a region with only bare metals that was used to characterize the metal deposition by SPR spectroscopy.
The experimental set-up used to perform the measurements consists in a classical SPR spectrometer in the Kreschtmann configuration [1] and is sketched in Fig. 2. The excitation beam comes from a linearly polarized He-Ne laser source at the wavelength of 633 nm. The light is p-polarized by a linear polarizer (P) and is divided into two beams by a beam splitter (BS). The power of the reference beam is measured by a silicon based photo detector (DR) of ThorLabs (Det36A), while the transmitted beam is reflected at an angle θ by a triangular prism of BAK1 and is finally detected by a second photo detector (DS).
Fig. 2. Sketch of the SPR spectrometer in the Kreschtmann configuration [1]. The excitation beam comes from a linearly polarized He-Ne laser source at the wavelength of 633 nm. The light is p-polarized by a linear polarizer (P) and is divided into two beams by a beam splitter (BS). The power of the reference beam is measured by the photo detector DR while the transmitted beam is reflected at the hypotenuse of the triangular prism and detected by a second silicon based photo detector DS. The collected data are finally sent to a personal computer (PC) to compute the curve of reflectivity R of the samples in function of the angle of incidence θ.
The samples were optically coupled to the prism by the use of a thin layer of glycerin and were mounted on a programmable gyratory base of SigmaKoki (SGSP-80Y AW) kept in a temperature monitored dark environment. The home made silicon based photo detector is characterized by a large active surface (1 cm x 2 cm) which permits to vary the angle of incidence in a range of about 30° and characterize without ambiguity the optical constants of the thin metal films [18]. The collected data are finally sent to a personal computer (PC) to compute the curve of the reflectivity of the samples in function of the angle of incidence θ. The dark environment and the encapsulation prevented the Alq3 thin film from degradation and phase transformation, which might heavily affect the value of the refractive index of the organic deposition and the characteristics of the metal-organic interface [19,20].
#210025 - $15.00 USD Received 11 Apr 2014; revised 11 Jul 2014; accepted 21 Jul 2014; published 29 Jul 2014 (C) 2014 OSA 11 August 2014 | Vol. 22, No. 16 | DOI:10.1364/OE.22.018914 | OPTICS EXPRESS 18917
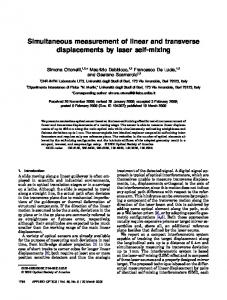
3. Characterization of the samples 3.1 AFM measurements The roughness of the surfaces of the metal and organic depositions has been preliminarily analyzed by an AFM instrument of Park System, model NX10. The scans have been realized in non-contact mode using a silicon tip with a spring constant of 42 N/m and a typical cantilever tip radius of 10 nm. The AFM images of the bare gold and of the organic layer deposited on the metal are shown respectively in Fig. 3(a) and 3(b). The typical surface root mean square (RMS) roughness, evaluated on extended regions of 25 μm2, is of the order of 0.9 nm for the bare metal layers and decrease to a value of 0.4 nm for the metal-organic bilayers. These values of RMS roughness are typical of metal depositions over glass substrates performed at low deposition rates (~2 Å/s) [21,22], and don’t perturb the propagation of the surface plasmon polariton along the metal organic interface [1].
Fig. 3. AFM images of a 49 nm thick gold layer (a) and of a film of Alq3 with a thickness of 23.0 nm deposited on the metal (b). The images show a region of 1 μm2.
3.2 Analysis of the samples by SPR spectroscopy The quality of the encapsulation of the samples and the stability of the optical set-up were evaluated by monitoring real time the SPR curve of the samples over 48 hours. The magnitude of the reflectivity at the resonance angle didn’t change with time and we observed a maximum variation in the position of the resonance angle of about 0.07°, consistent with an angular drift of about 0.001° per hour and due to a slow temperature drift in the laboratory. The FWHM of the SPR curve is constant with time, which indicates that there is no alteration in the morphology of the Au/Alq3 interface. All the experimental results have been analyzed using the free software Winspall 3.02 [23] based on the transfer matrix formalism and capable to retrieve the parameters of the multilayer stack by a best fit procedure between the theoretical and experimental SPR curve. The uniformity of the metal layers deposited with the e-beam gun apparatus was previously investigated on independent samples presenting only bare metal depositions. The measurement of the thickness tm and complex dielectric function εm = (εr + I εi) of the metal thin films has been performed analyzing by SPR spectroscopy 30 different points contained in a region of about 2 cm2. Table 1 shows our results for silver and gold depositions. The mean values of the complex refractive index of the metals are in good agreement with those reported in literature [6,24,25]. The standard deviations δεr, δεI and δtm were obtained by a statistical analysis on the experimental results and are very similar to the accuracy in the theoretical determination of the parameters of the metal thin films using data-fitting techniques [24,26].
#210025 - $15.00 USD Received 11 Apr 2014; revised 11 Jul 2014; accepted 21 Jul 2014; published 29 Jul 2014 (C) 2014 OSA 11 August 2014 | Vol. 22, No. 16 | DOI:10.1364/OE.22.018914 | OPTICS EXPRESS 18918
Table 1. Mean values and standard deviation of the complex dielectric constant (εr + I εi) and thickness tm of the bare metal films obtained investigating a region of about 2 cm2 by SPR spectroscopy. The accuracy of the values reflects the non homogeneity of the metal deposition. Metal Ag Au
εr −17.24 −11.76
εi 0.70 1.57
tm 45.3 48.6
δεr(%) 0.3 0.5
δεi(%) 3.1 4.9
δtm(%) 0.8 1.0
Fig. 4. Experimental and theoretical SPR curves of the TMD and TFT samples. On the left, the black and the gray edged points correspond respectively to the measurements on the bilayer with silver and gold metal films and a deposition of Alq3 with a nominal thickness of 23 nm. The continuous lines are the best fit on the experimental data. On the right are represented the SPR curves of the TFT sample. The black and the gray edged points correspond to the measurements on the bilayers with a double deposition of Alq3 with a nominal thickness t1 = 32.0 nm and t2 = 16.5 nm over a gold film. The continuous lines are the best fit on the experimental data.
Both the TMD and TFT samples that we fabricated presented 2 regions of about 0.5 cm2 with bare metal surface. These regions, adjacent to the organic deposition, were used to determine the thickness and complex dielectric function of the gold and silver layers. The errors associated to the measurement were considered to be the same as the standard deviations reported in Table 1. Once characterized the bare metal surface, SPR spectroscopy was then performed over the adjacent part of the samples containing the organic thin films. In Fig. 4 are shown the SPR curves measured on our samples and the corresponding theoretical fit. 3.3 Retrieval of the thickness and refractive index of the organic layer The angle of resonance of each one of the SPR curves in Fig. 4 is associated to a continuous set of the possible values of thickness (to) and dielectric constant (εo) of the corresponding organic thin film [6]. For transparent dielectric coatings with a thickness of the order of a few nanometers, these set of values might be obtained using analytical expressions of the dispersion relation of the surface plasma oscillations at the first and second order in the ratio to/λ, where λ is the wavelength of laser radiation [27]. Following the arguments of Pockrand [27], when the external medium is air, the real part of the component of the wave vector KSPP of the surface plasmon polariton (SPP) parallel to the metal-organic interface can be approximated as: k SPP ≈ k0 + Δk1 + Δk2 ,
(1)
1 ε 2 m k0 = Re , c ε m + 1
(2)
ω
#210025 - $15.00 USD Received 11 Apr 2014; revised 11 Jul 2014; accepted 21 Jul 2014; published 29 Jul 2014 (C) 2014 OSA 11 August 2014 | Vol. 22, No. 16 | DOI:10.1364/OE.22.018914 | OPTICS EXPRESS 18919
2
1 2π t ω ε −1 ε ε − ε o Δk1 = o r o r ( −ε r ) 2 , c εo ε r + 1 1 − ε r λ
Δk 2 =
1 2 − ε o 2 (ε r + 1) 2 − Δk1 . 2 ko (1 − ε o )
(3)
(4)
In the relations above ω, λ and c are respectively the frequency, wavelength and velocity of light, while εm = (εr + I εi) is the dielectric constant of the metal film. The quantity Ko is the real part of the SPP wave vector at the metal/air interface in the absence of the dielectric layer, while ΔK1 and ΔK2 express the shift of the SPP wave vector in the presence of an organic thin film at the first and second order in the ratio to/λ. In Fig. 5 we compare the dependence of the SPP wave vector on the thickness of an organic thin film of Alq3 using the Eq. (1) and computing the exact value of KSPP by the use of the Winspall software. We performed the simulations at the wavelength of 633 nm, considering a value of the refractive index of Alq3 of 1.72 [19], together with the parameters of the thin silver and gold films reported in Table 1.
Fig. 5. Simulations of the wave vector of the SPP relative to gold/Alq3 and silver/Alq3 interfaces in function of the thickness of the organic layer. The simulations have been performed using the Eq. (1) ( silver/Alq3, ∆ gold/Alq3) and the numerical approach of the Winspall software ( silver/Alq3, gold/Alq3). The wavelength of the light is 633 nm, the value of the refractive index of Alq3 is considered to be 1.72 [19], while the values of the thickness and dielectric constant of the metal films are the same as reported in Table 1.
The simulations reveal that the use of the approximation of Pockrand in the analysis of a film of Alq3 as thin as 1.0 nm would lead to a relative error of about 10% in the determination of its thickness, independently from the choice of the metallic layer. Moreover, very thin organic films deposited by thermal evaporation commonly form a composite interface, whose characterization requires the use of effective medium theoretical approaches [28]. Aiming to the experimental determination of the organic thin film parameters with an accuracy as good as the one achievable with ellipsometric techniques, we preferred to deposit organic layers thicker than 10 nm, and to use the Winspall software to calculate the possible solutions in the toεo-plane associated to the experimental value of the SPP wave vector. The results of our numerical calculations are shown in Fig. 6.
#210025 - $15.00 USD Received 11 Apr 2014; revised 11 Jul 2014; accepted 21 Jul 2014; published 29 Jul 2014 (C) 2014 OSA 11 August 2014 | Vol. 22, No. 16 | DOI:10.1364/OE.22.018914 | OPTICS EXPRESS 18920
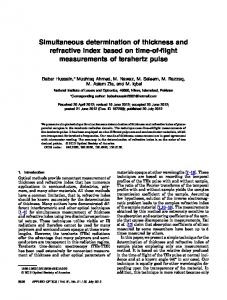
Fig. 6. Calculated points representing the possible values of thickness (to) and dielectric constant (εo) of the organic layers over the TMD and TFT samples. In the latter the ratio between the thicknesses t1 and t2 of the different organic layers is known, and the intersection point corresponding to the actual characteristic of the thin film is obtained by shifting one set of points. The points are generated using the mean value of refractive index of the metal depositions.
4. Discussion In the case of the TFT sample the ratio between the thicknesses t1 and t2 of the different organic layers is known, and the intersection point in the plane εo, to corresponding to the actual characteristic of the thin film is obtained by shifting one set of points. The values associated to the intersection point depend on the dielectric constant and the thickness of the metal deposition supporting the plasma wave. The same calculus was then performed cyclically by varying the characteristics of the metal layer in the limits dictated by the accuracy reported in Table 1. Our simulations demonstrated that variations of the thickness and of the imaginary part of the dielectric constant of the metals have a second order effect on the determination of thin organic film parameters. This is evident in Fig. 7(a), where the parameters of the TFT sample are reconstructed varying separately εr, εI and tm. For the sake of simplicity and without losing any fundamental information, we show in Fig. 7(b) the dispersion of the results for both the TFT and TMD samples by varying only the real part of the dielectric function of the metal layers. While the TMD configuration might be applied to study the interface effects between the organic and the different metal layers, it doesn’t seem appropriate for the precise characterization of the organic thin film. In this case the errors associated to the values of the dielectric function of both the silver and gold layers induce a high dispersion of the possible values of thickness (to) and dielectric constant (εo) of the organic layer. On the other hand the dispersion of the data in Fig. 7(b) suggests that the accuracies in the measurement of the refractive index and the thickness of the organic layer by the TFT method are respectively of 1% and 2%, similar to those achieved by the use of VASE [14,15]. The SPR measurements were repeated on other two samples to check the reproducibility of the methods.
#210025 - $15.00 USD Received 11 Apr 2014; revised 11 Jul 2014; accepted 21 Jul 2014; published 29 Jul 2014 (C) 2014 OSA 11 August 2014 | Vol. 22, No. 16 | DOI:10.1364/OE.22.018914 | OPTICS EXPRESS 18921
Fig. 7. Calculated points representing the possible values of thickness (to) and dielectric constant (εo) of the organic layers over the TFT and TMD samples. (a) Dispersion of the points obtained for the TFT sample by varying the parameters εr, εI and tm of the gold deposition in the limits dictated by the accuracy reported in Table 1. (b) Dispersion of the points obtained for the TFT and TMD samples by varying only the real part of the dielectric constant of the metal depositions.
The values we obtained for the real part of the refractive index of Alq3 at the wavelength of 633 nm are coherent with the ones reported by different authors using spectroscopic ellipsometry and spectrophotometric techniques [19, 29–32]. In Table 2 we compare our results and accuracy with the ones present in literature. Table 2. Mean values and accuracy in the measurement of the refractive index of Alq3 at the wavelength of 633 nm as reported by us and other authors. Technique Spectroscopic ellipsometry Spectrophotometric SPR (TMD) SPR (TFT)
1.72 [19] 1.73 [31] 1.80 1.75
nAlq3 1.73 [29] 1.77 [32] 1.70 1.73
1.78 [30]
Accuracy ~0.5%
1.79 1.74
~4.0% ~1.0%
It’s worth noting that the accuracy of the TFT method relies on the precise determination of the actual ratio of the thicknesses t1 and t2 of the organic depositions. In order to control the dependence of the measurement of the refractive index on the reproducibility of the deposition process, the organic films were deposited simultaneously during the same deposition cycle, with the help of a programmable electro-mechanical shield. The shield actuated to cover different parts of the sample during the thermal evaporation, switching from one position to the other when the reading of the quartz crystal micro balance in the vacuum chamber reached a predetermined value. Nevertheless, the effectiveness of the TFT method doesn’t rely on the calibration of the so called tooling factor [33] of the evaporation process but, vice versa, could be applied for the precise determination of this parameter. To demonstrate the potentiality of the proposed method we restricted ourselves to the characterization of organic thin films with a thickness between 10 and 30 nm. While it seems difficult to be able to characterize with a good accuracy organic thermally deposited layers with a thickness lower than 10 nm, due to the increased roughness of the corresponding surface, the technique might as well be applied to the characterization of thicker samples. The use of a large area photo detector like the one used in the present work, together with substrates and prisms of high refractive index materials like SF4, extend the range of applicability of this method to thicknesses of the order of about 60 nm, thus covering the range usually used for the fabrication of organic devices. Finally, we point out that the use of light sources as compact laser diode modules, although interesting for the development of a low-cost multi-wavelength instrument for the characterization of organic thin films, has to be accompanied by a rigorous evaluation of the accuracy of the measurements, due to the larger bandwidth of this kind of laser source.
#210025 - $15.00 USD Received 11 Apr 2014; revised 11 Jul 2014; accepted 21 Jul 2014; published 29 Jul 2014 (C) 2014 OSA 11 August 2014 | Vol. 22, No. 16 | DOI:10.1364/OE.22.018914 | OPTICS EXPRESS 18922
4. Conclusion In conclusion, we demonstrated that SPR spectroscopy can be used as an inexpensive, robust, and non-invasive metrology tool to determine relevant optical parameters of small molecular organic thin films in inert gas environment. Once known the thickness of the organic layer, the imaginary part of its refractive index might be deduced from spectrophotometric measurements of transmittance and reflectance [32,34]. Moreover, a proper design of the samples would allow applying our approach also to the layer by layer characterization of thin films stacks containing depositions of multiples organic materials. This seems particularly interesting for the optical modeling and diagnostics of organic electroluminescent devices like OLEDs, where the knowledge of the value of the refractive index of the thin layers is fundamental to determine the energy losses and the light extraction efficiency [35–37]. Acknowledgments The authors wish to thank Prof. Rodrigo Prioli and Dr. Elizandra Martins Silva (PUC-Rio) for the AFM images. Funding from FAPERJ, CNPq and INEO-INCT are acknowledged.
#210025 - $15.00 USD Received 11 Apr 2014; revised 11 Jul 2014; accepted 21 Jul 2014; published 29 Jul 2014 (C) 2014 OSA 11 August 2014 | Vol. 22, No. 16 | DOI:10.1364/OE.22.018914 | OPTICS EXPRESS 18923