2481 The Journal of Experimental Biology 210, 2481-2488 Published by The Company of Biologists 2007 doi:10.1242/jeb.001909
Acoustic feature recognition in the dogbane tiger moth, Cycnia tenera James H. Fullard1,*, John M. Ratcliffe2 and Christopher G. Christie1 1
Department of Biology, University of Toronto at Mississauga, Mississauga, Canada, L5L 1C6 and 2Department of Neurobiology and Behavior, Cornell University, Ithaca, NY 14853, USA *Author for correspondence (e-mail:
[email protected])
Accepted 17 April 2007 Summary Certain tiger moths (Arctiidae) defend themselves against bats by phonoresponding to their echolocation calls with trains of ultrasonic clicks. The dogbane tiger moth, Cycnia tenera, preferentially phonoresponds to the calls produced by attacking versus searching bats, suggesting that it either recognizes some acoustic feature of this phase of the bat’s echolocation calls or that it simply reacts to their increased power as the bat closes. Here, we used a habituation/generalization paradigm to demonstrate that C. tenera responds neither to the shift in echolocation call frequencies nor to the change in pulse duration that is exhibited during the bat’s attack phase unless these changes are accompanied by either an increase in duty
cycle or a decrease in pulse period. To separate these features, we measured the moth’s phonoresponse thresholds to pulsed stimuli with variable versus constant duty cycles and demonstrate that C. tenera is most sensitive to echolocation call periods expressed by an attacking bat. We suggest that, under natural conditions, C. tenera identifies an attacking bat by recognizing the pulse period of its echolocation calls but that this feature recognition is influenced by acoustic power and can be overridden by unnaturally intense sounds.
Introduction Information is encoded in sounds via their frequency, duration and amplitude, and the auditory systems of vertebrates use multicellular neural systems to discriminate the salient from irrelevant components of those sounds (Alain and Arnott, 2000). Insects are also capable of similar discrimination abilities (Hoy, 1989; Wyttenbach and Farris, 2004; Schul and Sheridan, 2006) and perform them with far fewer neurons. Of all insects, the ears of moths represent the simplest auditory systems, possessing only one to four auditory receptor cells (Eggers, 1919; Yack, 2004). With some exceptions (Conner, 1999), moths use their ears solely to detect the echolocation calls of hunting bats and evoke escape behaviours appropriate to the threat presented by the bat. To determine what that threat is, the moth must acoustically estimate the proximity of the bat as gauged by its echolocation calls, since other cues (e.g. visual) are of presumably little or no use to these insects for bat detection when flying at night (Fullard and Napoleone, 2001; Soutar and Fullard, 2004). Griffin et al. categorized the echolocation calls of aerial hawking bats into three phases based on changes in call duration, period (the time from the start of one call to the start of the next) and frequency (Griffin et al., 1960). Search-phase calls are emitted first and are defined as having periods of 50·ms or more. It is assumed that during this phase, bats have not yet detected a potential target. After a bat has detected a target (Kick and Simmons, 1984; Wilson and Moss, 2004) it emits approachphase calls that are shorter in duration and period (10–50·ms)
and are marked by an increase in their lowest frequencies (Surlykke and Moss, 2000). Once the bat has decided to complete its attack, it emits terminal (buzz)-phase calls that are very short (~1–2·ms), have periods of less than 10·ms (which increases the duty cycle – the percentage of time that the bat is actively producing sound) and are of lower peak frequency than either search or approach calls. While this three-phase heuristic has proved a valuable tool for comparative analysis of bat species and hunting strategies (e.g. Kalko, 1995; Ratcliffe and Dawson, 2003), it can be simplified from the perspective of the insect into two phases: (1) search-phase calls that signify a bat before it has detected its target and (2) attack-phase calls (approach + terminal) that signify a bat after it has detected a target and has begun to actively pursue it. Insects react bimodally to these calls: to search-phase calls with primary defences intended to conceal them from the bat before it has detected them and to attack-phase calls with secondary defences designed to rapidly evade the now-aware bat. Roeder proposed that the bimodal defence response of noctuid moths is based upon their perceived intensity of the bats’ calls (Roeder, 1966; Roeder, 1974). According to this theory, moths react to distant bats (i.e. faint calls) with directional controlled flight away from the bat, a defensive behaviour evoked by the most sensitive auditory receptor, the A1 cell. When confronted by near bats (i.e. intense calls), moths switch to erratic flight or cease flying altogether, responses elicited by the less sensitive A2 receptor cell. Skals and Surlykke supported this hypothesis by concluding that flight
Key words: bat echolocation, tiger moth, phonoresponse, defensive behaviour, Cycnia tenera.
4(%*/52.!,/&%80%2)-%.4!,")/,/'9
2482 J. H. Fullard, J. M. Ratcliffe and C. G. Christie cessation in the moth Galleria mellonella was triggered by the rise in acoustic power (as perceived by the moth) caused by increased duty cycle of the attack-phase calls (hereafter the ‘acoustic power hypothesis’) (Skals and Surlykke, 2000). While changing call intensity will provide a measure of the relative distance of a searching distant bat (assuming it does not change its emitted level), this cue may become unreliable to an erratically moving moth for a bat beginning its attack. Temporal and spectral changes to the bat’s calls, on the other hand, present acoustic cues that should provide less ambiguous information about the bat’s switch from search to attack phase, and moths may possess the ability to recognize such cues (hereafter the ‘acoustic recognition hypothesis’). When stimulated by the echolocation calls of an attacking bat, the dogbane tiger moth (Cycnia tenera) phonoresponds with trains of ultrasonic clicks generated by thoracic tymbals. These sounds warn the bat of its noxious qualities [aposematism (Dunning and Roeder, 1965; Hristov and Conner, 2005)] and/or interfere with the bat’s echolocation [jamming (Fullard et al., 1979; Fullard et al., 1994; Miller 1991)]; aposematism and jamming may act synergistically because negativecue/negative-consequence associations should be readily made (Ratcliffe and Fullard, 2005). The phonoresponse is a stereotyped behaviour that can be used to examine auditory perception in this moth and what cues it uses to evoke its acoustic defence (Fullard, 1979; Fullard, 1984; Fullard et al., 1994; Barber and Conner, 2006). Male, and rarely female, Cycnia tenera also emit these sounds during mating (Conner, 1987) but they are not elicited as a phonoresponse to conspecific clicks (Fullard and Fenton, 1977) and social functions should not influence whatever acoustic cues it uses to evoke this defensive behaviour. Fullard reported that C. tenera preferentially phonoresponds to stimulus pulse periods that resemble those of a bat’s echolocation calls when it is in its attack phase and argued that recognizing the pulse period of the bat’s echolocation attack sequence reduces the moth’s chances of inappropriately clicking to sounds of pulse periods that are either too high (e.g. searching bats) or too low (e.g. chorusing insects) (Fullard, 1984). The stimuli used by Fullard (Fullard, 1984) did not closely resemble bat calls in that they were of a constant frequency and duration while real bats manipulate these acoustic characteristics as they change from search to attack phase. Fullard et al. (Fullard et al., 1994) provided a more realistic stimulus to C. tenera by using the calls recorded in a laboratory from a free-flying bat (Eptesicus fuscus) as it attacked a target and again demonstrated that C. tenera times its phonoresponse to attack calls. These results were confirmed in flight-cage experiments with wild-caught, free-flying Myotis septentrionalis bats (Ratcliffe and Fullard, 2005). Barber and Conner (Barber and Conner, 2006) also reported the attackstage phonoresponse of C. tenera and demonstrated that other (but not all) tiger moths phonorespond when the bat is less than a second from contact. While these studies confirm that C. tenera is most sensitive to the calls of an attacking bat, the question remains, does this insect recognize some specific signature (i.e. frequency, duration, period) of these calls, as suggested by Fullard (Fullard, 1984), or does it simply respond to its perceived increase in the calls’ acoustic power as the bat
closes (Skals and Surlykke, 2000)? In the current paper, we use the phonoresponse of C. tenera and two auditory psychophysical methods [thresholds and habituation/ generalization (H/G)] to test for acoustic feature recognition in this insect and interpret these results in the context of this animal’s defence against naturally hunting bats. Materials and methods Animals Cycnia tenera Hübner were reared in the field from eggs collected from wild specimens captured at the Queen’s University Biological Station in Chaffeys Lock, Ontario, Canada, raised to pupae on local plants (Apocynum androsaemifolium and A. cannabinum) and stored in constanttemperature rooms at 4°C with a 12·h:12·h light:dark photoperiod for 5·months. Pupae were transferred to 16·h:8·h light:dark rooms at 25°C, and adults emerged 2–3·weeks later. Adults were allowed to mature for 24–48·h and were then tested during the nocturnal part of their diel cycle. Acoustic stimulation Individual moths were fastened by their descaled mesothoracic terga to the head of a dissecting pin with a drop of molten Cenco Softseal Tackiwax (Cenco Scientific, Chicago, IL, USA) and suspended 20·cm above a Technics EAS10TH400B (Panasonic, Matsushita Electric Industrial Co. Ltd, Kadoma City, Japan) speaker in a chamber lined with sound-attenuating foam. Moths were positioned under red light and were then left in complete darkness for 20·min before playbacks began. Continual tones produced by either a Wavetek (model 23) (Willtek Communications, Ismaning, Germany) or Hewlett-Packard (Hewlett-Packard, Palo Alto, CA, USA) signal generator (model 3311A) were shaped with a 0.5·ms rise/fall time to various durations and periods (Coulbourn S84-04; Coulbourn Instruments, Allentown, PA, USA), amplified (National Semiconductor LM1875T; National Semiconductor Corp., Santa Clara, CA, USA) and broadcast from the Technics speaker. Certain of the stimulus trains were stored on a Racal Store 4D tape recorder (Racal Acoustics Ltd, Harrow, UK) running at ~76·cm·s–1 (as internally calibrated), while others were recorded as .wav files onto a PC laptop using a 500·kHz sampling rate PCMCIA card (DAQ Card-6062E; National Instruments, Austin, TX, USA) controlled by the programme BatSound Pro v.3.30 (Pettersson Elektronik AB, Uppsala, Sweden). Stimulus trains were either played back using the Racal tape recorder or the playback feature of the BatSound Pro programme and DAQ Card. Playback intensities were recorded as mV peak-to-peak and were later converted to peak equivalent dB sound pressure level (peSPL) (re 20·!Pa rms) from equalamplitude continual tones using a Brüel and Kjær (B&K) (Nærum, Denmark) type 4135 6.35·mm microphone and type 2610 B&K measuring amplifier. The system was regularly calibrated with a B&K type 4228 pistonphone. Stimuli were presented to the moth as trains of pulses of different durations, frequencies and periods depending upon the experiment. Phonoresponse The phonoresponse in C. tenera (Fig.·1A) was generated by exposing moths to acoustic stimuli as generated by the
4(%*/52.!,/&%80%2)-%.4!,")/,/'9
Acoustic recognition in a moth 2483 aforementioned methods. Tymbal sounds are generated as trains of clicks [modulation cycles (MC) (Blest et al., 1963)] that result from the in and out buckling of the striated tymbal surface (Fullard and Fenton, 1977) and were recorded with the B&K microphone and measuring amplifier onto the Racal tape recorder. Phonoresponse recordings were played at S real-time tape speed into a data acquisition board (TL-2; Axon Instruments, Molecular Devices Corporation, Sunnyvale, CA, USA) at a 20·kHz sampling rate and stored on a PC, and files were subsequently analysed using the programme AxoScope 8.1 (Axon Instruments). Certain trials were recorded using the DAQ Card and stored and analysed as .wav files using BatSound Pro.
A
Modulation cycle Stimulus
10 ms
B Initial habituation pulse train (duty cycle = 10%)
Tenth habituation pulse train (duty cycle = 10%)
Test pulse train (duty cycle = 20%)
90 ms Percentage of initial response (number of MCs)
C
100 80
Test
60 Generalization
40 20 0
Habituation 0
10 Stimulus train #
20
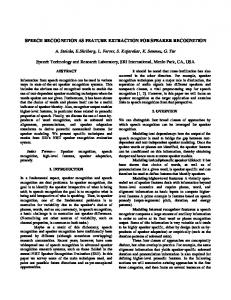
Fig.·1. The tymbal phonoresponse of Cycnia tenera. (A) Oscillogram of one stimulus pulse in a pulse train and the tymbal sounds as a series of clicks within a single modulation cycle (Blest et al., 1963). (B) The habituation/generalization (H/G) paradigm. (Top) Initial stimulus pulse train and moth phonoresponse. (Middle) Tenth pulse train where the moth has completely habituated. (Bottom) Test pulse train stimulus showing lack of generalization in the moth’s phonoresponse. (C) Measurements taken from one H/G trial. Responses were the number of tymbal modulation cycles per stimulus pulse train (normalized to the percentage change from initial response). Habituation was determined if the slope of a linear regression applied to the response decrease was significantly less than 0; lack of generalization (i.e. expressed stimuli discrimination) was determined from pooled habituated animals if the test stimulus response was significantly greater than the average of the last habituated responses.
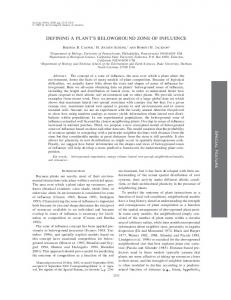
Threshold trials For neural examinations, we exposed the auditory nerves (IIIN1b) (Nüesch, 1957) of male and female C. tenera and recorded auditory receptor cell action potentials with a stainless steel hook electrode referenced to another electrode placed in the moth’s abdomen (Fullard et al., 1998). Responses were amplified with a Grass Instruments P-15 pre-amplifier (Quincy, MA, USA). Auditory threshold curves (audiograms) were derived for each moth using trains of 20·ms acoustic pulses (produced as described above) with 500·ms periods at 5·kHz frequency increments randomly chosen from 5 to 100·kHz. A1 cell threshold was determined as the stimulus intensity that evoked two receptor spikes per stimulus pulse. For behavioural threshold trials, we positioned individual C. tenera above the speaker as described above and exposed them to trains of pulses of various durations, frequencies and periods. The intensity of the pulse trains was raised from zero to the point when the moth just began to phonorespond. Habituation/generalization trials We used a habituation/generalization (H/G) paradigm (Thompson and Spencer, 1966) to test whether C. tenera discriminated changes to various parameters in the acoustic stimulation applied to them. Fig.·1 describes the stimulation regime applied to each moth; in all cases, response was measured as the number of tymbal modulation cycles that the moth produced during the stimulus trains (counting MCs was facilitated by treating the files to a 40·kHz high-pass filter that eliminates the stimulus pulses while preserving the tymbal clicks). The first part of the trial began with the habituating stimulus (Fig.·1B, top and middle) consisting of a 95·dB peSPL [20·cm, equal to approximately 101·dB source level (10·cm)] train of pulses of a particular frequency, duration and period. This stimulus train was one second in duration and was repeated 20 times. Each trial was separated from the next by one second of silence. This was followed one second later by the test stimulus, consisting of a single train of pulses that differed from the habituating stimulus in a single acoustic parameter (Fig.·1B, bottom). Habituation was determined for each individual moth by applying a linear regression to the raw response data and then testing for a significantly negative departure from a slope of zero (F-test) (Fig.·1C). Only moths that habituated were used in subsequent analyses. To control for inter-individual responsiveness, modulation cycle numbers were normalized as the percentage of the response to the first pulse train. We tested for stimulus generalization by comparing test stimulus responses (trial 21) to responses to the last pretest stimulus train (trial 20) by using paired-sample t-tests (Zar, 1999). Results Stimulus frequency Threshold trials The individual and median neural audiograms for five male and five female C. tenera are shown in Fig.·2A and reflect the broad ultrasound sensitivity reported for this moth both neurally (Fullard and Dawson, 1999) and behaviourally (Fullard, 1984). The moth reveals a uniform sensitivity for frequencies between 30 and 50·kHz. This bandwidth was used in habituation/test of
4(%*/52.!,/&%80%2)-%.4!,")/,/'9
2484 J. H. Fullard, J. M. Ratcliffe and C. G. Christie Percentage of initial response
stimulus generalization trials to determine if the moth would discriminate between pulse trains of different frequencies. H/G trials Sixteen individual C. tenera were habituated using trains of 5·ms, 50·kHz pulses at 95·dB peSPL (20·cm) and independently tested with pulse trains of 42, 44, 46, 48 and 50·kHz with equal duty cycles of 10%. Fig.·2B shows that no significant (P>0.05, paired-sample t-tests) differences exist between habituated 50·kHz responses and those to any of the test frequencies.
Stimulus threshold (dB peSPL)
Stimulus duration H/G trials We first ran a series of 5·ms/10·ms H/G trials in which we compared habituated and test stimuli responses to pulse trains of equal (10%/10%) and unequal (10%/20%) duty cycles. The results are illustrated in Fig.·3 and indicate that C. tenera generalizes (i.e. does not differentiate) between a 5·ms increase or decrease in pulse duration when duty cycles are maintained at 10%. When pulse train duty cycles were doubled, moths generalized to pulse durations that were twice the duration but if this increase in duty cycle was accompanied by a halving of pulse period, moths exhibited a vigorous re-initiation of clicking to shortened pulses. To test for the effects of pulse train duty cycle, we ran a set of H/G trials in which we exposed moths to habituation pulse trains of 5·ms in duration with a period of 50·ms (i.e. duty cycle of 10%) and then tested for generalization to pulse train pulses
A
120
Male Female
110 100 90 80 70 60 50 40
0
20 40 60 80 Stimulus frequency (kHz)
100
600 500 400
Last habit response Test response 10 Duty cycle (%) 50 Pulse period (ms)
150 100
(3)
(3)
(4)
50
10 10 50 100 5–10
0
10 10 10 20 50 50 100 50 5–10 10–5 Pulse duration (ms)
of 15, 10, 8, 6 and 5·ms of equal periods, which resulted in decreasing duty cycles. Fig.·4 reveals that, for moths to cease generalizing, the test pulse duty cycle needed to be 60% or higher than the habituating stimuli. Stimulus period Threshold trials When stimulus pulses were delivered using variable duty cycles (Fig.·5A, top), moths exhibited a maximum sensitivity to a pulse train period of 20·ms (i.e. 50·pulses·s–1) with increased thresholds to shorter and longer pulse periods (i.e. the response was tuned). The duty cycle at 20·ms for a 2·ms pulse duration was 10% so we ran another series of threshold trials using duty cycles below (6.7%) and above (20%) this value to determine if acoustic power would account for the tuning. To hold the duty cycles constant we had to change the pulse durations for each period used. Fig.·5A (middle) illustrates the pulse period tuning curve for a duty cycle of 6.7% and shows that the moths exhibited no particular tuning. However, when the duty cycle
60 (5) 40
(5)
(5)
(4)
20 10 10 1010 10 10 10 10 10 10 50 50 5050 50 50 50 50 50 50 0 50–42 50–44 50–46 50–48 50–50 Pulse frequency (kHz)
Fig.·2. (A) Audiograms of C. tenera (N=5 males, 5 females), individuals as circles, gender medians as bold lines. (B) Habituation/generalization (H/G) trials of individual C. tenera (N=20). Values are means + 1 s.d., sample sizes in parentheses; no significant differences (P>0.05, paired-sample t-tests) exist in any of the trials.
Percentage of initial response
Percentage of initial response
B
Last habit response Test response 10 Duty cycle (%) 50 Pulse period (ms) (5)
10 20 100 25 10–5
Fig.·3. Habituation/generalization (H/G) trials of C. tenera (N=3–6) stimulus duration discrimination. 5–10, habituation pulse trains of pulse durations of 5·ms, test pulse train of pulse duration of 10·ms, equal and unequal duty cycles; 10–5, habituation pulse trains of pulse durations of 10·ms, test pulse train of pulse duration of 5·ms, equal and unequal duty cycles. Values are means + 1 s.d., sample sizes in parentheses; asterisks mark significant differences (P