THE JOURNAL OF BIOLOGICAL CHEMISTRY © 2000 by The American Society for Biochemistry and Molecular Biology, Inc.
Vol. 275, No. 41, Issue of October 13, pp. 31747–31754, 2000 Printed in U.S.A.
Activation of Apolipoprotein AI Gene Expression by Protein Kinase A and Kinase C through Transcription Factor, Sp1* Received for publication, January 27, 2000, and in revised form, May 9, 2000 Published, JBC Papers in Press, May 26, 2000, DOI 10.1074/jbc.M000621200
Xi-Long Zheng‡§¶, Shuji Matsubara‡§, Catherine Diao‡§, Morley D. Hollenberg‡储, and Norman C. W. Wong‡§** From the Endocrine Research Group, Departments of ‡Medicine and §Biochemistry & Molecular Biology and 储Pharmacology & Therapeutics, the Faculty of Medicine, University of Calgary, Calgary, Alberta T2N 4N1, Canada
Apolipoprotein AI is the dominant and most important structural protein component of the antiatherogenic high density
* The costs of publication of this article were defrayed in part by the payment of page charges. This article must therefore be hereby marked “advertisement” in accordance with 18 U.S.C. Section 1734 solely to indicate this fact. ¶ Recipient of a fellowship award from the Heart and Stroke Foundation of Canada. ** Recipient of scientist awards from the Medical Research Council and Alberta Heritage Foundation for Medical Research. To whom correspondence should be addressed: Depts. of Medicine and Biochemistry and Molecular Biology, Faculty of Medicine, University of Calgary, Health Sciences Center, 3330 Hospital Dr. NW, Calgary, Alberta T2N 4N1, Canada. Tel.: 403-220-5212; Fax: 403-270-0979; E-mail:
[email protected]. This paper is available on line at http://www.jbc.org
lipoprotein (HDL)1 particles (1, 2). This protein acts as a cofactor that enhances the activity of an enzyme, lecithin cholesterol acyltransferase. Enhanced activity of this enzyme augments a normal physiologic process, so called “reverse cholesterol transport” (RCT), whereby cholesterol is transported from extrahepatic cells to the liver for excretion in the form of bile salts or free cholesterol (3, 4). Increased RCT lowers total body cholesterol, and therefore, it is not surprising that numerous epidemiologic studies have shown an inverse relationship between plasma concentrations of HDL and the risk of coronary heart disease (5–7). Given the pivotal role of apolipoprotein AI, apoAI in the function of HDL, and the antiatherogenic properties of these particles, the identification of the mechanisms that increase levels of apoAI synthesis and HDL is of great interest and potential therapeutic importance. Hormonal control of apoAI expression is an attractive way to manipulate apoAI gene activity, because the simple addition or removal of the agent will regulate gene activity. Therefore, many laboratories, including our own, have examined the ability of thyroid hormone, glucocorticoids, estradiol, androgens, retinoic acid, and insulin to modulate activity of the gene (8 – 11). Whereas the action of all of the preceding hormones except for insulin (9) is triggered by ligand binding to intracellular receptors that act within the nucleus, insulin is different in that its activity is mediated by a membrane-bound tyrosine kinase receptor. This latter finding (9) suggests new avenues for controlling apoAI gene expression and prompted us to ask whether other intracellular signal transduction pathways initiated from the cell membrane might also affect apoAI expression. To investigate this possibility, we examined the potential role of activated protein kinase A (PKA) and kinase C (PKC). These kinases play critical roles in separate classical intracellular signaling pathways regulated by G-protein-coupled receptors. Unexpectedly, the stimulatory effects of both pathways are mediated by a single transcription factor that converges on the insulin-responsive core element, IRCE (9). EXPERIMENTAL PROCEDURES
Plasmid Constructs—Construction of the reporter, pAI.474-CAT, was described previously (12). The deletional constructs; pAI.425-, pAI.375-, pAI.325-, and pAI.235-CAT that contained rat apoAI DNA spanning ⫺425, ⫺375, ⫺325, and ⫺235 to ⫺7 were synthesized using the parent pAI.474-CAT as template in separate PCR as described previously (12). The wild-type IRCE (⫺411 to ⫺404), GAGGCGGG, was mutated to TCTTATTT by using a primer containing these transverse mutations in a PCR. The construct containing an internal deletional of 1 The abbreviations used are: HDL, high density lipoprotein; RCT, reverse cholesterol transport; PKA, protein kinase A; PKC, protein kinase C; IRCE, insulin-responsive core element; CAT, chloramphenicol acetyltransferase; PDBu, phorbol dibutyrate; RT-PCR, reverse transcription polymerase chain reaction; FSK, forskolin; EMSA, electrophoretic mobility shift assay; CTX, cholera toxin; PKI, PKA inhibitor.
31747
Downloaded from http://www.jbc.org/ by guest on January 6, 2018
Our previous finding that insulin induces apolipoprotein AI (apoAI) transcription points to the participation of intracellular signaling. This finding prompted us to ask whether two classical G-protein-coupled signaling pathways requiring activated protein kinase A (PKA) or kinase C (PKC) may also regulate apoAI. Therefore, human hepatoma, Hep G2 cells stably transfected with pAI.474-CAT, a reporter construct spanning ⴚ474 to ⴚ7 of apoAI DNA fused to chloramphenicol acetyltransferase (CAT) were treated with 10 M forskolin (FSK) or 50 nM phorbol dibutyrate (PDBu) to activate PKA and PKC, respectively. Results showed that the apoAI promoter activity increased 4 –5-fold following 24 h of treatment with either FSK or PDBu. Induction by either agent was blocked with actinomycin D but not the protein synthesis inhibitor, cycloheximide. The PKA inhibitor, PKI 14 –22 amide, abrogated induction by FSK, 100 M 8-bromo-cAMP, or 100 ng/ml cholera toxin, but it had no effect on activation via PKC. Similarly, PDBu induction was attenuated by 2 M of the PKC inhibitor, GF109203X, but it did not affect FSK activity. Next we used deletional constructs to show that the actions of FSK and PDBu required the insulin-responsive core element (IRCE). This motif matched the consensus binding site for the transcription factor, Sp1. The binding of Sp1 to the IRCE was confirmed by gel-retardation and supershift analysis. Site-directed mutagenesis of the IRCE eliminated Sp1 action and induction by FSK or PDBu. Whereas overexpression of Sp1 enhanced basal and FSK or PDBu induced promoter activity, transfection of an antisense oligomer against Sp1 mRNA attenuated both parameters. In summary, activation of PKA or PKC increases apoAI promoter activity. The activity of both signaling pathways is mediated by the IRCE, a motif that binds the transcription factor, Sp1.
31748
Regulation of ApoAI Promoter by PKC and PKA
nucleotides ⫺208 to ⫺193 in the apoAI promoter was created by digesting pAI.474-CAT with PstI (Amersham Pharmacia Biotech), which deletes a 46-base pair insert followed by ligation to circularize the large fragment. Expression plasmids for Sp1, TR␣, HNF-3, or HNF-4 were kind gifts from Drs. R. Tjian (University of California, Stanford, CA), M Phfal (Sidney Kimmel Cancer Center, La Jolla, CA), R. Costa (University of Illinois, Chicago, IL) and M. Sladek (University of California, Irvine, CA), respectively. Cell Culture—The human hepatoma cells, Hep G2, were maintained in Dulbecco’s modified Eagle’s medium (Life Technologies, Inc.) supplemented with 10% bovine calf serum (Life Technologies, Inc.) and penicillin/streptomycin at 37 °C. Cells were cultured overnight in serumfree medium prior to adding the agent(s) of interest. The Hep G2 cells have been used previously by ourselves and others for studying both signaling pathways and apoAI expression (9, 13–15). Transfection and Treatment of Cells—Hep G2 cells were transfected using LipofectAMINE (Life Technologies, Inc.). The amount of plasmids transfected is indicated in the figure legends. Transfection efficiency was monitored by cotransfecting 1 g of the plasmid, Rous sarcoma virus--galactosidase (16). Stably transfected Hep G2 cells were created by cotransfecting pAI.474-CAT (12) and the plasmid, pRc/CMV2 (Invitrogen), that carried neomycin resistance, at a ratio of 10:1, respectively. Colonies that grew in media containing 400 g/ml Geneticin, G418 were assayed for CAT activity (9) and used for further studies. Treatment with Sp1 Antisense and Sense Oligonucleotides—The Sp1 antisense (5⬘-CTGAATATTAGGCATCACTCCAGG-3⬘) and sense (5⬘-CCTGGAGTGATGCCTAATATTCAG-3⬘) phosphorothioated deoxynucleotides were commercially synthesized (IDT, Coraville, IA) (17, 18). Oligodeoxynucleotides (2 M) were transfected into stable Hep G2 cells using LipofectAMINE. Transfected cells were allowed to recover overnight in standard culture medium and then exposed to serum-free media containing either 10 M FSK or 50 nM PDBu or both for 24 h. CAT activity was measured in the cytosolic fraction, and Sp1 protein level was assayed in whole cell extract as described below. SDS-Polyacrylamide Gel Electrophoresis and Western Immunoblotting—Whole cell extract from control cells or those transfected with Sp1 oligodeoxynucleotides were harvested and lysed in buffer containing 2 mM orthovanadate, 1% Triton X-100, 0.1% SDS, 5 g/ml each leupeptin and apoprotin, 1 mg/ml each benzamidine and bacitracin, 600 mM dithiothreitol, 20 mM Tris (pH 7.4), 300 mM NaCl, 5 mM EDTA, 50 mM NaF, 40 mM sodium pyrophosphate, 50 mM KH2PO4, and 10 mM sodium molybdate. An aliquot of each sample was separated by electrophoresis in a 10% SDS-polyacrylamide gel, transferred to polyvinylidene difluoride membrane (Millipore, Waters Corp.), and then Sp1 protein was identified using a rabbit anti-human monoclonal antibody (PharMingen), and the signal was located using the ECL detection system (Amersham Pharmacia Biotech). Western blot analysis of apoAI protein in lysates from Hep G2 cells or culture media was assessed using a monoclonal antibody (Calbiochem). Nuclear Extracts and Electrophoretic Mobility Shift Assays (EMSA)—Nuclear extracts from Hep G2 cells were prepared as de-
scribed previously (9). Synthetic DNA duplexes spanning ⫺419 to ⫺388, ACTTTGAGGCGGGGATGTGAGT, or the recognition site for TFIID (Promega) were radiolabeled at the 5⬘-ends by incubating each strand separately with [ ␥ - 32 P]ATP and polynucleotide kinase (Amersham Pharmacia Biotech) prior to annealing. Each binding reaction of 20 l contained 10 mM Tris-HCl, 50 mM NaCl, 0.5 mM EDTA, 0.5 mM dithiothreitol, 5% glycerol, 1.0 g of poly(dI-dC), 1 fmol of radiolabeled probe, and 10 g of nuclear extract. In competition studies, 200fold M excess of unlabeled homologous (⫺419 to ⫺388 or Sp1 consensus, ATTCGATCGGGGCGGGGCGAG) or nonhomologous competitor DNA (mutant IRCE, ACTTTtcttatttGATGTGAGT, where bold letters indicate mutated nucleotides) was present in the reaction prior to the addition of nuclear extracts. Antibodies used in supershift experiments were added to nuclear extracts at 4 °C for 60 min prior to their use in EMSA. The antibodies against human Sp1, Sp2, and Sp3 were purchased from Santa Cruz Biotechnology (Santa Cruz, CA). All reactions were incubated at room temperature for 20 min and then separated on a 5% polyacrylamide nondenaturing gel (9). Electrophoresis was performed at 10 volts/cm2 for 3 h at 4 °C. The gel was then dried and exposed to Kodak XAR-5 film at ⫺80 °C in the presence of intensifying screens. RNA Preparation and RT-PCR—Total RNA from cells was extracted using TRI®-reagent (Molecular Research Center, Cincinnati, OH). The RNA was reverse-transcribed with a first strand cDNA synthesis kit using pd(N)6 primer (Amersham Pharmacia Biotech) according to manufacturer’s protocol. 3 l of this solution was amplify using PCR primed with a forward primer 5⬘CCTGATGAATGCTCATCCG3⬘ and reverse primer 5⬘AAGCATTCTGCCGACATGG3⬘ homologous to the CAT gene. The RT-PCR signal from CAT mRNA transcripts was normalized with the signal obtained from -actin using the primer pair (forward: 5⬘-CGTGGGCCGCCCTAGGCACCA-3⬘; reverse: 5⬘-TTGGCCTTAGGGTTCAGGGGG-3⬘) as described previously (19). RESULTS
Activation of Either PKA or PKC Stimulates ApoAI Promoter—The following studies were facilitated by the creation of Hep G2 cells that were stably cotransfected with pAI.474-CAT and a plasmid carrying neomycin resistance. We isolated 14 colonies that were resistant to neomycin, but only 6 of these had measurable CAT activity. All 6 colonies were tested for their response following exposure to either 10 M FSK or 50 nM PDBu to activate PKA and PKC pathways, respectively. CAT activity in all treated cells increased 4 –5-fold in comparison with untreated cells (Fig. 1, A and B, shows results of one colony). The -fold induction by either agent was similar regardless of whether the cells had high or low basal CAT activity. Furthermore, the abundance of apoAI protein in lysates of treated Hep G2 cells was higher compared with control (Fig.
Downloaded from http://www.jbc.org/ by guest on January 6, 2018
FIG. 1. Induction of apoAI promoter activity by activating PKA and PKC. A (upper panel) shows an autoradiograph of CAT activity in stable Hep G2 cells harboring the pAI.474-CAT construct treated with 10 M FSK and 50 nM PBDu for 24 h with or without the PKA or PKC inhibitors: PKI and GF, respectively. A (lower panel) shows Western blot analysis of apoAI protein in the lysates and corresponding spent media from stably transfected Hep G2 cells exposed to either FSK or PDBu as indicated below each lane. B contains a graph of the mean ⫾ S.E., n ⫽ 6 repeats of the same studies as in A. C shows a graph of the mean ⫾ S.E., n ⫽ 6 separate studies of cells exposed to other PKA activators; 100 M 8-bromo-cAMP (cAMP) or 100 ng/ml cholera toxin (CTX) with or without the PKA inhibitor, PKI (2 M). The ** denotes a significant (p ⬍ 0.01) decrease of induction in the presence of the inhibitor plus activator compared with activator alone following analysis using analysis of variance.
Regulation of ApoAI Promoter by PKC and PKA
31749
1A). ApoAI is a secreted protein. Thus, abundance of the protein in culture media from cells treated with FSK or PDBu (Fig. 1A, bottom panel) were higher versus control. These findings show that both FSK and PDBu increase not only activity of the promoter but also endogenous expression of the apoAI protein. The effect of inhibitors and other activators (Fig. 1, A–C) were tested to confirm further the role of both PKA and PKC pathways in regulating apoAI activity. 8-Bromo-cAMP and cholera toxin (CTX) are two additional activators of PKA. CAT activity (Fig. 1C) in stably transfected cells increased 4- and 3.5-fold following 24 h of exposure to 100 M 8-bromo-cAMP or 10 ng/ml CTX, respectively (20). Induction by FSK, 8-bromocAMP, or CTX was inhibited in the presence of 1 M amount of a PKA inhibitor, PKI (21, 22). Similarly, apoAI induction by PDBu was blocked in the presence of 2 M GFX (Fig. 1B), a specific inhibitor of PKC (23). The inhibitors acted specifically on their respective pathways, because PKI did not affect induction by PDBu, and the actions of FSK were not inhibited by GF (data not shown). Additionally, promoter activity in cells exposed to both 10 M FSK plus 50 nM PDBu was no greater than either one alone (Fig. 1, A and B). Together these findings show that activation of signaling pathways, mediated by PKA or PKC, increase apoAI promoter activity. Rapid Induction of ApoAI Promoter by FSK and PDBu Is
Downloaded from http://www.jbc.org/ by guest on January 6, 2018
FIG. 2. Time course induction of CAT activity by FSK and PDBu and effect of actinomycin D and cycloheximide. A shows autoradiographs of CAT activity in stable Hep G2 cells treated for varying periods of time with 10 M FSK (upper panel) or 50 nM PDBu (lower panel). B shows a graph of the mean ⫾ S.E., n ⫽ 5 separate studies at various time points. C shows an autoradiograph of CAT activity (upper panel) following induction by either 10 M FSK or 50 nM PDBu in the presence or absence of 1 M actinomycin D (ACTD) or 10 M cycloheximide (CHX), protein synthesis inhibitor. An ethidium bromide gel reflecting abundance of CAT- and -actin mRNA as measured by RT-PCR in the same cells appear in the middle and lower panels, respectively. D shows a graph of CAT- to -actin mRNA mean ⫾ S.E., n ⫽ 5 repeats of the same studies in C.
through Transcription Events—Next we examined the time course associated with the induction by FSK and PDBu (Fig. 2A). The results showed a significant increase in CAT activity within 3 h following exposure to either 10 M FSK or 50 nM PDBu. The initial increase was followed by a progressive rise in CAT activity that reached submaximal levels within 24 h (Fig. 2B). The rapid induction of apoAI promoter activity by FSK and PDBu prompted us to ask whether it required a transcriptional or post-transcriptional process. The results (Fig. 2, C and D) showed that induction by FSK and PDBu was abrogated by 1 M actinomycin D, an inhibitor of transcription. As expected, induction of CAT activity by either FSK or PDBu was completely abolished in the presence of 10 M cycloheximide, a protein synthesis inhibitor, because it blocked translation of CAT-mRNA. Therefore, to assess activity of pAI.474-CAT in the presence of cycloheximide, we used RT-PCR to measure the levels of CAT-mRNA. Whereas, actinomycin D blocked the induction of CAT-mRNA by either agent, cycloheximide had no effect on FSK or PDBu induction of CAT-mRNA (Fig. 2C, lower panel, and D). These observations show that FSK and PDBu increases transcriptional activity of the apoAI promoter. Actions of FSK or PDBu Require the IRCE—The preceding observation raises the question of how two separate intracel-
31750
Regulation of ApoAI Promoter by PKC and PKA
lular signaling pathways enhance the activity of a single promoter? To address this question, we used transient transfection to assay deletional constructs containing from ⫺474, ⫺425, ⫺375, ⫺325, and ⫺235 to ⫺7 of the promoter fused to CAT. The results (Fig. 3A) showed that induction by either FSK or PDBu decreased by 90% following removal of the ⫺425 to ⫺376 segment of the promoter. Furthermore, induction by either FSK or PDBu was completely abolished upon deletion to nucleotide ⫺235. In previous studies (9), we showed that the ⫺425 to ⫺375 segment of the promoter contained an insulin-responsive core element, IRCE, which mediated induction by insulin. Therefore, we postulated that the IRCE may also mediate the actions of FSK or PDBu. To test this hypothesis, we assayed activity of a construct that was identical to the pAI.474-CAT, except for transverse mutations of the IRCE. Results (Fig. 3B) showed the expected induction of the parent construct by FSK and PDBu, but these agents had no effect on activity of the mutated motif. The studies in this section show that the stimulatory actions of two separate signaling pathways are mediated by a common cis-acting element, IRCE. Sp1 Binds to the IRCE—To understand further the mechanism by which FSK and PDBu induces apoAI promoter activity, we want to identify the transcription factor(s) that interacts with the IRCE. Two clues that raised the possibility of the motif being a Sp1 binding site are: 1) it was GC-rich, and 2) it matched the consensus recognition site for the protein (24). Therefore, we used EMSA to measure IRCE binding activity in nuclear extract from Hep G2 cells following treatment with FSK or PDBu. Results (Fig. 4A) showed that binding to the
Downloaded from http://www.jbc.org/ by guest on January 6, 2018
FIG. 3. Induction by FSK and PDBu requires an intact IRCE. A contains autoradiographs of CAT activity in Hep G2 cells transiently transfected with 2 g of CAT-reporter containing ⫺474, ⫺425, ⫺375, ⫺325, or ⫺235 to ⫺7 of the apoAI promoter and treated with 10 M FSK (left panel) or 50 nM PDBu (right panel). B shows Hep G2 cells transiently transfected with 2 g of pAI.474-CAT (lanes 1– 4) or an identical construct containing a mutant of the IRCE (lanes 5– 8). The letters on top of each lane represent various treatments: C, control; F, 10 M FSK; or P, 50 nM, PDBu. Lane S shows cotransfection with Sp1 cDNA.
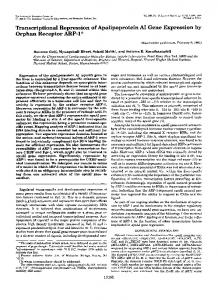
IRCE increased in cells treated with either agent but that bound to the TFIID motif was the same in control and treated cells (Fig. 4A, lanes 4 –9). The IRCE binding activity was specific, because formation of the protein-DNA complexes (Fig. 4B) was completely abolished by including either excess of nonradioactive IRCE or consensus Sp1 binding motif; but the mutant IRCE failed to affect formation of the complexes. There are at least three isoforms belonging to the Sp family of proteins. To determine the specific isoform bound to the IRCE, antibodies against Sp1, Sp2, and Sp3 were added to separate EMSA reactions. Whereas, Sp1 antibody supershifted the complexes, neither Sp2 nor Sp3 (data not shown) affected their mobility. The preceding studies show that the transcription factor, Sp1, binds to the IRCE. Sp1 Stimulates ApoAI Promoter and Augments Induction by FSK and PDBu—In addition to binding of Sp1 to the IRCE, it should also exert a functional effect. To examine the functional role of Sp1, we transfected an expression vector that overexpressed Sp1 into three (numbers 2, 8, and 10) separate colonies of stable Hep G2 cells. Enhanced Sp1 expression increased basal apoAI promoter activity in all three clones by 2-fold (Fig. 5, data for one clone) compared with cells transfected with empty vector. If Sp1 mediated the effects of FSK and PDBu, then enhanced expression of the factor should augment apoAI induction by these agents. To test this hypothesis, we treated stable Hep G2 cells that overexpressed Sp1 with submaximal doses of FSK (2 M) or PDBu (10 nM). Either agent alone caused a 2–2.5-fold increase of CAT activity in stable cells without exogenous Sp1. In contrast, CAT activity increased 6 –7-fold in cells that overexpressed Sp1. These findings show that Sp1 overexpression increases apoAI promoter activity and augments its induction by FSK and PDBu. Decreasing Sp1 Attenuates Induction by FSK or PDBu—If Sp1 plays an important role in mediating the actions of FSK and PDBu, then the converse of the above approach, i.e. decreasing levels of Sp1, should attenuate the actions of these agents. To test this hypothesis, we lowered intracellular levels of Sp1 using an antisense approach (17, 18). Results showed that in the presence of antisense Sp1, basal CAT activity in stably transfected cells decreased by 60% relative to control cells (Fig. 6, A and B). In contrast, the sense oligomer that targets the same sequence in Sp1 mRNA had no effect on CAT activity. Furthermore, induction of apoAI promoter activity by either FSK or PDBu was abrogated in cells containing Sp1 antisense, but not sense, oligonucleotides (Fig. 6, C and D). Next we used Western blot analysis to confirm that Sp1 antisense oligonucleotides did indeed reduce levels of the protein. Results (Fig. 6, E and F) showed a 65– 68% reduction in the level of Sp1 protein in cells containing Sp1 antisense but not sense oligonucleotides compared with nontransfected cells. Furthermore, neither FSK nor PDBu had a significant effect on the levels of Sp1 protein in these stably transfected cells. Together these findings show that Sp1 plays a key role in mediating FSK and PDBu induction of apoAI promoter activity. IRCE Acts Independently—The following studies examine whether the actions of the IRCE may be linked to adjacent cis-acting elements. To address this question we performed separate transfections with vectors that enabled the stable cells to overexpress the thyroid hormone receptor ␣ (TR␣), HNF-3, or HNF-4. These factors modulate the actions of sites A, B, and C, respectively, in the apoAI promoter (reviewed in Ref. 8). CAT activity in the transfected cells was compared with the untreated control. Results (Table I) showed that FSK and PDBu induction of CAT activity in the transfected with TR␣, HNF-3, or HNF-4 cells were not different from that in the control cells exposed to these agents (compare induced values
Regulation of ApoAI Promoter by PKC and PKA
31751
FIG. 5. Expression of Sp1 enhances basal, FSK, and PDBu induction of apoAI activity. A shows an autoradiograph of CAT activity in stable Hep G2 cells transiently transfected with a vector that overexpresses Sp1 (lanes 4 and 7) compared with control or an empty vector (lanes 1 and 2). The overexpression of Sp1 alone increased CAT activity and enhances induction of CAT activity by either PDBu (5 nM, lanes 3 and 5) or FSK (2 M, lanes 6 and 8). B shows a graph of relative CAT activity in cells treated with the indicated conditions at the bottom of each bar (mean ⫾ S.E., n ⫽ 4). The ** denotes a significant (p ⬍ 0.01) increase of PDBu ⫹ Sp1 versus either Sp1 or PDBu and FSK ⫹ Sp1 versus either Sp1 or FSK.
in the “None” column with those in adjacent three columns). This observation suggests that IRCE-mediated induction by FSK and PDBu was not affected by adjacent elements A, B, and C. Next we wondered whether the consensus Sp1 motif (⫺220 to ⫺211) located 3⬘ to the IRCE contributed to activity of the promoter. To investigate this possibility, we created a construct that contained an internal deletion from ⫺208 to ⫺193. CAT activity in cells transiently transfected with the deletional mutant was activated 5.6 ⫾ 0.8- and 6.5 ⫾ 0.9-fold by FSK or PDBu, respectively, compared with control. This response is
similar to that of the wild type promoter (“None” column in Table I). Together these findings show that IRCE activity was not influenced by adjacent cis-acting elements A, B, and C. In addition, removal of the Sp1 site 3⬘ to the IRCE played an insignificant role in the FSK and PDBu induction of apoAI promoter activity. DISCUSSION
The pivotal role of apoAI in HDL particles, and their function in mediating RCT (3, 4), underlies our interest to investigate the expression of this gene. Increased abundance of apoAI
Downloaded from http://www.jbc.org/ by guest on January 6, 2018
FIG. 4. Sp1 binds to IRCE in response to the treatment with either FSK or PDBu. A shows an autoradiograph of EMSA of binding activity to radiolabeled IRCE in Hep G2 cells treated without (lane 1) and with 10 M FSK (lane 2) or 50 nM PDBu (lane 3). TFIID binding activity in the same cells is shown in lanes 5–7, respectively. This binding is specific, because homologous competitor inhibits (lane 8), but nonspecific DNA does not displace binding to radiolabeled TFIID oligomer. B shows an autoradiograph of competition analysis of binding activity to radiolabeled IRCE (lane 2) in the presence 200-fold M excess of unlabeled IRCE (lane 3), 250-fold M excess of consensus Sp1 recognition motif (lane 4), and 200-fold M excess of mutant IRCE (lane 5). C shows an autoradiograph of EMSA analysis of binding reactions in the presence of antibody against Sp1 (lane 4) and immunoglobin IgG (lane 5). The arrow pointing to the right shows position of Sp1 as identified by supershift (SS) of the complex.
31752
Regulation of ApoAI Promoter by PKC and PKA
TABLE I Effect of adjacent cis-acting sites on FSK and PDBu induction of the apoAI promoter Table I, shows FSK or PDBu induction of CAT activity in stably transfected Hep G2 cells containing the reporter pAI.474-CAT following the introduction of no additional plasmid (none) or ones that over express TR␣, HNF-3, or HNF-4, which are known to modulate the function of sites A, B, and C, respectively. Each value in the table shows the mean and S.D. for at least three repetitions of each transfection and treatment group. A schematic diagram showing the relative location of the sites appears in the map below the table. Treatment
FSK (10 M) PDBu (50 nM)
Transfection
None
TR␣
HNF-3
HNF-4
⫺ ⫹ ⫺ ⫹
1 4.6 ⫾ 0.5 1 5.1 ⫾ 0.6
0.6 ⫾ 0.2 4.8 ⫾ 0.8 0.6 ⫾ 0.2 5.4 ⫾ 0.9
2.3 ⫾ 0.6 4.8 ⫾ 0.7 2.3 ⫾ 0.6 5.2 ⫾ 0.8
1.8 ⫾ 0.3 4.3 ⫾ 0.8 1.8 ⫾ 0.3 5.0 ⫾ 0.7
enhances RCT, thereby lowering the levels of cholesterol in the body. Decreased levels of cholesterol reduce the risk of cardiovascular disease. Therefore, a better understanding of the mechanism(s) underlying the induction of the apoAI gene will help us find new ways to decrease heart disease. Our previous studies (9) show that insulin stimulates apoAI gene transcription. Insulin regulation of the apoAI promoter differs from previous reports that examine hormonal regulation of this gene. Whereas most reports document the regulation of apoAI by a family of small lipophilic ligands including thyroid/steroid hormones, which bind to a nuclear receptor with transcriptional activity (reviewed in (8)), we recently
showed that insulin, a peptide hormone, also activates the gene. This finding prompted us to ask whether other intracellular signaling pathways may also regulate apoAI expression. Therefore, we examined the potential involvement of two classical signaling pathways mediated by PKA and PKC. To perform these studies, we created Hep G2 cell stably transfected with the apoAI reporter, pAI.474.CAT. CAT activity in these cells increased up to 4 –5-fold following treatment with FSK or PDBu to activate PKA and PKC, respectively. In the same cells, endogenous expression of apoAI protein was noted in both lysates and media (Fig. 1). That activation of PKA stimulates apoAI promoter activity is supported by four independent lines of evidence (Fig. 1): 1) FSK, a direct activator of adenylyl cyclase, raises cAMP levels thereby activating PKA and enhances activity of the apoAI promoter; 2) CTX, an irreversible activator of G␣s, also increases cAMP and stimulates activity of the promoter and parallels the actions of FSK; 3) 8-bromo-cAMP, a direct activator of PKA via its binding to the enzyme’s regulatory subunit, like cAMP, increases apoAI activity and mimics the actions of FSK or CTX; and 4) the PKA inhibitor, PKI (21, 22), reverses the effects of all three activators. PDBu specifically activates PKC by binding directly to this enzyme. The ability of PDBu to stimulate promoter activity was blocked by the PKC inhibitor, GF109203X, that unlike staurosporin (often used for PKC inhibition) does not affect tyrosine kinase activity. Moreover, it is important that the PKC inhibitor, GF109203X (23), did not diminish the stimulatory
Downloaded from http://www.jbc.org/ by guest on January 6, 2018
FIG. 6. Decreasing Sp1 reduces the actions of FSK and PDBu. A shows an autoradiograph of CAT activity in stable cells treated without (lane 1) and with an antisense (lane 2) or sense (lane 3) Sp1 phosphoribonucleotide. B is a graph of relative CAT activity in cells treated with conditions noted at the bottom of each bar (mean ⫾ S.E., n ⫽ 4; ** denotes a significant difference: p ⬍ 0.01, between the group of control cells and the group treated with antisense). C shows an autoradiograph of CAT activity in the cells exposed to 50 nM PDBu (lanes 2– 4) or 10 M FSK (lanes 5–7). Cells were pretreated with either an antisense (lanes 3 and 6) or sense (lanes 4 and 7) Sp1 phosphoribonucleotide as indicated at the top of each lane. D shows a graph of relative CAT activity in cells treated with conditions noted at the bottom of each bar (mean ⫾ S.E., n ⫽ 4; ** indicates p ⬍ 0.01). E shows a Western blot probed with a Sp1 antibody. The lanes contain cell lysate from Hep G2 cells treated as per conditions noted at the top. F is a graph of Sp1 protein in cells treated with conditions noted at the bottom of each bar (mean ⫾ S.E., n ⫽ 4; ** indicates p ⬍ 0.01).
Regulation of ApoAI Promoter by PKC and PKA
also mediated the actions of PKC on specific genes. The stimulation of Sp1-mediated vascular permeability factor/vascular endothelial growth factor transcription required an interaction between Sp1 and PKC- (30). More recently, Sp1 was shown to be essential in the 12-O-tetradecanoylphorbol-13-acetate stimulation of human lysosomal acid lipase gene activity in monocytes (31). The preceding reports clearly set a precedent for the participation of Sp1 in the actions of either PKA or PKC. Moreover, these findings help us identify the novel aspects of our results. First, in the case of the apoAI gene, Sp1 is required for the actions of both PKA and PKC pathways. We are unaware of any other models where induction of gene activity by these separate signaling pathways is mediated by the transcription factor, Sp1. Second, the ability of Sp1 to mediate actions of both PKA and PKC may be limited to liver cells, because other reported studies were done in extra-hepatic models. Together these novel aspects of our results suggest an increasing role for Sp1 in signal transduction. Sp1 is not the only transcription factor that can be regulated by both PKA and PKC signaling pathways. Previous studies showed that the transcription factor, AP-2, can also be activated by PKA and PKC following exposure to FSK or phorbol ester, respectively (32, 33). These findings have largely challenged the classical signaling model in regard to specificity and interaction of intracellular signaling pathways. The ability of Sp1 to mediate the actions of PKA and PKC raises the possibility that this protein may have consensus amino acid motifs recognized by both kinases. Therefore, we scanned the amino acid sequence of Sp1 using the PhosphoBase program (34) for putative phosphorylation motifs. This search revealed several potential phosphorylation sites for a variety of protein kinases including cAMP- or cGMP-dependent kinase, PKC, mitogen-activated protein kinase (Erk), casein kinase II, and many others. In support of this idea, recent studies suggest that Sp1 is phosphorylated by Erk2 (35), PKC- (30), casein kinase (36), or PKA (29). The phosphorylation modification of Sp1 protein may lead to either an increase (e.g. Erk2) or decrease (e.g. casein kinase II) in its DNA binding activity. Given the presence of PKA and PKC target sites in Sp1, we speculate that the stimulatory effects of these kinases on apoAI promoter may require phosphorylation of Sp1. This topic will be the focus of future studies. There is increasing evidence to show that GC-rich sequences can bind to more than one member of the Sp family (26, 27). The binding sequence for Sp1 is highly homologous to the one for Sp3. In the case of the IRCE, our studies show that it binds to only Sp1. Within the context of the rat apoAI promoter, the IRCE is not the only motif that interacts with Sp1. Previous studies (36) in the human apoAI promoter show a Sp1 binding site is located proximal to the IRCE. The corresponding motif in the rat promoter spans ⫺220 and ⫺211 of the gene. However, this latter site does not appear to mediate the actions of either PKA or PKC because deletion or mutation of the IRCE abolished the enhancing actions of Sp1 and a deletional mutant lacking the proximal Sp1 site retained its response to FSK and PDBu. The question of why this 3⬘ Sp1 site does not function in the same manner as the IRCE is beyond the scope of this report. It is of interest that hormones such as adrenalin and glucagon, which activate hepatocyte adenylyl cyclase, and therefore potentially augment apoAI gene transcription, are traditionally thought of as agents that are “counter-regulatory” for insulin action. The implications of our findings are that in the case of apoAI, the effects of insulin would be in parallel or additive with the effects of glucagon and adrenalin. Similarly, by activating G␣q, hormones such as noradrenalin (␣1-adreno-
Downloaded from http://www.jbc.org/ by guest on January 6, 2018
effect of activated PKA, nor does the PKA inhibitor, PKI, affect stimulation of promoter activity by PKC activation. Additionally, the combined action of both FSK and PDBu was no greater than either one alone. These observations clearly show that apoAI promoter activity and endogenous expression of the protein are stimulated by activated PKA or PKC. Furthermore, the specificity of the inhibitors for their respective kinases suggests that these signaling pathways operate in parallel to up-regulate apoAI gene expression. Although the preceding results show that PKA and PKC increase apoAI gene activity, the mechanism(s) underlying this induction remains unknown. A variety of mechanism(s) may explain the stimulatory actions of PKA and PKC. To address this question, we used actinomycin D or cycloheximide to block gene transcription and translation, respectively, in the stable Hep G2 cells. The outcome of these studies show that activated PKA or PKC enhances apoAI gene transcription. Therefore, the apoAI promoter should contain cis-acting element(s) that mediate the action of PKA or PKC. To identify the motif(s) that mediated the stimulatory actions of PKA or PKC, we measured CAT activity in deletional mutants of the promoter following exposure to FSK and PDBu, respectively. Results showed that a critical element was situated between nucleotides ⫺425 and ⫺376 of the gene. Our previous studies showed that the same fragment contained the IRCE, a motif that mediated the stimulatory actions of insulin (9). Therefore, we postulated that the actions of either or both FSK and PDBu were mediated by the IRCE. This hypothesis was tested using a reporter containing a mutated IRCE. Unexpectedly, neither FSK nor PDBu stimulated activity of the mutant construct. This finding suggests that the actions of both agents were mediated by a single cis-acting element, the IRCE. The pivotal role of the IRCE in mediating PKA and PKC activation of the apoAI expression prompted us to identify the transcription factor(s) that binds to this motif. There were two clues that helped us find a potential candidate that interacted with the IRCE. The first one being that the IRCE was GC-rich, and second, when the motif was scanned using TFSEARCH program (25), it was identical to the recognition sequence bound by the transcription factor, Sp1 (26, 27). To demonstrate the binding of Sp1 to the IRCE, we performed EMSA analysis using nuclear extract from Hep G2 cells. Results show that IRCE binding activity increases in cells treated with FSK or PDBu. This binding is specific, because formation of proteinIRCE complex is inhibited in the presence of excess unlabeled IRCE or authentic Sp1 recognition site but not IRCE oligomer containing the mutated motif. That the IRCE binding activity is indeed Sp1 comes from supershift studies. Whereas, Sp1 antibody supershifted the protein-IRCE complex, neither Sp2 nor Sp3 antibody affected mobility of the band. The role of Sp1 was examined by altering levels of the protein in Hep G2 cells. Overexpression of Sp1 in stable Hep G2 cells augmented the induction of apoAI promoter activity in the presence of FSK or PDBu. Transfection of a Sp1 antisense oligonucleotide into Hep G2 cells to reduce Sp1 protein caused a decrease in the basal activity of the promoter and blocked its induction by either FSK or PDBu. These studies show that Sp1 binds to the IRCE, and this transcription factor mediates apoAI promoter activation by two separate signaling pathways requiring either PKA or PKC. Over the last few years, several publications have described the participation of Sp1 in the PKA or PKC regulation of specific genes. For example, in doxorubicin-resistant HL-60 leukemia cells, activated PKA phosphorylated Sp1 and enhanced its ability to bind DNA (28). In addition, resistance of breast carcinoma cells to multiple drugs caused by PKA induction of the MDR1 gene also required Sp1 (29). Similarly, Sp1
31753
31754
Regulation of ApoAI Promoter by PKC and PKA
receptor) and angiotensin-II (AT1 receptor) would activate PKC and add yet a further boost to apoAI expression. It is still an open question how the signaling pathways initiated from Gprotein-coupled receptors and tyrosine kinase receptors and other hormones by binding intracellular receptors modulate apoAI gene expression in hepatocytes under in vivo physiological conditions. In summary, our studies show that activation of PKA and PKC in the human hepatoma cells, Hep G2 increases apoAI promoter activity and the actions of these signaling pathways require the transcription factor, Sp1. Sp1 induces apoAI promoter activity through its binding to the IRCE in the apoAI promoter. These findings are not only novel for apoAI regulation, but also for the transcription factor Sp1 in regards to its pivotal role in mediating the actions of both the PKA and PKC. REFERENCES
Downloaded from http://www.jbc.org/ by guest on January 6, 2018
1. Andersson, L. O. (1997) Curr. Opin. Lipidol. 8, 225–228 2. Brouillette, C. G., and Anantharamaiah, G. M. (1995) Biochim. Biophys. Acta 1256, 103–129 3. Miller, N. E., La Ville, A., and Crook, D. (1985) Nature 314, 109 –111 4. Barter, P. J., and Rye, K. A. (1996) Curr. Opin. Lipidol. 7, 82– 87 5. Barter, P. J., and Rye, K. A. (1996) Atherosclerosis 121, 1–12 6. De Backer, G., De Bacquer, D., and Kornitzer, M. (1998) Atherosclerosis 137, (suppl.) S1–S6 7. Luoma, P. V. (1997) Pharmacol. Toxicol. 81, 57– 64 8. Hargrove, G. M., Junco, A., and Wong, N. C. (1999) J. Mol. Endocrinol. 22, 103–111 9. Murao, K., Wada, Y., Nakamura, T., Taylor, A. H., Mooradian, A. D., and Wong, N. C. (1998) J. Biol. Chem. 273, 18959 –18965 10. Ness, G. C., Lopez, D., Chambers, C. M., Newsome, W. P., Cornelius, P., Long, C. A., and Harwood, H. J., Jr. (1998) Biochem. Pharmacol. 56, 121–129 11. Soyal, S. M., Seelos, C., Lin-Lee, Y. C., Sanders, S., Gotto, A. M., Jr., Hachey, D. L., and Patsch, W. (1995) J. Biol. Chem. 270, 3996 – 4004 12. Romney, J. S., Chan, J., Carr, F. E., Mooradian, A. D., and Wong, N. C. (1992) Mol. Endocrinol. 6, 943–950 13. Sakai, T., Jin, F., Kamanna, V. S., and Kashyap, M. L. (2000) Atherosclerosis
149, 43– 49 14. Wu, J. Y., Wu, Y., Reaves, S. K., Wang, Y. R., Lei, P. P., and Lei, K. Y. (1999) Am. J. Physiol 277, C537–C544 15. Herbomel, P., Bourachot, B., and Yaniv, M. (1984) Cell 39, 653– 662 16. Hata, Y., Duh, E., Zhang, K., Robinson, G. S., and Aiello, L. P. (1998) J. Biol. Chem. 273, 19294 –19303 17. Yoshida, S., Ono, M., Shono, T., Izumi, H., Ishibashi, T., Suzuki, H., and Kuwano, M. (1997) Mol. Cell. Biol. 17, 4015– 4023 18. Zheng, X. L., Gui, Y., Sharkey, K. A., and Hollenberg, M. D. (1999) J. Pharmacol. Exp. Ther. 289, 632– 640 19. Kahn, R. A., and Gilman, A. G. (1984) J. Biol. Chem. 259, 6228 – 6234 20. Eichholtz, T., de Bont, D. B., de Widt, J., Liskamp, R. M., and Ploegh, H. L. (1993) J. Biol. Chem. 268, 1982–1986 21. Glass, D. B., Cheng, H. C., Mende-Mueller, L., Reed, J., and Walsh, D. A. (1989) J. Biol. Chem. 264, 8802– 8810 22. Toullec, D., Pianetti, P., Coste, H., Bellevergue, P., Grand-Perret, T., Ajakane, M., Baudet, V., Boissin, P., Boursier, E., Loriolle, F., Duhamel, L., Charon, D., and Kirilovsky, J. (1991) J. Biol. Chem. 266, 15771–15781 23. Courey, A. J., and Tjian, R. (1988) Cell 55, 887– 898 24. Heinemeyer, T., Chen, X., Karas, H., Kel, A. E., Kel, O. V., Liebich, I., Meinhardt, T., Reuter, I., Schacherer, F., and Wingender, E. (1999) Nucleic Acids Res. 27, 318 –322 25. Cook, T., Gebelein, B., and Urrutia, R. (1999) Ann. N. Y. Acad. Sci. 880, 94 –102 26. Philipsen, S., and Suske, G. (1999) Nucleic Acids Res. 27, 2991–3000 27. Ungefroren, H., Gellersen, B., Krull, N. B., and Kalthoff, H. (1998) J. Biol. Chem. 273, 29230 –29240 28. Rohlff, C., and Glazer, R. I. (1998) Int. J. Oncol. 12, 383–386 29. Pal, S., Claffey, K. P., Cohen, H. T., and Mukhopadhyay, D. (1998) J. Biol. Chem. 273, 26277–26280 30. Ries, S., Buchler, C., Langmann, T., Fehringer, P., Aslanidis, C., and Schmitz, G. (1998) J. Lipid Res. 39, 2125–2134 31. Imagawa, M., Chiu, R., and Karin, M. (1987) Cell 51, 251–260 32. Luscher, B., Mitchell, P. J., Williams, T., and Tjian, R. (1989) Genes Dev. 3, 1507–1517 33. Kreegipuu, A., Blom, N., and Brunak, S. (1999) Nucleic Acids Res. 27, 237–239 34. Merchant, J. L., Du, M., and Todisco, A. (1999) Biochem. Biophys. Res. Commun. 254, 454 – 461 35. Armstrong, S. A., Barry, D. A., Leggett, R. W., and Mueller, C. R. (1997) J. Biol. Chem. 272, 13489 –13495 36. Kilbourne, E. J., Widom, R., Harnisch, D. C., Malik, S., and Karathanasis, S. K. (1995) J. Biol. Chem. 270, 7004 –7010
Activation of Apolipoprotein AI Gene Expression by Protein Kinase A and Kinase C through Transcription Factor, Sp1 Xi-Long Zheng, Shuji Matsubara, Catherine Diao, Morley D. Hollenberg and Norman C. W. Wong J. Biol. Chem. 2000, 275:31747-31754. doi: 10.1074/jbc.M000621200 originally published online May 26, 2000
Access the most updated version of this article at doi: 10.1074/jbc.M000621200 Alerts: • When this article is cited • When a correction for this article is posted
This article cites 36 references, 16 of which can be accessed free at http://www.jbc.org/content/275/41/31747.full.html#ref-list-1
Downloaded from http://www.jbc.org/ by guest on January 6, 2018
Click here to choose from all of JBC's e-mail alerts