Efficient information dissemination over Mobile Ad hoc. Networks (MANET) for urban Disaster/Recovery (D/R) missions is emerging as a very challenging and ...
ADAPTIVE MOBILITY-ASSISTED DATA DISSEMINATION IN MOBILE DISASTER/RECOVERY ENVIRONMENTS Long Vu and Klara Nahrstedt Department of Computer Science, University of Illinois at Urbana-Champaign, IL 61801 Email:{longvu2,klara}@cs.uiuc.edu
sages efficiently to obtain delay and coverage objectives under limitations of network bandwidth and node memory space remains a challenging research problem. Designing an efficient, reliable, and robust data dissemination protocol in MANET is challenging because of following reasons. First, the protocol must be efficient in terms of network bandwidth consumption and node memory space usage. Second, data dissemination protocol must be reliable so that D/R messages can reach almost entire network under packet loss, network partition, and transmission failure. Third, the protocol must be able to obtain delay and coverage objectives. In other words, delivered messages must cover almost entire network by their deadlines. Last but not least, the protocol should be robust because MANET network is frequently or permanent partitioned and thus data dissemination protocol may fail or incur high overhead. Previous work on data dissemination protocol in wireless network falls into two categories: (1) floodingbased protocol [3, 6], and (2) mobility-assisted protocol [1, 2, 9, 10]. In the first approach, different flooding protocols have been proposed such as Selective/gossip [7], Hyper [8], and Self-pruning [4]. These methods work with dense network, require large memory space on mobile nodes and especially their performances significantly degrade with sparse or partitioned networks. Another flooding-based protocol is opportunistic dissemination which prioritizes and broadcasts spatio-temporal messages based on their relevant scores [11]. Nevertheless, this work does not focus on delay constraint which is crucial in D/R scenario. In the second approach, mobilityassisted data dissemination protocols are designed for sparse or partitioned networks. A 2-hop relay scheme and its variations are proposed in which the sender selects its nearest neighbors as relay nodes. These relay nodes forward the message to the receiver if they are in the transmission range of each other [1, 5]. Despite its low overhead, this scheme assumes a uniformly distributed network and an unlimited memory space on mobile nodes. Another work on epidemic data dissemination which provides coverage/delay guarantees for one message [2]. However, this work does not address limitations of network bandwidth and node memory space. In summary, existing data dissemination schemes focus on
ABSTRACT Efficient information dissemination over Mobile Ad hoc Networks (MANET) for urban Disaster/Recovery (D/R) missions is emerging as a very challenging and important research problem. In this paper, we present an adaptive mobility-assisted data dissemination framework as a solution for Disaster/Recovery mission. Our novel framework is based on “Importance Score” of D/R messages to: (1) optimize the number of disseminations due to the bandwidth limitation in MANET, and (2) discard invalid D/R messages due to memory space limitation on mobile devices. The corresponding “Importance Score” function ranks D/R messages according to metrics that obtain maximal area coverage and minimal delay in D/R dissemination. Once the D/R messages are ranked, our adaptive mobility-assisted data dissemination protocol broadcasts top k, tuning broadcast period according to network condition. To ensure performance efficiency, we estimate times-to-send (T T S) to limit unnecessary transmissions. Our experimental results show that the presented framework with corresponding algorithms and protocols efficiently utilize network bandwidth and node memory space, while achieving information coverage and delay objectives.
1.
INTRODUCTION
The terrorist attack on the World Trade Center on September 11, 2001 has drawn ever-increasing attention to improving rescue efforts following a disaster. Among proposed technologies, MANET becomes emerging and promising technology for rescue forces due to the lack of communication infrastructure after an urban disaster. When the urban infrastructure collapses after a disaster (e.g. earthquakes, terror attacks, etc.), rescue teams (police, medical team, firemen, etc.) come and form an ad hoc wireless network. In this network, people broadcast various kinds of information such as emergency notifications, alerts, etc. On one hand, a message has its own delay and coverage constraints. On the other hand, network communication fully depends on available network bandwidth and the number of messages a mobile node can carry. As a consequence, disseminating D/R mes1
Field id dl pri cnt dup arT ime
either coverage/delay guarantee or network bandwidth and node memory space, but not at the same time. In this paper, we present a novel efficient data dissemination framework over MANET for urban Disaster/Recovery mission. In particular, we present an adaptive mobility-assisted data dissemination framework which is based on “Importance Score” of D/R messages to: (1) optimize the number of disseminations due to the bandwidth limitation in MANET, and (2) discard invalid D/R messages due to memory space limitation on mobile devices. The corresponding “Importance Score” function ranks D/R messages according to metrics that obtain maximal area coverage and minimal delay in D/R dissemination. Once the D/R messages are ranked, our adaptive mobility-assisted data dissemination protocol broadcasts top k D/R messages, tuning broadcast period according to node density and node speed. We also estimate times-to-send T T S of a message to limit unnecessary transmissions. Our experimental results show that the presented framework with corresponding algorithms and protocols achieves coverage and delay objectives under limitations of network bandwidth and node memory space. The rest of this paper is organized as follows. Section 2 introduces our design objectives, models and overview of our presented framework. Next, details of the framework are presented in sections 3, 4, and 5. Section 6 evaluates our framework based on simulation results. Finally, we conclude the paper in section 7.
2.
Description identifier relative deadline priority content # of duplications arrival time
Value Unique Number Valid period Low/high priority Text of m Integer Value Time
Table 1: Format of message m. heterogenous and their movements are relatively random. On one hand, the random movement results in frequently or permanent partitioned network. On the other hand, the random movement itself helps node disseminate messages more quickly to the entire network because nodes can buffer, carry and forward messages.
2.3. Data Model In this paper, data is represented by the notion of a message. A message is an information unit disseminated from node to node. Messages can be emergency notifications, survival alerts, environmental hazard notifications, etc. Table 1 shows the format of message m which is either stored at mobile nodes or disseminated in the network. Notice that all 6 attributes of m are kept at mobile nodes, but only 4 first attributes are encapsulated and broadcasted. In particular, id uniquely identifies messages, dl -the relative deadline- specifies valid period of m to the system. pri -priority- differentiates types of messages. For example, m has a high priority if it is an emergency message and m has a low priority if it is a normal message. dup is the number of duplicated message m and arT ime is the time at which m arrives at node n. Messages m is considered invalid after its deadline expires. n updates m’s relative deadline (valid period) when it broadcasts m as follows:
DESIGN OBJECTIVES, MODELS AND SYSTEM ARCHITECTURE
2.1. Design Objectives Our first design objective of mobility-assisted data dissemination protocol is Delivery Delay. Essentially, D/R messages should be disseminated to almost entire network before its deadline. The second design objective is Network Coverage. To avoid subsequent damages, D/R messages should be disseminated to almost all nodes under dynamic and partitioned network. The third design objective is Performance Efficiency. In other words, the protocol should be able to organize and disseminate a large number of D/R messages efficiently under limitations of network bandwidth and node memory space.
m.dl = m.dl − (cT ime() − m.arT ime)
(1)
In which, cT ime() returns current time at node n and cT ime() − m.arT ime is the time period m stays at n. Due to clock drift among nodes in the network, there exits some ² error (perhaps in millisecond) results from cT ime() function. However, because the unit of relative deadline is minute, clock drift can be negligible. In our context, message m1 ’s is considered more important than m2 to the network (hence m1 has a higher Importace Score than m2 ), if broadcasting m1 prior to m2 improves our design objectives. Specifically, Importace Score of a message is a linear combination of its priority and deadline. We further present Importace Score in section 4. In this paper, Times-to-Send (i.e. TTS) of a message m is the maximal number of broadcasts nodes in the network can perform on m. T T S is analogous to T T L in T CP/IP and is a crucial parameter because overestimating T T S results in redundant messages and waste of
2.2. Network Model After a disaster, rescue teams come and form an ad hoc wireless network from their limited wireless coverage mobile devices which are main agents to store, carry, and broadcast D/R messages. In this paper, we assume that mobile wireless nodes follow Random Way Point mobility model. Although there is no perfect mobility model for all scenarios in wireless networks, we believe that Random Way Point is an acceptable assumption because in Disaster/Recovery scenario, distribution of nodes are 2
Disaster/Recovery Message Manager
Operators (Add, Update, Delete, Rank)
Message Collections
N eighbor M anager, and Sender. The Receiver essentially receives messages from lower layer, updates their arT ime, and forwards these messages to M essage M anager. N eighbor M anager updates and refreshes the neighbor list which is used by Estimator to estimate broadcast period T (Section 5). Sender periodically updates top k message deadlines (Formula 1) and broadcasts them.
Importance Score Calculator
Adaptive Estimator Broadcast Period Estimator
Time-to-Send Estimator
Mobility-assisted Data Disseminator Receiver Receives Disaster/Recovery messages
Neighbor Manager
4.
Sender
Periodically broadcasts top k Disaster/Recovery messages
The M essage M anager component updates, delete, and ranks messages so that the top k is sent by the Sender periodically. In particular, M essage M anager consists of three sub-components: M essage Collections, Importance Score Estimator, and Operators.
Figure 1: System Architecture network bandwidth. In contrast, underestimating T T S degrades delivery coverage of m. In section 5, we present an algorithm to estimate T T S.
4.1. Message Collections There are three collections: Remote, Local, and Deleted. Remote collection stores messages received from remote nodes, notice that Remote collection has a limited size due to node memory space limitation. Local collection is used to keep messages created by n itself (i.e. local messages) and it holds all local messages until their deadlines expire. Existence of Local collection is to preserve fairness between remote and local messages. If there only one message collection, all messages will be stored and ranked in this single collection. However, several local messages may be newly-created with lower Importance Score and can be deleted if there is not sufficient space. Therefore, these local messages are not disseminated, causing unfairness and violating network coverage objective. Deleted collection is used to avoid message re-propagation. In particular, once n deletes m, later m should not be disseminated by n. To utilize memory space, Deleted collection only keeps id of deleted messages. Notice that when a new message m arrives, it can be added into Remote collection or deleted depending on available memory and its Importance Score. Incase memory is full, m can only be added into Remote collection if its Importance Score is higher than that of the least important message of this collection. Messages in Remote and Local collections are ranked based on their Importance Score and top k are broadcasted by the Sender.
2.4. System Architecture Overview To obtain above design objectives, our adaptive mobility-assisted data dissemination framework is based on “Importance Score” of D/R messages to optimize the number of disseminations due to limitations of network bandwidth and node memory space. Figure 1 shows the system architecture of the adaptive mobility-assisted data dissemination framework with three main components Mobility-assisted Data Disseminator, Adaptive Estimator, and Disaster/Recovery Message Manager. To shorten the notation, we henceforth use Disseminator, M essage M anager, and Estimator for corresponding components. To begin with, Disseminator receives messages (by Receiver) and forwards them to M essage M anager. Disseminator also updates neighbor list and periodically broadcasts top k messages. Upon receiving messages from Disseminator, M essage M anager uses its Operators to update, organize, and delete messages in its M essage Collections. M essage M anager also uses Importance Score Calculator to calculate the Importance Score of messages which then are ranked based on these scores and top k are sent from the ranked list. Estimator adaptively estimates broadcast period T and T T S according to network parameters. These estimations determine when Disseminator broadcasts messages and how many times a message is broadcasted so that we can utilize network bandwidth and node memory space. Next, we discuss in detail these three main components.
3.
DISASTER/RECOVERY MESSAGE MANAGER
4.2. Importance Score Calculator Given a message m, its Importance Score - Im(m) is computed as follows: Im(m) = P ri(m) − T ime2Dline(m) − Dup(m)
MOBILITY-ASSISTED DATA DISSEMINATOR
(2)
In which, P ri(m), T ime2Dline(m), and Dup(m) are functions as shown in Table 2. In particular, M AXP RI - maximal priority, M AXDL - maximal deadline,
Disseminator is the interface of our architecture with lower layer. It has three sub-components: Receiver, 3
Function P ri T ime2Dline Dup
Description pri/M AXP RI (dl − cT ime() + arT ime − pT ime())/M AXDL dup/M AXDU P
Table 2: 3 functions used in Importance Score calculation for a message m. They all return real values in [0,1]. M AXDU P - maximal duplicated messages, are constants representing the maximal values of corresponding attributes. For example, M AXP RI = 2 (low and high priority), M AXDL = 60 minutes, and M AXDU P = 50. m.pri is priority of m, so that m.pri/M AXP RI is in range [0,1]. Likewise, (m.d − cT ime() + arT ime − pT ime())/M AXDL (Formula 1) and m.dup/M AXDU P are also in range [0,1]. These normalized values equalize roles of factors in Im(p). Function cT ime() returns current time at node n and pT ime() returns approximate propagation delay to avoid late disseminated messages (i.e. messages are disseminated to nodes after they expire). By using formula 2, we intuitively prefer messages with higher priority, tighter deadline, and less number of duplications. This Importance Score really improves message dissemination and message management as shown in our evaluation (Section 6). IA R N H r v Ti Li−1 N Li p CO
Description Interested Area Radius of Interested Area # of nodes in IA # of hexagons covering IA Node’s trans. range Speed of node Broadcast period ith length Neighbor List during Ti−1 Neighbor List up to Ti Probability m is deleted Coverage of m
Table
3: Parameters Adaptive Estimator.
5.
used
in
analysis
C Moving direction
r
B Location of node at time t+T
Algorithm 1 Estimate broadcast period Ti for node n INPUT: α, Ti−1 , N Li , Li−1 BEGIN N Li = List of unique neighbors of n up to beginning of Ti ; Li−1 = List of new-unique neighbors of n during Ti−1 ; Ti = (α − |Li−1 |/|N Li |) × Ti−1 + Ti−1 ; return Ti ; END of
5.2. Times-to-Send Estimator In this section, we present how Estimator estimates T T S of messages. With a reasonable T T S value, nodes can terminate message dissemination on time to utilize network bandwidth and node memory space. Notice that T T S and deadline of a message m are orthogonal. The former is the number of times nodes can broadcast m. The latter specifies how long m remains valid to the network. As long as its deadline does not expire, m is broadcasted. Correspondingly, when m’s T T S gets maximal, it should be deleted. To derive T T S, we adapt analysis from [2] with suitable changes because analysis from [2] is for propagation of one message in the network without message deletion and no limitations of network bandwidth and node memory space. We assume that N nodes uniformly distributed in cir-
ADAPTIVE ESTIMATOR
In the following sections, we present analysis and corresponding estimations of T and T T S. Table 3 lists all parameters used by Estimator to estimate T and T T S.
5.1. Broadcast Period Estimator In reality, due to the heterogeneity of MANET, node density and node speed are not uniformly distributed. For example, a node n can move from a dense location to a sparse location or it can move with different speeds in different periods. Therefore, using a constant broadcast period is not suited for this realistic situation [2]. In this section, we present a formula to adaptively estimate the length of broadcast period Ti as follows: Ti = (α − |Li−1 |/|N Li |) × Ti−1 + Ti−1
r
Figure 2: Initial T = 2r/v In which, α is a constant in range (0,1) specifies the threshold to estimate Ti from Ti−1 (e.g. α = 0.2). If the ratio |Li−1 |/|N Li | greater than α we shorten the broadcast period proportional to (α - |Li−1 |/|N Li |). In contrast, if |Li−1 |/|N Li | is smaller than α, period broadcast should be lengthened, again proportional to (α |Li−1 |/|N Li |). By applying formula 3, we can smooth out short-term fluctuations of broadcast period and tune it adaptively. For example, node n moves into a dense network and its Li−1 changes significantly, we shorten Ti so that n can broadcast more to its dense vicinity. In contrast, if n is in a sparse node density location or it moves very slowly, and hence its Li−1 changes slightly, we lengthen Ti so that n can save network bandwidth. Figure 2 shows a node n moving from A to B through C, with AC = BC = r. Because we expect that any time we send a message, the covered area of the message is maximized. Therefore, initial value of T can be 2r/v, in which r is transmission range and v is node speed. Algorithm 1 applies formula 3 to obtain Ti from Ti−1 .
Value/Unit |IA| = πR2 Integer Integer √ |IA|/(6r2 3/4) meter meter/second second list of nodes Sj=i−1 Lj j=1 [0,1] # of nodes our
A Location of node at time t
(3)
4
Name N A r v TTS SB k M AXDL M AXP RI M AXDU P α
20 Ave. degree = 10, R/r=10
18
Ave. degree = 10, R/r=20
TTS Values
16
Ave. degree = 10, R/r=30 Ave. degree = 20, R/r=10
14 Ave. degree = 20, R/r=20 Ave. degree = 20, R/r=30
12 10 8 6 4
0
0.1
0.2
0.3
0.4
0.5
0.6
0.7
0.8
0.9
Value/Unit 60 50x50m2 [6,7,8]m 5mps 12 40 messages [25,35,50]% of SB 500 seconds 2: low/high 30 messages [0.25, 0.3, 0.35]
Table 4: Simulation settings.
Probability of deletion p
semination on time and thus utilize network bandwidth and node memory space. We present algorithm 2 to estimate T T S for a message m. This algorithm is performed by the Estimator only one time when node n joins the network. All subsequent messages created by n have this estimated T T S. Upon the network population changes significantly, n might need to rerun algorithm 2 to re-estimate a new T T S.
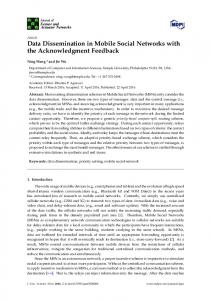
Figure 3: T T S increases when p increases, Ave. degree = N/H
cle area IA and periodically broadcasts a message m with a fixed broadcast period T . Further, we assume that during each T , p is the percentage of message m deleted by nodes in IA and m has no deadline (Refer Table 3 for all parameters). We also assume that the area covered by transmission range of a node n is a hexagon with area √ 6r2 3/4. Let H be the √ number of hexagons covering IA, 2 we have H = |IA|/(6r 3/4). So, the number of nodes in each hexagon (or the average degree of node) is N/H. Let CO(t) be the expected number of nodes which has received the message m at time t (or the coverage of m at time t). Because CO(t) is non-decreasing, we have CO(t + 1) ≥ CO(t). Our T T S value should be the minimum value δ at which CO(t0 + δT ) ≈ N . Next, we derive a proposition to estimate this minimum T T S. Proposition: The expected number of nodes which have received (or known) a given message at time t0 + (δ + 1)T satisfies CO(t0 + (δ + 1)T ) ≥ (1 − p){N × (1 + eCO(t0 +δT )1/H )}
Algorithm 2 Estimate T T S INPUT N - number of nodes; p - probability message is deleted IA = πR2 - area of interest H = πR2 /(2.6 × r2 ) - number of hexagons covering IA BEGIN δ = 0; CO(t0 ) = 1; T T S=0; while (CO(t0 + δT ) < N ) do CO(t0 + (δ + 1)T ) = (1 − p){N − N (1 − 1/H)CO(t0 +δT ) }; T T S ++; δ + +; end while return T T S; END
6.
Proof: Let t ⊆ (t0 + δT, t0 + (δ + 1)T ), there exists CO(t0 + δT ) nodes knowing message m. The probability that a hexagon with radius r does not contain any nodes in CO(t0 + δT ) nodes is (1 − 1/H)CO(t0 +δT ) . Therefore, at time t0 + (δ + 1)T , the expected number of hexagons which contains at least one node knowing m is H(1 − (1 − 1/H)CO(t0 +δT ) ). Notice that m gets deleted with probability p at each node. Therefore, among H(1 − (1 − 1/H)CO(t0 +δT ) ) nodes, there are (1 − p){H(1 − (1 − 1/H)CO(t0 +δT ) )}nodes broadcasting m at time t. For shorter notation, let ∆ be CO(t0 + δT ), we have: CO(t0 + (δ + 1)T )
Description Number of nodes Area of interest Trans. range Max speed of node Times-To-Send Sending buffer Top k messages Max deadline Max priority Max duplication Thres. to tune T
EVALUATION
6.1. Simulation Settings We use N S2 as our simulator and Random Way Point mobility model to simulate node mobility. Random Way Point mobility model is suited for Disaster/Recovery scenario because in this scenario nodes tend to move randomly. Table 4 shows our simulation settings. Particularly, the simulation time is 1000s. In the first 500s, 15 nodes randomly generate 200 messages with size 512byte and interval between messages is 10s. Deadline of messages is generated randomly from 300s to 500s. The maximal sending buffer size SB (or memory size) of each node is 40 messages. T T S is estimated by Algorithm 2. We perform each simulation 10 runs and plot the average. In our context, a message is considered to be a M eet Deadline message if it is delivered to at least 90% of nodes in the network before its deadline expires. We also define weighted Importance Score as follows:
= (N/H){H[1 − (1 − 1/H)∆ ]}(1 − p) = (1 − p){N − N × (1 − 1/H)∆ } ≥ (1 − p){N × (1 − eCO(t0 +δT )1/H )}
Figure 3 shows the relationship between p and T T S under different average degrees and transmission ranges. In this figure, when p increases, T T S increases accordingly. In particular, when p = 0.5, T T S values of all configurations are less than 10. However, when p = 0.8, T T S values increases up to 20. This confirms that a good estimation of T T S allows nodes to terminate dis-
wIm(m) = a · P ri(m) − b · T ime2Dline(m) − Dup(m) (4)
5
Prefer Deadline to Priority−High priority message
80 60 40 20 0
6
Prefer Priority to Deadline−High priority message
7
120 k/SB=0.25 k/SB=0.35 k/SB=0.5
100 80 60 40 20 0
8
6
Transmission range (m)
7
Meet Deadline (%)
100
Prefer Deadline to Priority−Low priority message 120
k/SB=0.25 k/SB=0.35 k/SB=0.5
Meet Deadline (%)
Meet Deadline (%)
120
100 80 60 40 20 0
8
k/SB=0.25 k/SB=0.35 k/SB=0.5
6
Transmission range (m)
7
8
Transmission range (m)
(a) a < b with high priority message (b) a < b with low priority message (c) a > b with high priority message Prefer Priority to Deadline−Low priority message
Equal Preference−High priority message
80 60 40 20
6
7
120 k/SB=0.25 k/SB=0.35 k/SB=0.5
100 80 60 40 20 0
8
6
Transmission range (m)
7
Meet Deadline (%)
100
0
Equal Preference−Low priority message
120 k/SB=0.25 k/SB=0.35 k/SB=0.5
Meet Deadline (%)
Meet Deadline (%)
120
80 60 40 20 0
8
k/SB=0.25 k/SB=0.35 k/SB=0.5
100
6
Transmission range (m)
7
8
Transmission range (m)
(d) a > b with low priority message (e) a = b with high priority message (f) a = b with low priority message
Figure 4: Fixed T scheme. The M eet Deadline metric has improvements with larger transmission range and greater k. Also, equal preference scheme has more “balanced results”. Meet Deadline (%)
Meet Deadline (%)
100
Prefer Priority to Deadline 120
k/SB=0.25 k/SB=0.35 k/SB=0.5
80 60 40 20 0
6
7
8
100 80 60 40 20 0
Prefer Deadline to Priority 120
k/MEM=0.25 k/MEM=0.35 k/SP=0.5
Meet Deadline (%)
Equal Preference 120
6
7
8
100
k/SB=0.25 k/SB=0.35 k/SP=0.5
80 60 40 20 0
6
7
8
Transmission range (m)
Transmission range (m)
Transmission range (m)
(a) a = b
(b) a > b
(c) a < b
Figure 5: Tunable T scheme (with α = 0.3 and high priority messages) has better results than fixed T . Equal preference scheme has lowest M eet Deadline metric. get higher chance to be delivered. Figure 4 also presents the difference between high and low priority messages. Particularly, when the deadline is preferred, Figure 4(a) shows that the number of high priority messages meet deadlines is from 79% to 89%. Meanwhile, the number of low priority messages (as shown in Figure 4(b)) varies from 12% to 38%. Correspondingly, in case of priority preferred scheme, Figures 4(c) and 4(d) indicate that the number of messages meet deadlines is from 72% to 92%, and from 10% and 31%, for high and low priority messages respectively. The differences between priority preferred scheme and deadline preferred scheme are also shown in Figure 4, especially in Figures 4(b) and 4(d). In particular, number of high priority messages in Figure 4(b) that meet deadlines is higher than that of Figure 4(d). This is because when the deadline is preferred, the message with tighter deadline would be forwarded prior to other messages. This is especially true for low priority messages which are usually ignored by the priority preferred scheme. In case of equal preference, Figures 4(e) and 4(f) show more “balanced results”. Specifically, high priority messages have the M eet Deadline metric from 60%
In which, a and b are weights denoting either priority or deadline is preferred. In reality, depending on different scenarios, priority can be set with higher weight than that of deadline, resulting in weighted combination. For example, nodes need to forward emergency messages immediately regardless of their deadlines. If a > b, we have priority preferred scheme. If a < b, we have deadline preferred scheme. We have equal preference scheme if a = b. Next, we present our results with M eet Deadline metric, weighted Importance Score, and the broadcast period T .
6.2. Fixed broadcast period T First, we evaluate our protocol with fixed broadcast period T (i.e. T = 2r/v). Figure 4 shows the relationship between M eet Deadline metric and transmission ranges with different k/SB ratios. From this Figure we can see that M eet Deadline increases if either transmission range or ratio k/SB increases. Obviously, with larger transmission range, node covers larger area for each broadcast, and thus, the message is disseminated to the network more quickly. Similarly, as k increases, node n can send more messages each broadcast, thus messages 6
Prefer Deadline to Priority−High priority message
Meet Deadline (%)
obtain maximal area coverage and minimal delay in D/R dissemination. Once the D/R messages are ranked, our protocol broadcasts top k, tuning broadcast period according to node density and node speed. We also estimate times-to-send T T S of a message to limit unnecessary transmissions. Our simulation results show that Importance Score differentiates and prioritizes messages so that more important messages can cover the network. Tunable T scheme further improves the performance of our framework. In the future, we plan to investigate this framework with other mobility models and find the optimal values of α for different networks.
k/SB=0.25 k/SB=0.35 k/SB=0.5
120 100 80 60 40 20 0 2
2.5
3
3.5
4
Figure 6: For different α values and r=7, tunable T scheme always has more than 86% of M eet Deadline metric. to 85%, and that of low priority messages is from 20% to 60%. This results from the fact that the equal preference scheme treats messages equally in terms of deadline and priority. In conclusion, under limitations of network bandwidth, node memory space, and deadline constraint of messages, Importance Score differentiates, prioritizes high priority messages and disseminates them prior to low priority messages. This obviously improves performance of the system because we would rather high priority messages cover the network by their deadlines.
References [1] M. Grossglauser and D. N. C. Tse. Mobility increases the capacity of ad-hoc wireless networks. In 21st IEEE Inforcom, pages 1360–1369, April 2001. [2] W. He, Y. Huang, K. Nahrstedt, and W. C. Lee. Mobiherald: Alert propagation in mobile ad hoc networks. Technical report, Department of Computer Science, Univeristy of Illinos at Urbana-Champaign, 2007.
6.3. Tunable broadcast period T
[3] C. Ho, K. Obraczka, G. Tsudik, and K. Viswanath. Flooding for reliable multicast in multi-hop ad hoc networks. In The 3rd International Workshop on Discrete Algorithms and Methods for Mobile Computing and Communications, pages 64 – 71, 1999.
Figure 5 shows that tunable T scheme has better results than fixed T scheme. Particularly, the M eet Deadline metric increases up to 98% for k/SP = 0.5 and r = 8. This is because tunable T scheme allows nodes to adjust broadcast period according to node density and node speed. Therefore, nodes adapt better to network condition and effectively utilize network bandwidth and their memory spaces. Figure 6 shows the M eet Deadline metric for high priority D/R messages, with different values of α. Tunable T scheme always has from 86% to 98% of the M eet Deadline metric. This result is an improvement over fixed T scheme. In conclusion, tunable T scheme improves the performance of our protocol. In a large-scale network, we believe that this scheme can further impact data dissemination due the heterogeneity in terms of node density, node speed, node memory space, etc. Obviously, the optimal value of α depends on various parameters such as the node density, node speed, etc. Finding the optimal values of α, thus, is left as our future work.
7.
[4] H. Lim and C. Kim. Multicast tree construction and flooding in wireless ad hoc networks. In The 3rd ACM international workshop on Modeling, analysis, and simulation of wireless and mobile systems, 2000. [5] X. Lin, G. Sharma, R. R. Mazumdar, and N. B. Shroff. Degenerate delay-capacity trade-offs in ad hoc networks with Brownian mobility. IEEE Transaction on Information Theory, pages 2777–2784, 2006. [6] W. Lou and J. Wu. Double-covered broadcast (dcb): a simple reliable broadcast algorithm in manets. In 23rd IEEE Inforcom, pages 2084–2095, 2004. [7] S.-Y. Ni, Y.-C. Tseng, Y.-S. Chen, and J.-P. Sheu. The broadcast storm problem in a mobile ad hoc network. In The 5th Annual ACM/IEEE International Conference on Mobile Computing and Networking, 1999. [8] K. Obraczka and G. Tsudik. Multicast routing issues in ad hoc networks. In IEEE International Conference on Universal Personal Communication (ICUPC), 1999.
CONCLUSION
[9] T. Small and Z. J. Haas. The shared wireless infostation model - a new ad hoc networking paradigm (or where there is a whale, there is a way). In Symposium on Mobile Ad Hoc Networking and Computing, 2003.
To the best of our knowledge, this paper is the first work solving the problem of data dissemination in M AN ET to obtain delay and coverage objectives under limitations of network bandwidth and node memory space. Our adaptive mobility-assisted data dissemination framework is based on “Importance Score” of D/R messages to optimize the number of disseminations and discard invalid D/R messages. The corresponding “Importance Score” function ranks D/R messages according to metrics that
[10] A. Vahdat and D. Becker. Epidemic routing for partially connected ad hoc networks. Technical report, Department of Computer Science, Duke University, 2000. [11] O. Wolfson and B. Xu. Opportunistic dissemination of spatio-temporal resource information in mobile peer to peer networks. In IEEE International Conference on Mobile Data Management, 2004.
7